React-native-chart-kit: How to hide Y-axis label and shadow line
Hello Hermanya,
I use the LineChart,It looks like this.

Code:
 <LineChart
          data={{
                    labels: ['01', '02', '03', '04'],
                    datasets: [{
                        data: [
                            Math.random() * 100,
                            Math.random() * 100,
                            Math.random() * 100,
                            Math.random() * 100
                        ],
                        color: (opacity = 1) => `rgba(19, 155, 255, ${opacity})`
                    }]
                }}
                width={Dimensions.get('window').width} // from react-native
                height={220}
                withShadow={false}
                withOuterLines={false}
                chartConfig={{
                    withShadow: false,
                    withOuterLines: false,
                    backgroundColor: '#fff',
                    backgroundGradientFrom: '#fff',
                    backgroundGradientTo: '#fff',
                    decimalPlaces: 2, // optional, defaults to 2dp
                    color: (opacity = 1) => `rgba(90, 90, 90, ${opacity})`,
                    style: {
                        borderRadius: 16
                    }
                }}
                bezier
                style={{
                    marginVertical: 8,
                    borderRadius: 16
                }}
            />
I want to hide Y-axis label and shadow line,like this (tootip is not belong to chart)

can you help me
 azui007
All 6 comments
Did you find a solution? I need exactly the same thing: to hide labels completely.
 canpoyrazoglu
on 21 May 2019
canpoyrazoglu
on 21 May 2019
There is no out of the box solution for this, but I would welcome a PR.
 Hermanya
on 21 May 2019
Hermanya
on 21 May 2019
you can usewithHorizontalLabels={false}as a property to your LineChart element
and inside chartConfig use
propsForBackgroundLines:{
stroke:"#ffffff"
}
or equal to your background color
 i1990jain
on 17 Dec 2019
i1990jain
on 17 Dec 2019
withHorizontalLabels={false} is not working with StackedBarChart
 OskarJuszczyk
on 23 Jan 2020
OskarJuszczyk
on 23 Jan 2020
withHorizontalLabels={false} works on LineChart however it still leaves an empty space to the left of the chart. Ideally, disabling it, would also extend the chart to use the entire available width.
 zanona
on 16 Jun 2020
zanona
on 16 Jun 2020
@azui007 @zanona
Hey guys, taking a look at the source, there is a default paddingRight of 64 if it is not provided in the style prop. So you can set paddingRight to 0 explicitly to get your expected result. I ran into this same problem just now, here's my graph:
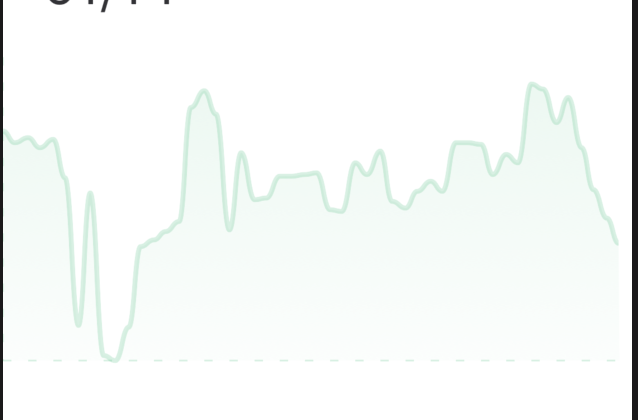
And the code:
<Linechart
..some props
style={{ paddingRight: 0 }}
/>
 connoremma
on 5 Sep 2020
connoremma
on 5 Sep 2020
Related issues
 bhoomika911
·
4Comments
bhoomika911
·
4Comments
 NS-BOBBY-C
·
5Comments
NS-BOBBY-C
·
5Comments
 violabg
·
6Comments
violabg
·
6Comments
 stebogit
·
3Comments
stebogit
·
3Comments
 ighormartins
·
3Comments
ighormartins
·
3Comments
Most helpful comment
@azui007 @zanona
Hey guys, taking a look at the source, there is a default paddingRight of 64 if it is not provided in the style prop. So you can set
paddingRightto 0 explicitly to get your expected result. I ran into this same problem just now, here's my graph:And the code: