React-native-chart-kit: The graph is not accurate
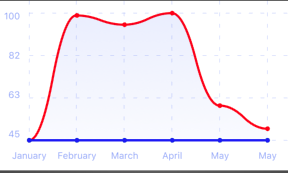
The graph is not accurate

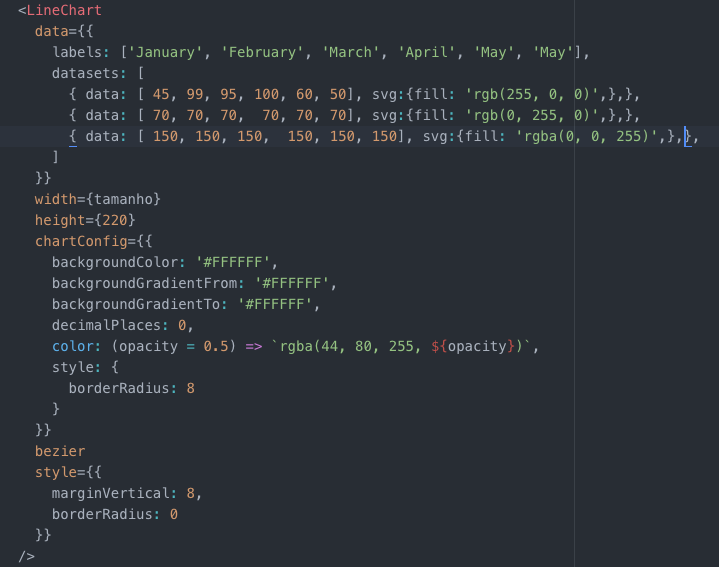
This is the dataset

1st array is the red line,
2nd is the green line
_Originally posted by @BrightonWeBill in https://github.com/indiespirit/react-native-chart-kit/issues/37#issuecomment-442839205_
 medexsaude
All 7 comments
The graph is not accurate
medexsaude
on 3 Jan 2019
Hi @medexsaude have you found the solution?
 rzdev
on 8 Jan 2019
rzdev
on 8 Jan 2019
@medexsaude Are you trying to get multiple graph lines?
 mrfambo
on 8 Jan 2019
mrfambo
on 8 Jan 2019
@medexsaude @rzdev If you both have any repository which i can clone and look into the details, it will be great. Otherwise please provide a reproduction of your issue somewhere. When i worked for multiple lines, i had the required results. I would love to solve if there is any issue i can work on.
mrfambo
on 8 Jan 2019
@mrfambo i have created a simple application to replicate the issue, please clone the project here https://github.com/rzdev/line_chart
The chart data consists of 3 dataset :
const data = {
labels: ['January', 'February', 'March', 'April', 'May', 'June'],
datasets: [
{ data: [ 50, 50, 50, 50, 50, 50 ] },
{ data: [ 20, 20, 20, 20, 20, 20 ] },
{ data: [ 60, 60, 60, 60, 60, 60 ] }]
};
But it only show 1 line:

rzdev
on 8 Jan 2019
@rzdev Looking to it, will respond as soon as possible.
mrfambo
on 8 Jan 2019
@mrfambo thanks for the quick response, note: if i used the example dataset for multiple graph lines :
const data = {
  labels: ['January', 'February', 'March', 'April', 'May', 'June'],
  datasets: [{
    data: [
      50,
      20,
      2,
      86,
      71,
      100
    ]
  },{
    data: [
      20,
      10,
      4,
      56,
      87,
      90
    ]
  },{
    data: [
      30,
      90,
      67,
      54,
      10,
      2
    ]
  }]
}
then it works, but when trying with the above datasets it doesnt work
rzdev
on 8 Jan 2019
Related issues
 violabg
·
6Comments
violabg
·
6Comments
 azui007
·
6Comments
azui007
·
6Comments
 ighormartins
·
3Comments
ighormartins
·
3Comments
 carlojesuscponti
·
6Comments
carlojesuscponti
·
6Comments
 trungtin2202
·
3Comments
trungtin2202
·
3Comments
Most helpful comment
@mrfambo thanks for the quick response, note: if i used the example dataset for multiple graph lines :
const data = {
  labels: ['January', 'February', 'March', 'April', 'May', 'June'],
  datasets: [{
    data: [
      50,
      20,
      2,
      86,
      71,
      100
    ]
  },{
    data: [
      20,
      10,
      4,
      56,
      87,
      90
    ]
  },{
    data: [
      30,
      90,
      67,
      54,
      10,
      2
    ]
  }]
}
then it works, but when trying with the above datasets it doesnt work