React-chartjs-2: Rounded Corners (TOP and Bottom) for Bar Chart
How do you create rounded corners on the top and bottom of a bar chart?
I am attempting to create a stacked bar graph as pictured below:
I am currently attempting to use react-chartjs-2 to bring this chart to life.
After hours of searching online, I have only been able to create rounded corners for the top of each bar.
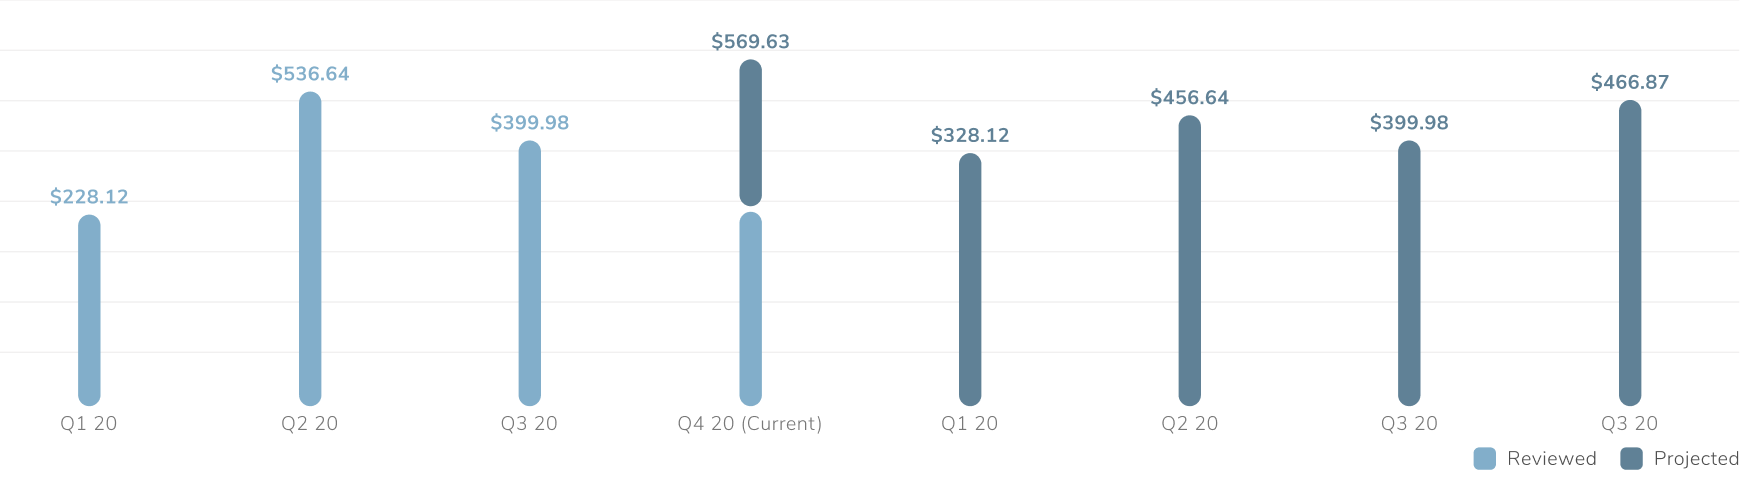
Here is a picture of what I have so far:

I am importing a custom JS file into my react component to make the image above.
Here is the custom JS I am using:
ChartJS.elements.Rectangle.prototype.draw = function () {
  const { ctx } = this._chart;
  const vm = this._view;
  let left; let right; let top; let bottom; let signX; let signY; let
    borderSkipped;
  let { borderWidth } = vm;

  // If radius is less than 0 or is large enough to cause drawing errors a max
  // radius is imposed. If cornerRadius is not defined set it to 0.
  let { cornerRadius } = this._chart.config.options;
  if (cornerRadius < 0) { cornerRadius = 0; }
  if (typeof cornerRadius === 'undefined') { cornerRadius = 0; }

  if (!vm.horizontal) {
    left = vm.x - vm.width / 2;
    right = vm.x + vm.width / 2;
    top = vm.y;
    bottom = vm.base;
    signX = 1;
    signY = bottom > top ? 1 : -1;
    borderSkipped = vm.borderSkipped || 'bottom';
  }

  // Canvas doesn't allow us to stroke inside the width so we can
  // adjust the sizes to fit if we're setting a stroke on the line
  if (borderWidth) {
    // borderWidth shold be less than bar width and bar height.
    const barSize = Math.min(Math.abs(left - right), Math.abs(top - bottom));
    borderWidth = borderWidth > barSize ? barSize : borderWidth;
    const halfStroke = borderWidth / 2;
    // Adjust borderWidth when bar top position is near vm.base(zero).
    const borderLeft = left + (borderSkipped !== 'left' ? halfStroke * signX : 0);
    const borderRight = right + (borderSkipped !== 'right' ? -halfStroke * signX : 0);
    const borderTop = top + (borderSkipped !== 'top' ? halfStroke * signY : 0);
    const borderBottom = bottom + (borderSkipped !== 'bottom' ? -halfStroke * signY : 0);
    // not become a vertical line?
    if (borderLeft !== borderRight) {
      top = borderTop;
      bottom = borderBottom;
    }
    // not become a horizontal line?
    if (borderTop !== borderBottom) {
      left = borderLeft;
      right = borderRight;
    }
  }

  ctx.beginPath();
  ctx.fillStyle = vm.backgroundColor;
  ctx.strokeStyle = vm.borderColor;
  ctx.lineWidth = borderWidth;

  // Corner points, from bottom-left to bottom-right clockwise
  // | 1 2 |
  // | 0 3 |
  const corners = [
    [left, bottom],
    [left, top],
    [right, top],
    [right, bottom],
  ];

  // Find first (starting) corner with fallback to 'bottom'
  const borders = ['bottom', 'left', 'top', 'right'];
  let startCorner = borders.indexOf(borderSkipped, 0);
  if (startCorner === -1) {
    startCorner = 0;
  }

  function cornerAt(index) {
    return corners[(startCorner + index) % 4];
  }

  // Draw rectangle from 'startCorner'
  let corner = cornerAt(0);
  ctx.moveTo(corner[0], corner[1]);

  for (let i = 1; i < 4; i++) {
    corner = cornerAt(i);
    let nextCornerId = i + 1;
    if (nextCornerId == 4) {
      nextCornerId = 0;
    }

    const width = corners[2][0] - corners[1][0];
    const height = corners[0][1] - corners[1][1];
    const x = corners[1][0];
    const y = corners[1][1];

    let radius = cornerRadius;

    // Fix radius being too large
    if (radius > Math.abs(height) / 1.5) {
      radius = Math.floor(Math.abs(height) / 1.5);
    }
    if (radius > Math.abs(width) / 1.5) {
      radius = Math.floor(Math.abs(width) / 1.5);
    }

    if (height < 0) {
      // Negative values in a standard bar chart
      const x_tl = x; const x_tr = x + width;
      const y_tl = y + height; const y_tr = y + height;

      const x_bl = x; const x_br = x + width;
      const y_bl = y; const y_br = y;

      // Draw
      ctx.moveTo(x_bl + radius, y_bl);
      ctx.lineTo(x_br - radius, y_br);
      ctx.quadraticCurveTo(x_br, y_br, x_br, y_br - radius);
      ctx.lineTo(x_tr, y_tr + radius);
      ctx.quadraticCurveTo(x_tr, y_tr, x_tr - radius, y_tr);
      ctx.lineTo(x_tl + radius, y_tl);
      ctx.quadraticCurveTo(x_tl, y_tl, x_tl, y_tl + radius);
      ctx.lineTo(x_bl, y_bl - radius);
      ctx.quadraticCurveTo(x_bl, y_bl, x_bl + radius, y_bl);
    } else {
      ctx.moveTo(x + radius, y);
      ctx.lineTo(x + width - radius, y);
      ctx.quadraticCurveTo(x + width, y, x + width, y + radius);
      ctx.lineTo(x + width, y + height - radius);
      ctx.quadraticCurveTo(x + width, y + height, x + width, y + height);
      ctx.lineTo(x + radius, y + height);
      ctx.quadraticCurveTo(x, y + height, x, y + height);
      ctx.lineTo(x, y + radius);
      ctx.quadraticCurveTo(x, y, x + radius, y);
    }
  }

  ctx.fill();
  if (borderWidth) {
    ctx.stroke();
  }
};
I am requiring this into my React component as such:
import React from 'react';
import { Bar } from 'react-chartjs-2';
const data = {
  labels: ['January', 'February', 'March', 'April', 'May', 'June', 'July'],
  datasets: [
    {
      label: 'My First dataset',
      backgroundColor: `${B800}`,
      borderColor: `${B800}`,
      borderWidth: 0,
      hoverBackgroundColor: `${B800}`,
      hoverBorderColor: `${B800}`,
      data: [65, 59, 80, 81, 56, 55, 40],
    },
    {
      label: 'Second',
      backgroundColor: `${B900}`,
      borderColor: `${B900}`,
      borderWidth: 0,
      hoverBackgroundColor: `${B900}`,
      hoverBorderColor: `${B900}`,
      data: [10, 10, 10, 10, 10, 10, 10],
    },
  ],
};

require('./CustomRoundedBarChart.js');

const Component = ({ dividends }: any) => {
  return (

          <Bar

            data={data}
            options={{
              cornerRadius: 10,
              maintainAspectRatio: false,
              legend: { display: false },
              layout: {
                padding: {
                  top: 25,
                  bottom: 20,
                },
              },
              scales: {
                xAxes: [
                  {
                    barThickness: 16,
                    display: true,
                    gridLines: {
                      display: false,
                    },
                    labels: data.labels,
                    ticks: {
                      autoSkip: false,
                    },
                    stacked: true,
                  },
                ],
                yAxes: [{
                  stacked: true,
                },
                ],
              },
            }}

          />

  );
};

export default Example;
 tmswartz12
🎉2
👀1
>All comments
Hey !
Maybe you could make that with this: https://codepen.io/re4388/pen/LwPRbo?editors=1000
I use the same solution as you but I didn't use the if of _negative values_
Instead I use the code of the codepen with some changes:
ChartJS.elements.Rectangle.prototype.draw = function () {
  const { ctx } = this._chart
  const vm = this._view
  let left
  let right
  let top
  let bottom
  let signX
  let signY
  let borderSkipped
  let { borderWidth } = vm

  let { cornerRadius } = this._chart.config.options
  if (cornerRadius < 0) { cornerRadius = 0 }
  if (typeof cornerRadius == 'undefined') { cornerRadius = 0 }

  if (!vm.horizontal) {
    // bar
    left = vm.x - vm.width / 2
    right = vm.x + vm.width / 2
    top = vm.y
    bottom = vm.base
    signX = 1
    signY = bottom > top ? 1 : -1
    borderSkipped = vm.borderSkipped || 'bottom'
  } else {
    // horizontal bar
    left = vm.base
    right = vm.x
    top = vm.y - vm.height / 2
    bottom = vm.y + vm.height / 2
    signX = right > left ? 1 : -1
    signY = 1
    borderSkipped = vm.borderSkipped || 'left'
  }

  if (borderWidth) {
    // borderWidth shold be less than bar width and bar height.
    const barSize = Math.min(Math.abs(left - right), Math.abs(top - bottom))
    borderWidth = borderWidth > barSize ? barSize : borderWidth
    const halfStroke = borderWidth / 2
    // Adjust borderWidth when bar top position is near vm.base(zero).
    const borderLeft = left + (borderSkipped !== 'left' ? halfStroke * signX : 0)
    const borderRight = right + (borderSkipped !== 'right' ? -halfStroke * signX : 0)
    const borderTop = top + (borderSkipped !== 'top' ? halfStroke * signY : 0)
    const borderBottom = bottom + (borderSkipped !== 'bottom' ? -halfStroke * signY : 0)

    // not become a vertical line?
    if (borderLeft !== borderRight) {
      top = borderTop
      bottom = borderBottom
    }
    // not become a horizontal line?
    if (borderTop !== borderBottom) {
      left = borderLeft
      right = borderRight
    }
  }

  ctx.beginPath()
  ctx.fillStyle = vm.backgroundColor
  ctx.strokeStyle = vm.borderColor
  ctx.lineWidth = borderWidth

  // Corner points, from bottom-left to bottom-right clockwise
  // | 1 2 |
  // | 0 3 |
  const corners = [
    [left, bottom],
    [left, top],
    [right, top],
    [right, bottom],
  ]

  // Find first (starting) corner with fallback to 'bottom'
  const borders = ['bottom', 'left', 'top', 'right']
  let startCorner = borders.indexOf(borderSkipped, 0)
  if (startCorner === -1) {
    startCorner = 0
  }

  function cornerAt(index) {
    return corners[(startCorner + index) % 4]
  }

  // Draw rectangle from 'startCorner'
  let corner = cornerAt(0)
  ctx.moveTo(corner[0], corner[1])

  for (let i = 1; i < 4; i++) {
    corner = cornerAt(i)
    let nextCornerId = i + 1
    if (nextCornerId == 4) {
      nextCornerId = 0
    }

    const width = corners[2][0] - corners[1][0]
    const height = corners[0][1] - corners[1][1]
    const x = corners[1][0]
    const y = corners[1][1]

    let radius = cornerRadius

    // Fix radius being too large
    if (radius > height / 2) {
      radius = height / 2
    } if (radius > width / 2) {
      radius = width / 2
    }

    ctx.moveTo(x + radius, y)
    ctx.lineTo(x + width - radius, y)
    ctx.quadraticCurveTo(x + width, y, x + width, y + radius)
    ctx.lineTo(x + width, y + height - radius)
    ctx.quadraticCurveTo(x + width, y + height, x + width - radius, y + height)
    ctx.lineTo(x + radius, y + height)
    ctx.quadraticCurveTo(x, y + height, x, y + height - radius)
    ctx.lineTo(x, y + radius)
    ctx.quadraticCurveTo(x, y, x + radius, y)
  }

  ctx.fill()
  if (borderWidth) {
    ctx.stroke()
  }
}
And you can require that file inside your component
Result

 juanRebolledo
on 7 Jan 2021
juanRebolledo
on 7 Jan 2021
👍2
🎉1
Was this page helpful?
0 / 5 - 0 ratings
Related issues
 ekobayu
·
5Comments
ekobayu
·
5Comments
 thanh121094
·
3Comments
thanh121094
·
3Comments
 flxwu
·
3Comments
flxwu
·
3Comments
 cbroberg
·
5Comments
cbroberg
·
5Comments
 Pringels
·
4Comments
Pringels
·
4Comments
Most helpful comment
Hey !
Maybe you could make that with this: https://codepen.io/re4388/pen/LwPRbo?editors=1000
I use the same solution as you but I didn't use the if of _negative values_
Instead I use the code of the codepen with some changes:
And you can require that file inside your component
Result
