Ray: Memory leak when simple worker returns a numpy object
System information
- OS Platform and Distribution (e.g., Linux Ubuntu 16.04): Ubuntu 18.04 LTS x86_64
- Ray installed from (source or binary): binary (
pip install ray) - Ray version: 0.5.0
- Python version: Python 3.6.0 :: Continuum Analytics, Inc.
- Exact command to reproduce:
python main.py:
Describe the problem
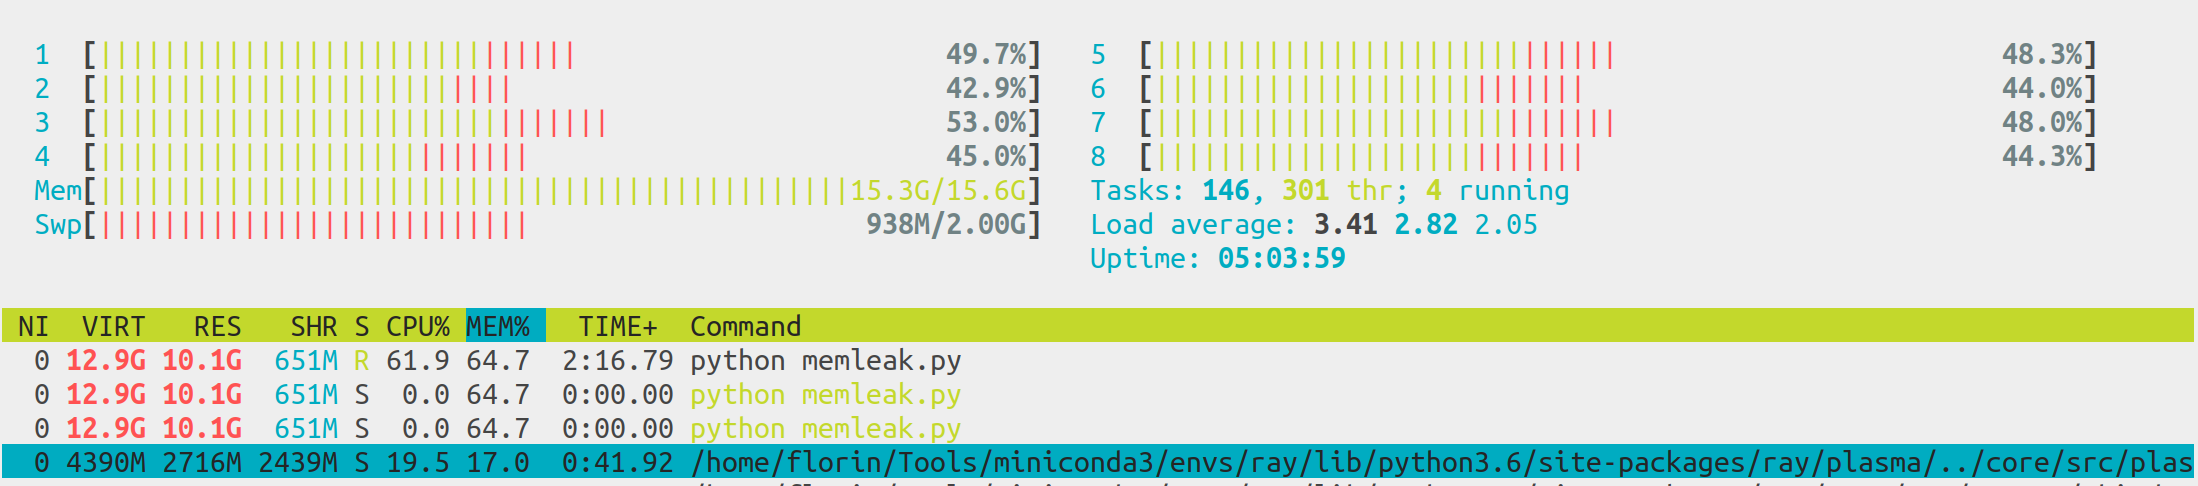
The code below results in a memory leak. The ring buffer in the main process containing numpy images should take about 10GB. However after the buffer cycles the memory continues increasing. With the parameters in the script below the memory will increase to 16GB in about 500,000 steps.
I also reproduced this behavior on a server with 126GB RAM and 40 threads. The system will be out of memory after a few tens of millions of steps (common on RL tasks).
I first noticed this with workers returning atari screens and tried to provide a minimal working example that reproduces the issue.
edit: the output of the script will seem fine, however top or similar will show the increasing memory usage.
Source code / logs
import os
import psutil
import gc

import random
import numpy as np
import ray

import pyarrow
import lz4.frame
import base64


def pack(data):
    data = pyarrow.serialize(data).to_buffer().to_pybytes()
    data = lz4.frame.compress(data)
    return base64.b64encode(data)


def unpack(data):
    data = base64.b64decode(data)
    data = lz4.frame.decompress(data)
    return pyarrow.deserialize(data)


@ray.remote(num_cpus=1, num_gpus=0)
def sample(step_cnt):
    # some pseudo-random "images" that can still be compressed.
    state = np.full((128, 128, 3), step_cnt % 255, dtype=np.uint8)
    state[24:48, 64:96, :] = np.random.randint(0, 255, (24, 32, 3), np.uint8)

    # display process memory
    if step_cnt % 50000 == 0:
        process = psutil.Process(os.getpid())
        proc_mem = process.memory_info().rss / (1024**2)
        print(f'actor_pid={process.pid} \t mem={proc_mem:6.1f} MB.')

    return pack(state)


def main():
    ray.init()

    actor_no = 10
    step_no = 5000000
    buff_sz = 200000

    # init buffer
    buffer = [None for i in range(buff_sz)]

    step_cnt = 0
    while step_cnt < step_no:

        states = ray.get([sample.remote(step_cnt) for i in range(actor_no)])

        for state in states:
            # add to buffer
            buffer[step_cnt % buff_sz] = unpack(state)
            step_cnt += 1

        # display process memory
        if step_cnt % 5000 == 0:
            print('-' * 30)
            print(f'steps={step_cnt} / buffer={len(buffer)}.')

            process = psutil.Process(os.getpid())
            proc_mem = process.memory_info().rss / (1024**2)
            print(f'main_pid={process.pid} \t mem={proc_mem:6.1f} MB.')
            print('-' * 30)

if __name__ == '__main__':
    main()
 floringogianu
All 32 comments
Thanks for sharing, let me look into this. I wonder if it can be reproduced using pyarrow without ray, did you do any more investigation in this direction?
 pcmoritz
on 19 Jul 2018
pcmoritz
on 19 Jul 2018
No, I only tried passing the numpy array without compressing and serializing it explicitly but I suppose it gets serialized with pyarrow anyway before being passed down to the main process. I did try passing lists instead of numpy and it seemed ok.
floringogianu
on 19 Jul 2018
So far I haven't been able to reproduce this, I'm on ubuntu 16.04, python 3.6, ray compiled from latest master:
steps=3220000 / buffer=200000.
main_pid=25604   mem=10304.2 MB.
------------------------------
------------------------------
steps=3225000 / buffer=200000.
main_pid=25604   mem=10324.8 MB.
------------------------------
------------------------------
steps=3230000 / buffer=200000.
main_pid=25604   mem=10349.6 MB.
------------------------------
------------------------------
steps=3235000 / buffer=200000.
main_pid=25604   mem=10370.2 MB.
------------------------------
------------------------------
steps=3240000 / buffer=200000.
main_pid=25604   mem=10390.8 MB.
------------------------------
------------------------------
steps=3245000 / buffer=200000.
main_pid=25604   mem=10411.5 MB.
------------------------------
------------------------------
steps=3250000 / buffer=200000.
main_pid=25604   mem=10436.2 MB.
------------------------------
------------------------------
steps=3255000 / buffer=200000.
main_pid=25604   mem=10456.8 MB.
------------------------------
------------------------------
steps=3260000 / buffer=200000.
main_pid=25604   mem=10477.5 MB.
------------------------------
------------------------------
steps=3265000 / buffer=200000.
main_pid=25604   mem=10502.2 MB.
------------------------------
------------------------------
steps=3270000 / buffer=200000.
main_pid=25604   mem=10522.8 MB.
------------------------------
I'm also going to try the 0.5 wheel.
pcmoritz
on 19 Jul 2018
Sorry, I forgot to mention above that the output will look fine for the main and workers, the memory usage will just seem to increase slightly. However take a look with htop and you will notice the memory keeps increasing.
floringogianu
on 19 Jul 2018
I see, for me the %MEM in htop for the main python process starts at ~30% in steady state, creeps up to ~40% max and then quickly drops to ~30%, slowly rising up to 40% and this pattern is repeating.
Are you seeing a similar pattern or is it just going up for you? I'm on a 32GB machine.
The memory of the redis server is increasing though, which is expected. We have a way to deal with that in http://ray.readthedocs.io/en/latest/redis-memory-management.html, which is experimental at the moment.
pcmoritz
on 20 Jul 2018
The "plasma_store" process (which is where we store objects), is designed to not start evicting any objects until it experiences some memory pressure. So it'd be interesting to see if the application ever actually dies due to an out-of-memory error or if it always successfully evicts objects before that happens. This could explain what you're seeing.
 robertnishihara
on 20 Jul 2018
robertnishihara
on 20 Jul 2018
For me it's definitely evicting and everything looks stable.
pcmoritz
on 20 Jul 2018
@robertnishihara I skimmed through the issues before posting and noticed one comment of yours saying that the plasma store uses up to 40% of the memory. So I decided to let it and see what eventually happens. On both the 126GB and the 16GB machines it actually went on using the swap at which point I killed the processes.
I will compile ray from master first time tomorrow morning and report back.
floringogianu
on 20 Jul 2018
Did you happen to see which process was using up all of the memory? Also note that you can install the latest wheels (to avoid compilation) by following the instructions at http://ray.readthedocs.io/en/latest/installation.html#trying-the-latest-version-of-ray.
robertnishihara
on 20 Jul 2018
@pcmoritz @robertnishihara You are right, the main and the workers seem stable. The redis plasma-store keeps growing in size. I'm reading the memory management link you provided above. Will also try the latest wheels. Thank you for your support, much appreciated!
floringogianu
on 20 Jul 2018
Just to clarify, "Redis" and the "plasma store" are two separate things.
We use the plasma store to store data (e.g., objects returned by tasks).
We use Redis to store metadata, e.g., specifications of tasks (which are used to rerun tasks if necessary) and data about which objects live on which machines (we actually start multiple Redis servers).
robertnishihara
on 20 Jul 2018
cc @concretevitamin
robertnishihara
on 20 Jul 2018
@robertnishihara, @pcmoritz Thanks for the clarifications and I apologize if my replies yesterday were a bit vague. I started making sense of the stack and did some more experiments today. Here are my observations.
In all the previous experiments the plasma object store was the one causing the swap writes. Based on https://github.com/ray-project/ray/issues/1175#issuecomment-341206695 I'd say that was because the default is set too high considering the ring buffer takes 10GB.
I configured the script with
ray.init(object_store_memory=1000000000)on the 16GB machine and 4GB on the 128GB/40 threads one and things started to behave :). The plasma object store is now using about 60% of the value I specified in theray.init(). Question: what is a good heuristic for setting this parameter?With the plasma store size fixed I noticed the
redisserver process was now the one increasing enough to provoke a swap write on the 16GB system in a few million steps (for example on the 128GB system the ~redis process is at 4.3GB after 4.4 million steps~ fourredis serverprocesses are using together ~70GB after 32 million steps). I will be experimenting with the new memory management feature. Question: how do you deal with theredisissue in your APEX implementation, where there are tens or hundreds of actors moving hundreds of millions of small objects?
The experiments above were carried both with the 0.5.0 release and the latest wheel.
floringogianu
on 20 Jul 2018
So I compiled ray from master with the flags specified in the redis memory management documentation and added the following lines to the script:
ray.init(...)

policy = ray.experimental.SimpleGcsFlushPolicy()
ray.experimental.set_flushing_policy(policy)
and executed it with RAY_USE_NEW_GCS=on RAY_USE_XRAY=1 python memleak.py.
It doesn't seem to be doing anything. I have one test running right now and the redis server mem usage is at 9GB already.
floringogianu
on 20 Jul 2018
@floringogianu Happy to help you debug the flushing issue.
Could you look for some hints for me, tail /tmp/raylogs/{monitor,redis}*? If they are too long head might be more informative. These logs might give us some clue.
 concretevitamin
on 20 Jul 2018
concretevitamin
on 20 Jul 2018
Thank you for looking into this, here are the logs. ~Should I disable Transparent Huge Pages (THP)? Is that an issue in your experience?~ I just did, no change.
➜  ~ tail /tmp/raylogs/{monitor,redis}*
==> /tmp/raylogs/monitor-2018-07-20_19-57-33-07285.err <==

==> /tmp/raylogs/monitor-2018-07-20_19-57-33-07285.out <==

==> /tmp/raylogs/redis-0-2018-07-20_19-57-33-08579.err <==
I0720 19:57:33.641261 16446 member.cc:952] GcsMode: kFlushOnlyUnsafe
I0720 19:57:33.641340 16446 member.cc:969] MasterMode: kRedis

==> /tmp/raylogs/redis-0-2018-07-20_19-57-33-08579.out <==
16446:C 20 Jul 19:57:33.636 # oO0OoO0OoO0Oo Redis is starting oO0OoO0OoO0Oo
16446:C 20 Jul 19:57:33.636 # Redis version=999.999.999, bits=64, commit=2a7f4fcd, modified=0, pid=16446, just started
16446:C 20 Jul 19:57:33.636 # Configuration loaded
16446:M 20 Jul 19:57:33.638 # WARNING: The TCP backlog setting of 511 cannot be enforced because /proc/sys/net/core/somaxconn is set to the lower value of 128.
16446:M 20 Jul 19:57:33.638 # Server initialized
16446:M 20 Jul 19:57:33.638 # WARNING overcommit_memory is set to 0! Background save may fail under low memory condition. To fix this issue add 'vm.overcommit_memory = 1' to /etc/sysctl.conf and then reboot or run the command 'sysctl vm.overcommit_memory=1' for this to take effect.
16446:M 20 Jul 19:57:33.638 # WARNING you have Transparent Huge Pages (THP) support enabled in your kernel. This will create latency and memory usage issues with Redis. To fix this issue run the command 'echo never > /sys/kernel/mm/transparent_hugepage/enabled' as root, and add it to your /etc/rc.local in order to retain the setting after a reboot. Redis must be restarted after THP is disabled.

==> /tmp/raylogs/redis-2018-07-20_19-57-33-08049.err <==
I0720 19:57:33.739295 16442 master.cc:143] First node joined.

==> /tmp/raylogs/redis-2018-07-20_19-57-33-08049.out <==
16442:C 20 Jul 19:57:33.523 # oO0OoO0OoO0Oo Redis is starting oO0OoO0OoO0Oo
16442:C 20 Jul 19:57:33.523 # Redis version=999.999.999, bits=64, commit=2a7f4fcd, modified=0, pid=16442, just started
16442:C 20 Jul 19:57:33.523 # Configuration loaded
16442:M 20 Jul 19:57:33.526 # WARNING: The TCP backlog setting of 511 cannot be enforced because /proc/sys/net/core/somaxconn is set to the lower value of 128.
16442:M 20 Jul 19:57:33.526 # Server initialized
16442:M 20 Jul 19:57:33.526 # WARNING overcommit_memory is set to 0! Background save may fail under low memory condition. To fix this issue add 'vm.overcommit_memory = 1' to /etc/sysctl.conf and then reboot or run the command 'sysctl vm.overcommit_memory=1' for this to take effect.
16442:M 20 Jul 19:57:33.526 # WARNING you have Transparent Huge Pages (THP) support enabled in your kernel. This will create latency and memory usage issues with Redis. To fix this issue run the command 'echo never > /sys/kernel/mm/transparent_hugepage/enabled' as root, and add it to your /etc/rc.local in order to retain the setting after a reboot. Redis must be restarted after THP is disabled.
@floringogianu THP should not affect this; one quick thing to try, though, is to not launch with RAY_USE_XRAY=1 but keep the other flag.
Looking at the logs it seems the correct components are started. Can you try in the command line: redis-cli -p <redis_port> info commandstats?
You can figure out <redis_port> by looking at the output printed out by ray.init(): it's the second port in the output (so in this case 42143):
ubuntu@ip-172-31-12-212:~/ray$ python bench.py
Detected environment variable 'RAY_USE_XRAY'.
Process STDOUT and STDERR is being redirected to /tmp/raylogs/.
Waiting for redis server at 127.0.0.1:22556 to respond...
Waiting for redis server at 127.0.0.1:42143 to respond...
@concretevitamin I think it is necessary to use RAY_USE_XRAY=1. As of #2329, legacy Ray only uses the old GCS code path.
@floringogianu To answer your question about how to set object_store_memory, really we'd prefer to just have a good default so people don't need to set this. However, it usually cannot be larger than 50% of the machine's memory because it's limited by the size of the shared memory filesystem, which on Linux, is usually 50% of the total memory. We use 40% by default, which seems to work in a lot of cases, though if you have Python processes that are using a lot of memory then maybe something more like 25% or 30% is appropriate.
However, if the default is not working well here then we should find a better heuristic for setting this.
robertnishihara
on 21 Jul 2018
@concretevitamin Launching with RAY_USE_NEW_GCS=on results in the same behaviour. Here is the output you asked:
(ray-build) ➜  ray git:(master) ./build/src/common/thirdparty/redis/src/redis-cli -p 63072 info commandstats
# Commandstats
cmdstat_publish:calls=3,usec=4,usec_per_call=1.33
cmdstat_MEMBER.CONNECT_TO_MASTER:calls=1,usec=114,usec_per_call=114.00
cmdstat_psubscribe:calls=1,usec=1,usec_per_call=1.00
cmdstat_HEAD.FLUSH:calls=1,usec=182,usec_per_call=182.00
cmdstat_ray.connect:calls=3,usec=126,usec_per_call=42.00
cmdstat_command:calls=1,usec=748,usec_per_call=748.00
cmdstat_subscribe:calls=3,usec=11,usec_per_call=3.67
cmdstat_ray.task_table_add:calls=1,usec=26,usec_per_call=26.00
cmdstat_config:calls=11,usec=80,usec_per_call=7.27
cmdstat_set:calls=1,usec=6,usec_per_call=6.00
cmdstat_client:calls=1,usec=25,usec_per_call=25.00
cmdstat_rpush:calls=2,usec=19,usec_per_call=9.50
@robertnishihara I will experiment with the plasma store size in the distributed experience replay implementation I'm trying write. Once the redis memory management is figured out we'll have a better idea how much we can allocate for the plasma store.
I apologize if I'm insisting, but how do you manage the redis memory in your RLlib ApeX implementation especially without the experimental feature? Maybe you simply experimented with separate machines for the main worker and the other actors and memory pressure from the redis storage wasn't becoming apparent even on longer experiments?
floringogianu
on 21 Jul 2018
Hey Florin - have been swamped & at a conference today. Will try to take a
deeper look. Is the script you posted your most recent version -- I can
run that in my environment.
On Sat, Jul 21, 2018 at 3:29 AM Florin Gogianu notifications@github.com
wrote:
@robertnishihara https://github.com/robertnishihara I will experiment
with the plasma store size in the distributed experience replay
implementation I'm trying write. Once the redis memory management is
figured out we'll have a better idea how much we can allocate for the
plasma store.I apologize if I'm insisting, but how do you manage the redis memory in
your RLlib ApeX implementation especially without the experimental feature?
Maybe you simply experimented with separate machines for the main worker
and the other actors and memory pressure from the redis storage wasn't
becoming apparent even on longer experiments?—
You are receiving this because you were mentioned.Reply to this email directly, view it on GitHub
https://github.com/ray-project/ray/issues/2430#issuecomment-406786518,
or mute the thread
https://github.com/notifications/unsubscribe-auth/AAkLHqCqA-RuXtAtzeBMqbtJwpFTm5P2ks5uIwJ0gaJpZM4VW9RR
.
concretevitamin
on 23 Jul 2018
Yes, depending on the memory available you can change the size of the ring buffer. Also the script above does not include the flush policy settings:
ray.init(...)

policy = ray.experimental.SimpleGcsFlushPolicy()
ray.experimental.set_flushing_policy(policy)
The script outputs the used memory on each process, but not the memory used by the redis-server and the plasma store. Thanks for looking into this.
floringogianu
on 23 Jul 2018
@floringogianu I don't think we did anything special to manage Redis memory issues when running Ape-X experiments. We probably were using machines with a large amount of memory.
robertnishihara
on 24 Jul 2018
I looked into this on a small EC2 instance and it seems we need to address another issue first.
System: 15GB memory, 1 core (2 hyperthreads), Ubuntu, Ray version is today's master, commit d35ce7f.
I've run the script at the top of this thread, with the added two lines to turn on GCS flushing. The tldr: at ~505k steps, the Python process itself has steadily increasing memory that gets up to 12.5GB; plasma_store goes up to 2.1GB; and Redis is at 1.5GB. So GCS (redis) flushing seems to be working.
However, the tasks make no further progress when this memory pressure point is reached:
steps=505000 / buffer=200000.
main_pid=6230    mem=9813.7 MB.
------------------------------
/home/ubuntu/ray/src/ray/raylet/task_dependency_manager.cc:242: Task lease to renew has already expired by -1413ms
/home/ubuntu/ray/src/ray/raylet/task_dependency_manager.cc:242: Task lease to renew has already expired by -7030ms
/home/ubuntu/ray/src/ray/raylet/task_dependency_manager.cc:242: Task lease to renew has already expired by -4416ms
/home/ubuntu/ray/src/ray/raylet/task_dependency_manager.cc:242: Task lease to renew has already expired by -1882ms
/home/ubuntu/ray/src/ray/raylet/task_dependency_manager.cc:242: Task lease to renew has already expired by -2259ms
/home/ubuntu/ray/src/ray/raylet/task_dependency_manager.cc:242: Task lease to renew has already expired by -1220ms
/home/ubuntu/ray/src/ray/raylet/task_dependency_manager.cc:242: Task lease to renew has already expired by -4635ms
/home/ubuntu/ray/src/ray/raylet/task_dependency_manager.cc:242: Task lease to renew has already expired by -4637ms
/home/ubuntu/ray/src/ray/raylet/task_dependency_manager.cc:242: Task lease to renew has already expired by -1314ms
This keeps on going. Until a couple minutes after, everything gets killed:
...
/home/ubuntu/ray/src/ray/raylet/task_dependency_manager.cc:242: Task lease to renew has already expired by -7528ms
/home/ubuntu/ray/src/ray/object_manager/object_store_notification_manager.cc:50: End of file
/home/ubuntu/ray/python/ray/core/src/ray/raylet/raylet[0x466642]
/home/ubuntu/ray/python/ray/core/src/ray/raylet/raylet(_ZN3ray30ObjectStoreNotificationManager24ProcessStoreNotificationERKN5boost6system10error_codeE+0x567)[0x5031a7]
/home/ubuntu/ray/python/ray/core/src/ray/raylet/raylet(_ZN5boost4asio6detail23reactive_socket_recv_opINS0_17mutable_buffers_1ENS1_7read_opINS0_19basic_stream_socketINS0_5local15stream_protocolENS0_21stream_socket_serviceIS7_EEEES3_NS1_14transfer_all_tENS_3_bi6bind_tIvNS_4_mfi3mf1IvN3ray30ObjectStoreNotificationManagerERKNS_6system10error_codeEEENSC_5list2INSC_5valueIPSH_EEPFNS_3argILi1EEEvEEEEEEEE11do_completeEPNS1_15task_io_serviceEPNS1_25task_io_service_operationESL_m+0x44a)[0x5040ea]
/home/ubuntu/ray/python/ray/core/src/ray/raylet/raylet(_ZN5boost4asio6detail15task_io_service3runERNS_6system10error_codeE+0x3d0)[0x46f120]
/home/ubuntu/ray/python/ray/core/src/ray/raylet/raylet(main+0xc2c)[0x46755c]
/lib/x86_64-linux-gnu/libc.so.6(__libc_start_main+0xf0)[0x7f4ca84b0830]
/home/ubuntu/ray/python/ray/core/src/ray/raylet/raylet(_start+0x29)[0x46b809]
Traceback (most recent call last):
  File "repro.py", line 74, in <module>
    main()
  File "repro.py", line 56, in main
    states = ray.get([sample.remote(step_cnt) for i in range(actor_no)])
  File "/home/ubuntu/ray/python/ray/worker.py", line 2482, in get
    values = worker.get_object(object_ids)
  File "/home/ubuntu/ray/python/ray/worker.py", line 540, in get_object
    int(0.01 * len(unready_ids))
  File "/home/ubuntu/ray/python/ray/worker.py", line 423, in retrieve_and_deserialize
    self.get_serialization_context(self.task_driver_id))
  File "/home/ubuntu/ray/python/ray/utils.py", line 324, in _wrapper
    return orig_attr(*args, **kwargs)
  File "pyarrow/_plasma.pyx", line 430, in pyarrow._plasma.PlasmaClient.get
  File "pyarrow/_plasma.pyx", line 332, in pyarrow._plasma.PlasmaClient.get_buffers
  File "pyarrow/_plasma.pyx", line 256, in pyarrow._plasma.PlasmaClient._get_object_buffers
  File "pyarrow/error.pxi", line 83, in pyarrow.lib.check_status
pyarrow.lib.ArrowIOError: Connection reset by peer
This is launched with RAY_USE_NEW_GCS=on RAY_USE_XRAY=1 and compiled with RAY_USE_NEW_GCS=on.
concretevitamin
on 7 Aug 2018
@floringogianu I went ahead to test the same setup and script on a large-memory instance, which proceeds to complete fine without the above errors. The tldr is, instead of policy = ray.experimental.SimpleGcsFlushPolicy(), do policy = ray.experimental.SimpleGcsFlushPolicy(flush_period_secs=0.1). The difference is the former uses a default value of flushing redis for some amount of data every 10 seconds, which is too slow for your application. Details in this section.
With this change, @ 4M steps I see ~4.8GB of memory usage from redis-server. With the original flush period of 10s, @ 4M steps its memory usage is ~7.8GB.
Here's how I arrived at this parameter value. I eyeballed that on my system, the script executes about 5K steps/sec, corresponding to 50K Ray tasks/sec (the remote() calls). A reasonable rule of thumb is to multiply this with 2 or 3 to get the _desired flush rate_. Let's say I want ~100K entries/sec to be my flush rate, then setting flush_period_secs=0.1 does the trick -- I won't bother you with more details since it's in that page, but you can have other parameters to play with too!
This is my strawman attempt at solving this. You might want to do a combination of flush_period_secs and flush_num_entries_each_time to achieve an even lower memory threshold for redis. Please let us know if that works.
concretevitamin
on 7 Aug 2018
@concretevitamin Thanks for looking into this! Here's what I got:
I recompiled from master with the experimental flag and ran the script again, with the
flush_period_secs=0.1argument. I got the same ~4.8GB figure at the 4 million step on the single redis-server process spawned byray, same as you got.I then ran again the experiment with the binary release and no experimental features and I noticed that
raynow spawns two redis processes one using ~4GB and the other 3.4GB at the 4 million step. These really are differentredis-serverprocs, the ports are different, I'm not talking about the threads spawned byredis-server. Furthermore I recall seeing four such processes on the 128GB machine two weeks ago.
So, for me at least, the experimental features seem to force only one redis process which indeed uses less memory than the two combined. However it didn't appear to me that the memory usage stabilizes at a given point. I will confirm this on the larger machine (I was running out of memory on the 16GB one and I had to stop it at around 4 million steps.).
Furthermore I am close to finishing an implementation resembling Ape-X and I'll report on a real-life situation.
floringogianu
on 7 Aug 2018
@floringogianu Regardless of whether you use the experimental compilation, Ray by default _always_ launches 2 redis-server processes with different ports. I suspect in top/htop, the one using less memory was put in bottom of the screen so it takes some efforts to see. You can figure these ports out by looking at ray.init()'s output in a Python shell.
Try both flush_period_secs=0.1 and flush_num_entries_each_time=50000 or something like that to see if it's stabilized enough.
concretevitamin
on 7 Aug 2018
Observing the same problem with my application in ray 0.6.1! My parameter-server crashes very quickly due to this issue if I convert the PyTorch Tensors that hold gradients to numpy (which I do because, as I understand, shared memory only works with numpy.) Funnily (more or less), the behaviour is very inconsistent. In some runs, this accumulation increases linearly till death. In some it caps at some level (e.g. 35gb) on the parameter servers but continues on the learner workers until they die cause of the same problem.
 EricSteinberger
on 2 Jan 2019
EricSteinberger
on 2 Jan 2019
@TinkeringCode, some questions:
- Does anything change if you do
ray.init(redis_max_memory=10**10)to cap the memory usage of the Redis server at 10GB. - Did you see which process was using all the memory (e.g., in top)?
robertnishihara
on 3 Jan 2019
Hi @robertnishihara
Thank you for your answer!
With ray.init(redis_max_memory=10**10) an over-night run did not crash! I should add that, before, I set object_store_memory=int(ray.utils.get_system_memory() * 0.85) and increased added the line tmpfs /dev/shm tmpfs size=90% 0 0 to the file /etc/fstab to make maximal use of the available memory on my cluster. For this test tonight I moved back to object_store_memory=int(ray.utils.get_system_memory() * 0.4).
I would appreciate if you could explain to me how these two settings interact, so that I can make an educated decision on how to set them.
I, unfortunately, quit the job before looking at top (stupid me). A quick re-run shows (after 20 minutes) that the memory is split between python processes, which look like they are my "learners" as they have constant ~100% CPU load and cause the memory load makes sense due to memory buffers. As it should be, the other processes/workers do not need much memory. This is all with ray.init(redis_max_memory=10**10). Do you need me to rerun it without this setting?
EricSteinberger
on 4 Jan 2019
Great to hear that! The redis_max_memory and object_store_memory settings don't really interact.
When you call ray.init(), several processes are started.
- Scheduler (one per machine) assigns tasks to workers.
- Object store (one per machine) stores outputs of tasks, so when a remote function returns, it serializes its return value and puts it in the object store, when you call ray.get(), the value is retrieved from the object store.
- Redis server (2 or more on the first machine (2 by default) and none on any other machines). This essentially stores metadata like specifications of the tasks (which are used to rerun the tasks later if necessary (e.g., in the event of a machine failure)), which objects live on which machines, and things like that.
- Monitor (one on the first machine, none on any others), this essentially detects machine failures
The object store will fill up with objects (until some limit, and then it will evict the least recently used objects). This limit is what you're setting with object_store_memory.
The Redis servers will also fill up with metadata (until some limit, and then they will evict the least recently used values). That's what you're setting with redis_max_memory.
In the current master, object_store_memory is capped at 20GB by default and redis_max_memory is capped at 10GB by default, though these defaults can be overridden. Note that the 10GB cap on redis_max_memory was merged yesterday and isn't in 0.6.1.
I'm closing this issue because I think the underlying issue has been addressed by #3615. However, if you run into more problems feel free to file a new issue (or reopen this one if it's the same issue).
robertnishihara
on 5 Jan 2019
Thank you for your elaboration @robertnishihara ! Yes, I think we can close this as the issue seems to be solved by limitting redis_max_memory.
EricSteinberger
on 5 Jan 2019
Related issues
 WangYiPengPeter
·
3Comments
WangYiPengPeter
·
3Comments
 Khalilsqu
·
3Comments
Khalilsqu
·
3Comments
 zplizzi
·
3Comments
zplizzi
·
3Comments
 monocongo
·
3Comments
robertnishihara
·
3Comments
monocongo
·
3Comments
robertnishihara
·
3Comments
Most helpful comment
Great to hear that! The
redis_max_memoryandobject_store_memorysettings don't really interact.When you call
ray.init(), several processes are started.The object store will fill up with objects (until some limit, and then it will evict the least recently used objects). This limit is what you're setting with
object_store_memory.The Redis servers will also fill up with metadata (until some limit, and then they will evict the least recently used values). That's what you're setting with
redis_max_memory.In the current master,
object_store_memoryis capped at 20GB by default andredis_max_memoryis capped at 10GB by default, though these defaults can be overridden. Note that the 10GB cap onredis_max_memorywas merged yesterday and isn't in0.6.1.I'm closing this issue because I think the underlying issue has been addressed by #3615. However, if you run into more problems feel free to file a new issue (or reopen this one if it's the same issue).