Describe the bug
radarr (in a container) is using a really high amount of cpu at the moment.
I already turned off RSS sync, that helped for a few minutes, then it started again.
I have the slight theory that this is caused by my FUSE storage (which radarr is scanning) using sync_read. Maybe that or another FUSE argument.
To Reproduce
Im not sure if my exact setup is going to be reproduceable...
Steps to reproduce the behavior:
- Create a docker container with radarr on a ssd
- have a bit big movie collection (4.5k are in my library, monitored)
- start the radarr container...
- Wait till it does something on 200 - 400% CPU
Expected behavior
Radarr should as the other forks (sonarr, lidarr) be somewhat on 10 - 30% CPU usage, not 200.
Screenshots
this cpu spike happened as soon as i opened the webui:
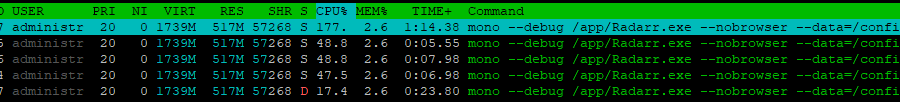
this cpu spike seems to be because of scanning:
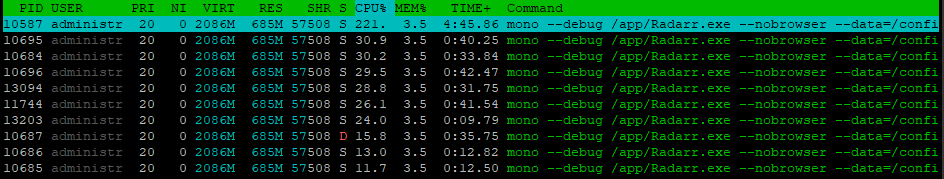
i do not know why this happened:

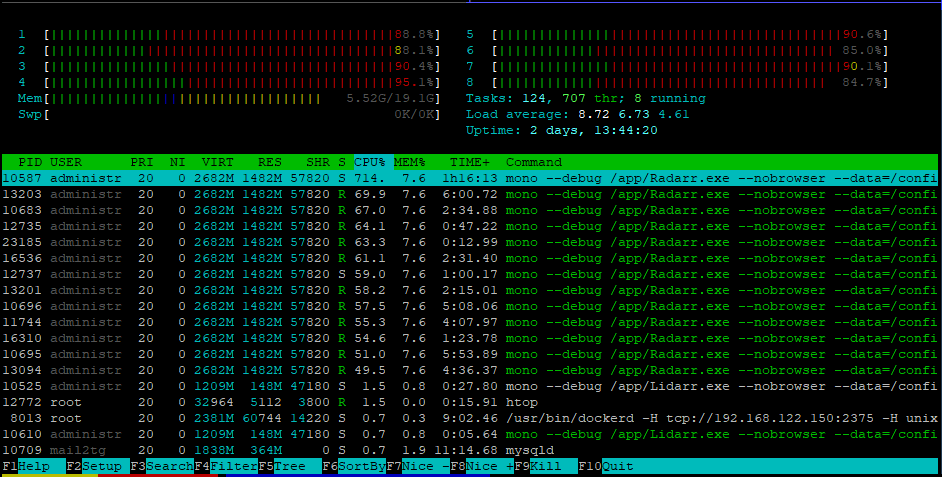
wow (im still doing nothing, the webui is open, rss sync is disabled):

no comment on that spike:
Desktop (please complete the following information):
- OS: Ubuntu Linux (Docker)
- Mono Version: Mono 5.16.0.220
- Browser and Version: Firefox 64
- Version: 0.2.0.1285
Debug Logs
https://linx.li/myiikkin.file my debug log
 RaymondSchnyder
All 28 comments
When did those last two spikes occur? Was Radarr scanning anything on your disk? Also you should not disable RSS sync, it is needed for Radarr to download anything automatically.
 galli-leo
on 30 Dec 2018
galli-leo
on 30 Dec 2018
When did those last two spikes occur? Was Radarr scanning anything on your disk? Also you should not disable RSS sync, it is needed for Radarr to download anything automatically.
The last those spikes occured while scanning something i think, it should be in the debug log... Oh i see the htop screen doesnt shows the time when the spikes occur....
Okay so all spikes occured while scanning the directory tree. Nothing else.
Also i disabled rss sync in the hope to find the feature which is hogging my cpu. I know that i shouldnt disable it, but i wanted to know what causes it
RaymondSchnyder
on 31 Dec 2018
@RaymondSchnyder What kind of FUSE storage are you using? It's very likely related to that. Have you tried turning of analyze media files?
galli-leo
on 31 Dec 2018
@RaymondSchnyder What kind of FUSE storage are you using? It's very likely related to that. Have you tried turning of analyze media files?
The weird aspect is, radarr wasnt consuming that much of cpu power till like a week or two weeks ago.
Im using GDrive mounted Rclone VFS.
I could do that, but im very sure its probably not related to that, as i had this option before and it worked fine...
Here are my rclone-vfs settings (Im pretty sure they are not related to the spikes, but i post them anyway):
ExecStart=/usr/bin/rclone mount gd-crypt: ${MOUNTDIR} \
--allow-other \
--attr-timeout=1s \
--bind 192.168.122.150 \
--buffer-size=0 \
--cache-chunk-clean-interval=300s \
--cache-chunk-path=${CACHEDIR}/ssd/ \
--cache-chunk-size=128M \
--cache-chunk-total-size=35G \
--cache-db-path=/dev/shm/rclone/ \
--cache-db-purge \
--cache-dir=${CACHEDIR}/cache-dir \
--cache-info-age=36h \
--cache-workers=4 \
--dir-cache-time=24h \
--drive-chunk-size=32M \
--fast-list \
--log-file ${LOGDIR}/rclone-mount.log \
--log-level INFO \
--stats-log-level=NOTICE \
--stats=1m \
--umask 002 \
--vfs-cache-max-age=3h \
--vfs-cache-mode=writes \
--vfs-cache-poll-interval=1m \
--vfs-read-chunk-size-limit=off \
--vfs-read-chunk-size=256M \
--read-only \
--rc
Here are my (union FS) Mount settings, which combines rclone-vfs and my local HDD:
Type = fuse.unionfs-fuse
Options = cow,allow_other,nonempty,hard_remove,direct_io,sync_read,auto_cache,statfs_omit_ro,splice_read,splice_move,atomic_o_trunc,big_writes,default_permissions,uid=1000,gid=1001
now the problem is, in my opinion, the option "sync_read" or "direct_io"
my old unionfs settings would be this:
unionfs-fuse -o cow,allow_other,large_read,statfs_omit_ro,atomic_o_trunc,auto_cache,big_writes,default_permissions,splice_move,splice_read,nonempty -o uid=1000 -o gid=1000 /mnt/local=RW:/mnt/media=RO /mnt/data
As you can see, the difference is, that the new settings dont have the argument large_read, as it doesnt works anymore.
Also, i added the parameters hard_remove , direct_io and sync_read .
Im pretty sure one of them responsible for this.
so my "candidates" are now:
large_readdirect_iosync_read
One of them is likely to be causing this mess.
So im trying now to remove direct_io first and then sync_read, to test this.
RaymondSchnyder
on 31 Dec 2018
What i notice is, the CPU spikes dont happen UNTIL i open the webinterface.
Strange.
RaymondSchnyder
on 31 Dec 2018
I've noticed similar 100% CPU usage when idling, not sure if it's related or not, but restarting the process seems to fix until I access the panel again.
 Cajs
on 23 Jan 2019
Cajs
on 23 Jan 2019
Not sure if this is the same issue, but when I encountered a similar bug it turned out to be an environmental variable I had set a long time ago and forgotten about. Apparently newer versions of mono took exception to it.
https://github.com/linuxserver/docker-radarr/issues/39
Worth a shot if you've got it set for yourself.
 pl77
on 18 Mar 2019
pl77
on 18 Mar 2019
I'm also experiencing this.
 nickcorona
on 9 Apr 2019
nickcorona
on 9 Apr 2019
Do you have the "MONO_TLS_PROVIDER: legacy" environmental variable set?
pl77
on 9 Apr 2019
I am also experiencing this in a docker container, but I only have around 20 titles in radarr. It constantly runs over 140%.
 wilcurt
on 5 May 2019
wilcurt
on 5 May 2019
Radarr was getting up to 300% constantly. I stopped the Radarr container, but then Lidarr started eating my CPUs, also hitting over 300%. I found a fix, though. I guess mono doesn't handle zero-length (0kb) files very well. Delete those from the folders that your Sonarr/Radarr/Lidarr apps are scanning. I deleted the two zero-byte files in my media directory and then restarted the arr apps. It has been a few days and mono is still behaving.
wilcurt
on 15 May 2019
This issue has been automatically marked as stale because it has not had recent activity. Please verify that this is still an issue with the latest version of Radarr and report back. Otherwise this issue will be closed.
![stale[bot] picture](https://avatars3.githubusercontent.com/in/1724?v=4&s=40) stale[bot]
on 14 Jul 2019
stale[bot]
on 14 Jul 2019
Might have narrowed down the problem. Problem occurs when Radarr is restarted using the WebUI restart button. Killing the Radarr container returns CPU usage to normal, problem recurs if Radarr is restarted using the WebUI button.
Sonarr doesn't appear to exhibit the same problem.
Details as follows.
System Info
Version
0.2.0.1358
Mono Version
5.20.1.19 (tarball Thu Apr 11 09:02:17 UTC 2019)
Problem doesn't appear on a fresh start of Radarr. CPU usage is minimal.
stracing an "idle" Radarr process for about 10-15 seconds gives the following results:
strace -fp [Radarr pid] -c
% time     seconds  usecs/call     calls    errors syscall
------ ----------- ----------- --------- --------- ----------------
 98.73    0.051025        1187        43        18 futex
  1.05    0.000545          91         6         6 rt_sigsuspend
  0.16    0.000084          84         1         1 restart_syscall
  0.03    0.000014           1        12        12 rt_sigreturn
  0.02    0.000011           1        12           rt_sigprocmask
------ ----------- ----------- --------- --------- ----------------
100.00    0.051679                    74        37 total
If Radarr is restarted through the WebUI, specifically using the Restart button under the System section, Radarr uses ~140% CPU on an 8 vcore VPS.
stracing an "idle" Radarr process for about 10-15 seconds now gives the following results.
strace -fp [Radarr pid] -c
% time     seconds  usecs/call     calls    errors syscall
------ ----------- ----------- --------- --------- ----------------
 93.82    9.525948          17    561246    171289 futex
  2.32    0.235210          72      3245      3245 rt_sigsuspend
  1.38    0.140382          22      6490           tgkill
  0.91    0.092240          14      6490           getpid
  0.78    0.079627          12      6490           rt_sigprocmask
  0.78    0.079601          12      6490      6475 rt_sigreturn
------ ----------- ----------- --------- --------- ----------------
100.00   10.153008                590451    181009 total
output of top -H -p [Radarr pid] (note PID 7000)
 PID USER      PR  NI    VIRT    RES    SHR S %CPU %MEM     TIME+ COMMAND
 6975 media     20   0 2636092 213576  11892 R 72.8  0.7   1871:53 mono
 7000 media     20   0 2636092 213576  11892 S 70.1  0.7   1792:24 Thread Pool Wor
 6983 media     20   0 2636092 213576  11892 S  0.0  0.7   0:00.14 SGen worker
 6987 media     20   0 2636092 213576  11892 S  0.0  0.7   0:00.19 Finalizer
 7001 media     20   0 2636092 213576  11892 S  0.0  0.7   0:00.16 Timer-Scheduler
 7005 media     20   0 2636092 213576  11892 S  0.0  0.7   0:03.33 mono
 7012 media     20   0 2636092 213576  11892 S  0.0  0.7   0:00.07 Thread Pool Wor
 7824 media     20   0 2636092 213576  11892 S  0.0  0.7   0:00.00 Thread Pool I/O
output of top -H from within container
  PID USER      PR  NI    VIRT    RES    SHR S %CPU %MEM     TIME+ COMMAND
  226 abc       20   0 2636092 213576  11892 R 69.7  0.7   1880:22 mono
  247 abc       20   0 2636092 213576  11892 R 68.0  0.7   1800:32 Thread Pool Wor
 shasderias
on 14 Jul 2019
shasderias
on 14 Jul 2019
@wilcurt thanks for that recommendation, i will try that out, but i shouldnt even have zero length files...
RaymondSchnyder
on 18 Jul 2019
I just encountered the exact same issue as @shasderias. I had made some updates to my Radarr and Sonarr instances and restarted via the WebUI. As soon as I did, CPU usage for all 3 (2x Radarr + 1x Sonarr) zoomed to utilizing ~150% CPU each.
As soon as I rebooted the Docker containers, all was back to normal.
Happy to dump whatever might be helpful to recreate this scenario.
 ryanrhughes
on 20 Jul 2019
ryanrhughes
on 20 Jul 2019
Would it be too hacky to just let it kill itself, rather than restart? So for example, suppose we have some kind of (please help me come up with a better name than this) IS_RUNNING_IN_A_CONTAINER environment variable. If enabled, when a restart is initiated by the UI, Radarr could just shut down, ending the process, and stopping the container. The idea is that if you're running this in a container, you'd let the container restart policy be in charge of restarting the thing.
It's duck tape, but it would work. If you guys are cool with this and come up with a better name for the environment variable, I don't mind implementing it for both Sonarr and Radarr. Should be a super quick one.
 gerryhernandez
on 13 Sep 2019
gerryhernandez
on 13 Sep 2019
Could just use the Shutdown button instead of Restart? The container will die and then you can use any restart mechanism you want. I use a systemd .service file and mine is set to Restart=always.
 fryfrog
on 18 Sep 2019
fryfrog
on 18 Sep 2019
I just discovered the same issue on mine after doing a restart. It probably would have gone unnoticed for a long time if I wasn't just installing and testing cockpit on my host (awesome tool by the way).
I tried using the shutdown button, but it doesn't actually stop the docker container (so it doesn't restart)... in fact, it actually doubled the cpu usage when I did that. Restarting the containers (via cockpit... so nice) resolved the issue.
I am using the linuxserver.io images for both radarr and sonarr and saw it occur on both.
 jhfry
on 29 Sep 2019
jhfry
on 29 Sep 2019
This issue has been automatically marked as stale because it has not had recent activity. Please verify that this is still an issue with the latest version of Radarr and report back. Otherwise this issue will be closed.
stale[bot]
on 28 Nov 2019
Might have narrowed down the problem. Problem occurs when Radarr is restarted using the WebUI restart button. Killing the Radarr container returns CPU usage to normal, problem recurs if Radarr is restarted using the WebUI button.
Sonarr doesn't appear to exhibit the same problem.
THANK YOU! What an obscure little thing to track down. I cant believe how stable my CPU's are now that I restarted the Radarr container. WOW! I'd absolutely consider this a bug.
 LexJackson
on 16 Dec 2019
LexJackson
on 16 Dec 2019
I just encountered the same behaviour on my radarr container! Odd thing uh? Just letting you know this is still happening.
 rafaelreis-r
on 5 May 2020
rafaelreis-r
on 5 May 2020
@rafaelreis-r are you using Heimdall? Just discovered that abuses the Radarr/Sonarr/Lidarr API if you enable the 'enhanced' integration
 ta264
on 5 May 2020
ta264
on 5 May 2020
No, it pounds a slow API every second. On a larger instance it will cause a DoS attack
ta264
on 5 May 2020
@rafaelreis-r are you using Heimdall? Just discovered that abuses the Radarr/Sonarr/Lidarr API if you enable the 'enhanced' integration
Stopping / Starting the container, instead of restarting via WebGUI, fixed the high CPU usage, as others reported previously. I can replicate the issue by clicking the restart button in the WebGUI.
I do not use Heimdall. My setup is: Organizr / Ombi / Radarr / Qbittorrent
CPU usage is normal after the container reboot.
rafaelreis-r
on 5 May 2020
Still happening in version 0.2.0.1504 - Jul 3 2020
 J-o-h-n-M
on 4 Jul 2020
J-o-h-n-M
on 4 Jul 2020
Try v3... v0.2 not going to be seeing many if any more updates
 Qstick
on 4 Jul 2020
Qstick
on 4 Jul 2020
@Qstick thanks. I tried searching how to use V3, but cant find any info on it. Did find https://github.com/Radarr/Radarr/blob/aphrodite/DEVELOPMENT.md but that did not lead to any info. I am using the linuxserver/radarr docker. Would I need to use the 3.0.0.3123-ls13 image of that? Or is there no relation between this 3 nd V3 of Radarr UI?
J-o-h-n-M
on 5 Jul 2020
linuxserver/Radarr:preview
Or see the discord Aphrodite channel if you need more assistance
ta264
on 5 Jul 2020
Related issues
 HitsvilleUK
·
3Comments
HitsvilleUK
·
3Comments
 feerlessleadr
·
3Comments
feerlessleadr
·
3Comments
 christronyxyocum
·
3Comments
christronyxyocum
·
3Comments
 plexecutor
·
3Comments
plexecutor
·
3Comments
 chrisallen
·
3Comments
chrisallen
·
3Comments
Most helpful comment
Might have narrowed down the problem. Problem occurs when Radarr is restarted using the WebUI restart button. Killing the Radarr container returns CPU usage to normal, problem recurs if Radarr is restarted using the WebUI button.
Sonarr doesn't appear to exhibit the same problem.
Details as follows.
System Info
Version
0.2.0.1358
Mono Version
5.20.1.19 (tarball Thu Apr 11 09:02:17 UTC 2019)
Problem doesn't appear on a fresh start of Radarr. CPU usage is minimal.
stracing an "idle" Radarr process for about 10-15 seconds gives the following results:
If Radarr is restarted through the WebUI, specifically using the Restart button under the System section, Radarr uses ~140% CPU on an 8 vcore VPS.
stracing an "idle" Radarr process for about 10-15 seconds now gives the following results.
output of top -H -p [Radarr pid] (note PID 7000)
output of top -H from within container