Description:
Radarr appears to have a memory leak. I have started getting warnings in the past few weeks about used SWAP space, and I had narrowed it down to being one of my Docker containers. Whenever I restarted all my containers, the usage dropped substantially. Today I went through and found that Radarr was using over half that space (2GB). I removed and rebuilt the container, and that dropped to 0.
Radarr Version:
I am running Radarr through the LSIO Docker container.
Version
0.2.0.696
Mono Version
5.0.1.1 (2017-02/5077205 Thu May 25 09:19:18 UTC 2017)
Let me know any information I can provide to help diagnose this issue.
 kmlucy
All 220 comments
Same problem here, not running on docker.
Radarr starts to take up more than 3-4GB of memory 🗡
BareMetal Server
Version
0.2.0.696
Mono Version
Mono JIT compiler version 5.0.1.1
 kvanbiesen
on 4 Jun 2017
kvanbiesen
on 4 Jun 2017
Do you guys currently have errored items in your queue?
 galli-leo
on 5 Jun 2017
galli-leo
on 5 Jun 2017
No errored items, no.
kmlucy
on 5 Jun 2017
Could it involve the process of updating the media library? At least with import, I basically have to restart between importing each disk.
 ZimbiX
on 5 Jun 2017
ZimbiX
on 5 Jun 2017
@ZimbiX Yes that would have been the next question. Since we have to load all movies into memory, that can be really memory intensive for large libraries.
galli-leo
on 5 Jun 2017
No "error" movies in the list. Libraris is only 100 Movies big (10 missing or so, rest is unmonitored)
It only starts to grow after a couple off days. If i restart the Radarr, all is fine. Everything works. Library updates are fine. But after a couple of days, the radarr process is over 4GB and the system starts pagina, (and bogs down)
Radarr doesnt crash either (system has 8GB RAM) and nothing special in the log files.
kvanbiesen
on 5 Jun 2017
My library is a bit bigger (~1000 movies, about 25 missing), but I have the same symptoms. It's fine after restarting, but a few days later, it is consuming multiple gigabytes. I have not been adding new movies from the disk during this time.
kmlucy
on 5 Jun 2017
Can you monitor this and tell me wether the memory usage goes up after / during an update library?
galli-leo
on 5 Jun 2017
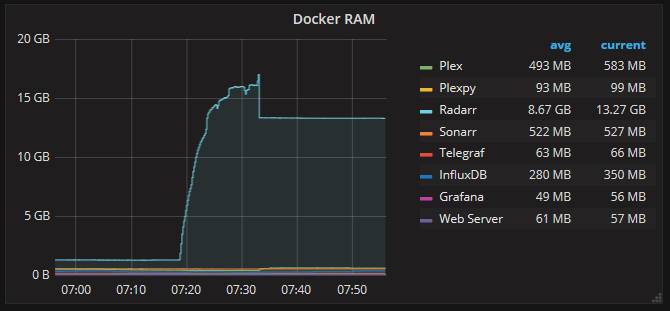
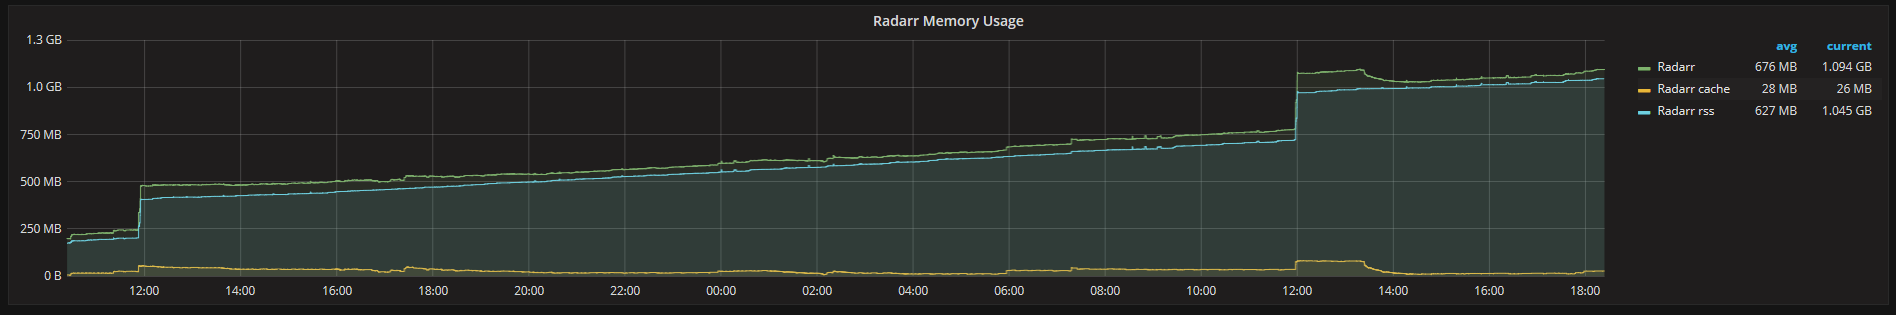
Here is my memory usage when I triggered a library update. Where it starts rising is where I triggered it, and right around the right side of the graph is where it finished.

kmlucy
on 5 Jun 2017
Cpu goes to like 50-100% (normal) and ram goes to 12 % now when i manually did the library update. After the library update, the cpu goes back to 'idle'. The ram drops but not by much. stays at 11.8 (radar is running for 5 hours or so now)
Ps sonarr is running on the same machine for like 14 days and doesnt change much in ram usage.
kvanbiesen
on 5 Jun 2017
@kmlucy @kvanbiesen Seems like the library update could be the cause then?
galli-leo
on 5 Jun 2017
It looks that way. It seems like the library updates uses a lot of ram, but that ram is never freed, and eventually the system starts swapping it.
kmlucy
on 5 Jun 2017
Hi,
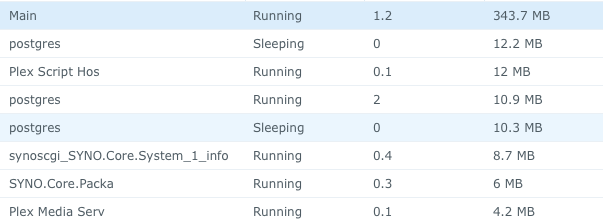
I don't know if this is the same problem but the result is the same : hight RAM usage. Since a few weeks or so, my Synology started to be always at 90% of RAM and was previously at 30% or less. When I stop Radarr the problem disappear. It seems to be the process "Main". Any idea ?
 mattnsr
on 26 Jul 2017
mattnsr
on 26 Jul 2017
Same problem here fellas, i was having ram panics on my docker vm after a few weeks running, I am running this under docker with 275 movies,
So i found the radarr app using 1-2GB's of ram which is unussual compared to sonarr that was using 256mb, so i decided a few days ago to set a 512mb ram limit on the container and see how that goes, now its decided to offload into the swap space, which is only 1GB.
Swap space usage.
  PID User     Command                         Swap      USS      PSS      RSS
 6441 ben      /bin/sh -c LD_LIBRARY_PATH=       92        4        4        8
 6558 ben      /usr/lib/plexmediaserver/Pl     1076     1408     1935     3360
13561 ben      /lib/systemd/systemd --user        0     1444     2841     6536
13569 ben      -bash                              0     3172     3462     5024
 6576 ben      Plex Plug-in [com.plexapp.p    23824    12156    12451    13164
16156 ben      /usr/bin/python /usr/bin/sm        0    12764    13135    14776
 6578 ben      Plex Plug-in [com.plexapp.p     2408    58484    59869    62588
 6444 ben      /usr/lib/plexmediaserver/Pl     6452    71524    72327    74244
 6415 ben      python /opt/plexpy/PlexPy.p     3720    77676    77676    77680
 5278 ben      mono /app/Jackett/JackettCo   119832    86600    90978    95752
 6465 ben      Plex Plug-in [com.plexapp.s     6272   162868   164329   167148
 5899 ben      /usr/bin/python -OO /usr/bi    36156   181900   182630   183756
12078 ben      mono --debug NzbDrone.exe -    65900   389408   389798   390192
 5747 ben      mono --debug Radarr.exe -no   475240   484056   488782   493904
 6040 ben      /usr/bin/mono-sgen --optimi    27400   681524   681524   681528
 externalz
on 6 Aug 2017
externalz
on 6 Aug 2017
I didn't take any metrics/screenshots or anything else but also came across this.
I started the docker container and after importing the movies (15 at a time, I went easy on it 😄 ) and setting everything up (indexer, downloader, etc.) it began to freeze both container and host. I'm using a Mac with Mac OS with 4GB of RAM (not much, but enough so far).
My lib has 45 movies, it isn't that big so I don't know if that could be the issue.
Let me know if I can help somehow.
 mribeiro
on 9 Aug 2017
mribeiro
on 9 Aug 2017
I can report memory problems too. Radarr uses 4x the memory that my Sonarr instance does.
Restarted the container and memory usage dropped 10x.
Guess the solution for now is to schedule a restart every day or so.
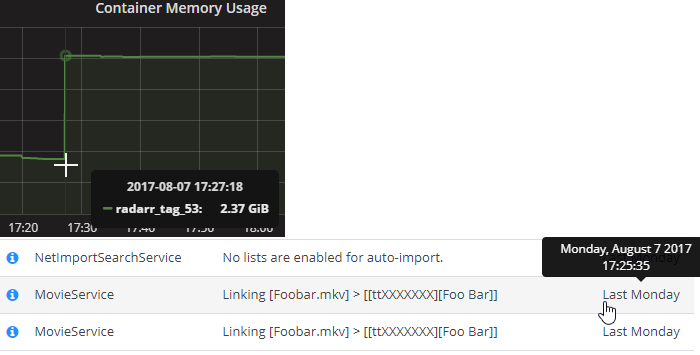
Ok I checked my logging and I found that the ram tripled after a download, when it did something called "Linking".
The log was "Movie service - Linking [<movie name>]"
Before this log, ~800 megs of ram, after 2,37GB ram.
 bassebaba
on 10 Aug 2017
bassebaba
on 10 Aug 2017
@bassebaba I created a docker container with max of 500MB of RAM and 30% of CPU. Seems to be going well so far. Maybe you want to do something similar instead of restarting the container.
Also, @bassebaba , there's an option to not use hard linking. Have you tried disabling it and see if it helps? Just throwing it wild ideas.
mribeiro
on 10 Aug 2017
Some of us doesn't use a container and have the same issue...
Matt'
On 10 Aug 2017, at 10:27, Antonio Ribeiro notifications@github.com wrote:
@bassebaba I created a docker container with max of 500MB of RAM and 30% of CPU. Seems to be going well so far. Maybe you want to do something similar instead of restarting the container.
—
You are receiving this because you commented.
Reply to this email directly, view it on GitHub, or mute the thread.
mattnsr
on 10 Aug 2017
Ram-limit doesnt help, @externalz did that and instead got swapping.
We need to get the memory leak sorted.
I have acces to dotMemory so Ill run a trace as soon as I get a chance, but my memoryleak-fix skills suck.
bassebaba
on 10 Aug 2017
@here This was markus (from Sonarr team) on discord:
I'm thinking it's more likely mono, since I haven't seen that behaviour on windows and I'm running under mono 5.0.1 (linuxserver docker container) and haven't been seeing it recently
So it may not be our fault. @bassebaba Let me know if you find anything! Wanted to do the same, but haven't found the time to do it.
galli-leo
on 10 Aug 2017
This happened to me in the docker container, unless it is a problem running this container on MacOS, but shouldn't be an issue.
mribeiro
on 16 Aug 2017
I'm experiencing the same issue, without docker. on a fresh install of radarr with the following mono version.
Mono JIT compiler version 5.2.0.215 (tarball Mon Aug 14 15:46:23 UTC 2017)
Copyright (C) 2002-2014 Novell, Inc, Xamarin Inc and Contributors. www.mono-project.com
        TLS:           __thread
        SIGSEGV:       altstack
        Notifications: epoll
        Architecture:  amd64
        Disabled:      none
        Misc:          softdebug
        LLVM:          supported, not enabled.
        GC:            sgen (concurrent by default)
my sonarr runs on the same box without any memory leak issue's.
where radarr is eating around 2gb of ram on idle.
Radarr Ver. 0.2.0.778
 Celoxocis
on 22 Aug 2017
Celoxocis
on 22 Aug 2017
I haven't had the time to debug yet, but I am starting to see the same problem with Sonarr.
I'm using the dockerfiles from linuxserver.io
From around 450 megs to 2,2 GB, booom!
ping @galli-leo @markus101
bassebaba
on 22 Aug 2017
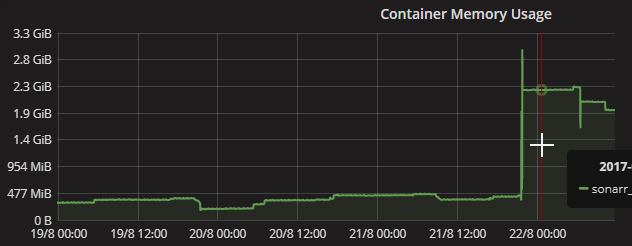
I know this thread has been inactive since a few months but I'm still experiencing the same issues.
I'm running binhex's Radarr docker on unRAID 6.3.5 and whenever the container is being restarted RAM usage is fairly normal (~750MB for a library of 480 downloaded & 150 monitored).
Whenever I'm starting a library scan though the RAM usage obviously rises but it seems like that RAM space is not being freed up again after the scan finishes. My server is up for about 6 days now and RAM usage climbed from 600mb up to 2.3GB in that time, performing five library scans.
Radarr version is 0.2.0.870
Mono version is 4.8.0 (Stable 4.8.0.495/e4a3cf3 Mon Feb 27 08:30:18 UTC 2017)
Maybe this helps.
EDIT:
Just for testing purposes I switched to linuxserver's docker image because they're using the newer
Mono version 5.4.0.201 (tarball Fri Oct 13 21:51:45 UTC 2017).
I'll keep an eye on RAM usage. Let's see if it changes anything.
 sebastianklein96
on 21 Oct 2017
sebastianklein96
on 21 Oct 2017
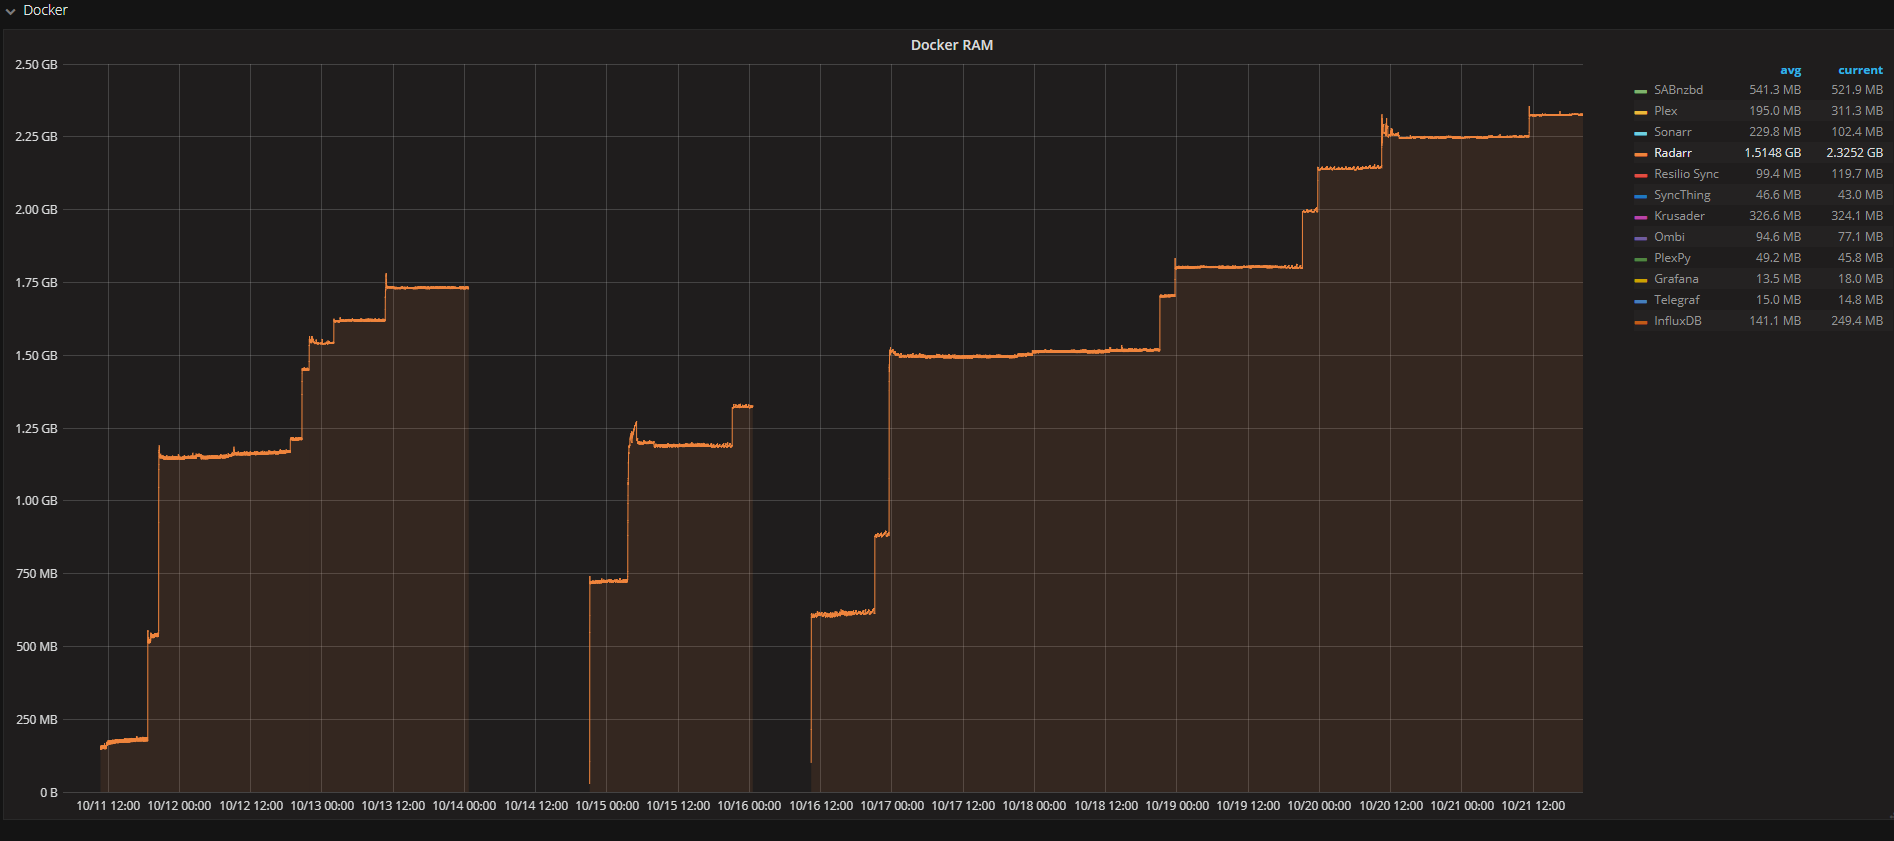
Once again updating this thread, I'm having similar issues.
This occurs during/after importing a movie (in my case Deadpool 4K). It appears it might be relative to how much memory the system as, as others have seen memory growth up to 4GB, I have a 64GB system and hover around ~2GB normally and spiked to 13GB after import.
As you can see memory spiked beyond 13GB during import, and after the import dropped down, however not completely. Might give Sonarr a test to see if Mono is the issue.
 Firelfy
on 28 Nov 2017
Firelfy
on 28 Nov 2017
@Firefly How many movies do you have?
galli-leo
on 28 Nov 2017
@galli-leo 401 listed in Radarr, however less than 300 downloaded. I should mention I use linuxserver.io docker container on unraid 6.3.5. I've noticed ram usage eventually went slightly down every 5 minutes, then dropped to normal usage in about half an hour:
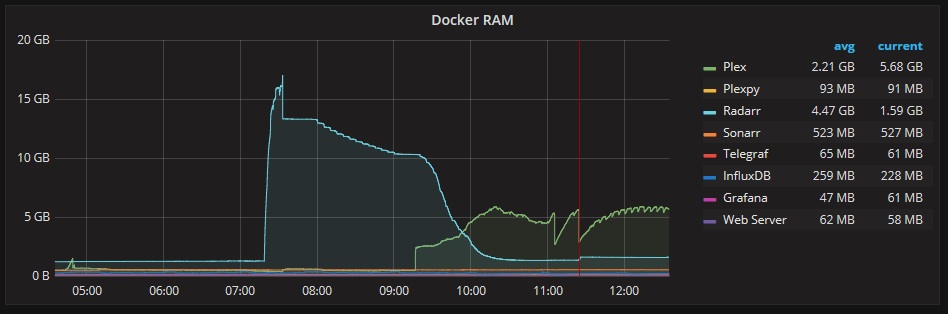
You can ignore the Plex usage going up, that's just Plex transcoding to ram.
I feel like after this amount of time unraid itself might be clearing ram, not sure though. If you need logs hit me up, I'll chuck em up when I get the time.
Firelfy
on 29 Nov 2017
Logs would certainly be good. Might be mono clearing up as well.
galli-leo
on 30 Nov 2017
Okay so here's the logs:
radarr.txt
The file is quite large, and I've noticed some other errors in there that I haven't been affected by/not noticed. For that reason here's where the memory issues occur:
17-11-29 07:18:08.0|Error|DownloadedMovieImportService|Import failed, path does not exist or is not accessible by Radarr: /downloads/Deadpool.2016.UHD.BluRay.2160p.TrueHD.Atmos.7.1.HEVC.REMUX-FraMeSToR
17-11-29 07:18:38.6|Info|RecycleBinProvider|Recycling Bin has not been configured, deleting permanently. /movies/Movies/Deadpool (2016)/Deadpool.2016.Remux-1080p.mkv
I've now noticed the same thing occuring in Sonarr. When replacing an entire Series in Sonarr I got similar memory spikes, that also gradually declined.
I'll put debugging on both Radarr and Sonarr and will start up an issue with them as well. I've noticed others are using docker containers above, some with linuxserver.io. could this be an issue with the container implementation?
One last thing, because my implementation involves importing the files via lftp from a remote location I get a lot of file not found errors until they appear, is there any way to reduce/stop this warning or should I not bother?
Thanks for the help!
Firelfy
on 30 Nov 2017
A few things I noticed in this thread:
First the graph @kmlucy posted back in June. The increase from ~1000 to 1236 resident set isn't really a problem unless it keeps happening on subsequent library scans. The rest is just 747 cache and is something the OS would free if the memory is needed.
That said, 1 GB resident memory is high on itself, my Sonarr instance is at 278 MB (which I already consider higher than I'd like)
But the graph is excellent (netdata ftw) because it appropriately shows swap, rss and cache separately.
@Firelfy Your graph missing something important: what kind of memory usage. If during a library scan Radarr opens up a lot of files then the OS will happily load/cache those files in memory.
I have a mongodb instance on my server that uses 139 GB of virtual memory... (the machine has 8 GB of physical ram). It just happens to have mapped the database into virtual memory space, but in reality it uses only 58 MB with another 111 MB swapped out. Once the database gets busy, the RAM usage shoots up since data from the disk is suddenly cached into memory, and that's fine.
I'm not saying this is the case, there might very well be a memory problem, but saying "App x uses too much memory" simply means very little without appropriate context.
The memory starts to drop significantly when plex gets busy, could either be that memory gets swapped out or caches get releases... a very important distinction and exactly the context I'm taking about.
@galli-leo If there is a managed memory problem in Radarr, then you need to use the mono log profiler to create a report which you can analyse (to see which managed objects remain in memory). But that doesn't cover unmanaged memory, of course.
@galli-leo @markus101 We should log some cpu/mem/io stats at Debug level every 5 min or so.
 Taloth
on 2 Dec 2017
Taloth
on 2 Dec 2017
Thanks for the info @Taloth , I've produced another graph and reimported a movie and produced this:
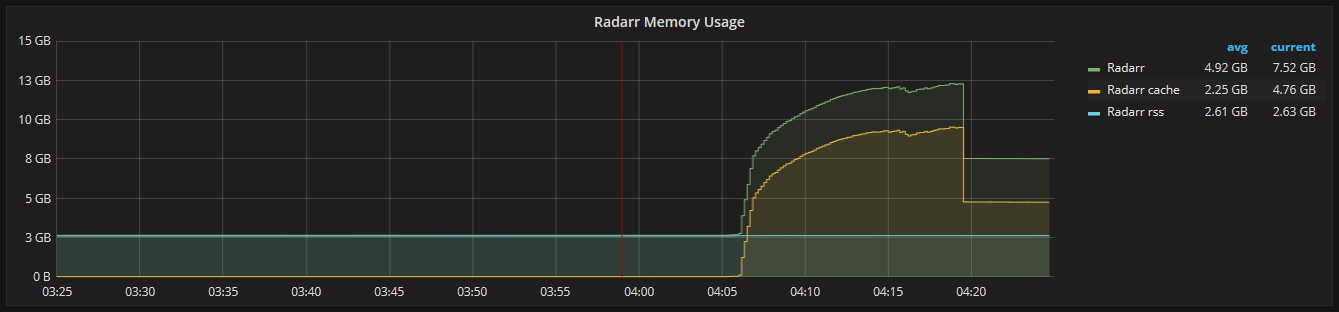
It appears that you are correct, and that the increase in usage is an increase is cache, is this something I should be worried about?
Looking for a suggestion here, when reporting my memory usage for my containers should I report rss usage or total (including cache/rss) usage in my statistics?
Thanks for the help.
Firelfy
on 2 Dec 2017
@Taloth Cool, I will try that, though we shouldn't have any unmanaged memory, right? (Sorry if it's a dumb question, not too familiar with C# memory management).
galli-leo
on 2 Dec 2017
@Firelfy the cache is what we like to see, but the rss is still high. Can you include swap in the graph and then see if it drops again like before when plex started doing it's thing?
The rss is pretty stable around 2.61 GB even during the scan, so it's not leaking memory, but that's very high.
I would recommend recording a graph that from startup of Radarr, preferably over 24h or so, before moving on to the log profiler to get detailed memory statistics.
The 24h graph with tell you if the memory usage 'levels off'. That way galli knows whether we're dealing with a memory leak or just some static high memory usage.
@galli-leo unmanaged memory would be IO buffers, libraries, and lots of mono internals. Native libraries like openssl all use unmanaged memory exclusively. So yes, there's going to be quite a bit of unmanaged memory in use.
I'm not going to guide ppl through the process of using the log profiler, I simply doing have the time for it, but the mono docs at http://www.mono-project.com/docs/debug+profile/profile/profiler/ should give you all the info you need.
Taloth
on 2 Dec 2017
@Taloth Unfortunately I am unable to add swap in the graph, in a short while I'll try another way to grab that info.
In the meantime I restarted Radarr and took a couple of screenshots of my usage over just over 24 hours:
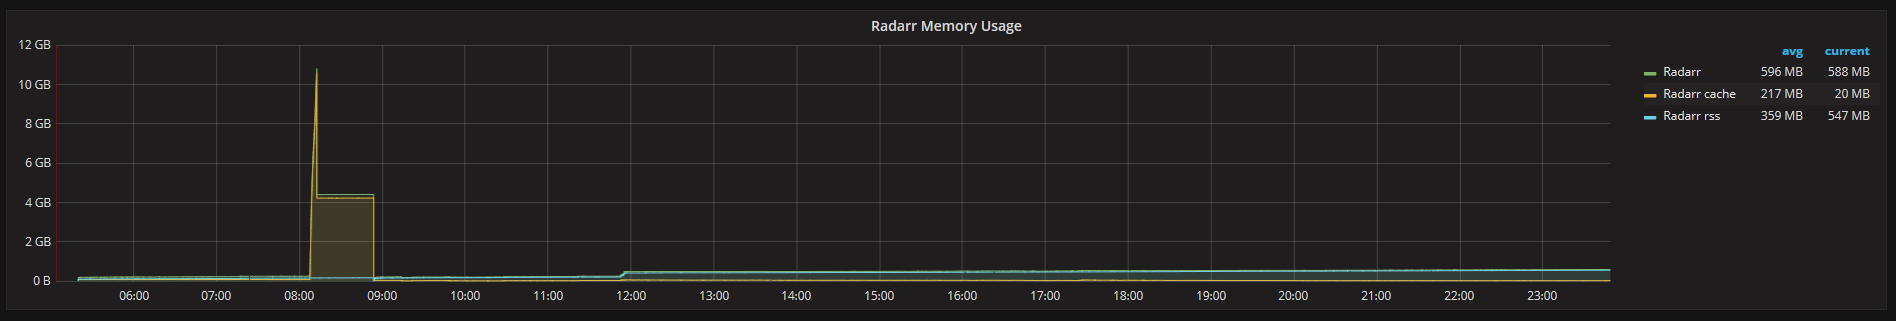
As you can see memory usage has continued to climb, every time I visit the web-UI I see a small increase in usage that never decreases. Also every time the Refresh Movie task is run, memory increases and never decreases.
What I'm not sure about is if this is some kind of leak why it has only gone up to around 2.5-3GB of usage and no further.
I have turned on debugging for the same period, however Radarr has split those logs up into many different files. If you would like those logs I'll try and join them up and send them your way.
@galli-leo Hopefully this will help in diagnosing this issue.
Firelfy
on 5 Dec 2017
it's caused by the "Update Library" ... I guess 'feature'... once you restart the ram usage goes back to normal. Once you hit "Update Library" once it's finished it doesn't release the ram it has taken up.
temporary fix to kill the entire thing and restart it multiple times a day
 hiragashi
on 31 Dec 2017
hiragashi
on 31 Dec 2017
Seems like the culprit to me. I have plenty of ram so it's no concern to me, especially since my dockers auto restart weekly anyway. However I'm sure this would be an issue for some.
Firelfy
on 5 Jan 2018
Been watching this as I have radarr running on a memory limited raspberry pi, and been running into crashes due to radarr/mono running out of memory. Total memory in use sits just under 50% with radarr on a fresh start, and I could see in use memory going up each time I did an update library. Restart radarr, and back under 50% again. So it would appear to be it to me as well, and I just run into issues a lot sooner than most due to my limited available memory.
 Flatshift
on 6 Jan 2018
Flatshift
on 6 Jan 2018
I can confirm that the RAM usage is out of the ordinary on my side too. running 3 days and I am on 800mb of ram used just by radarr (running inside of linuxserver.io container). I suspect that the crash my nas had a few days ago was caused by Radarr taking up too much ram. I will keep an eye on it from now on forward.
 BoKKeR
on 6 Feb 2018
BoKKeR
on 6 Feb 2018
@BoKKeR I doubt it was caused by Radarr, even if it was using too much Ram. That should never lead to an os crash, especially if it's inside a docker. Also 800mb doesn't seem to unreasonable for a mono application this large, since it has to run a webserver as well. When I finally have some more time I will try to profile the memory usage of Radarr.
galli-leo
on 6 Feb 2018
I don't know if this would be the same thing but I can reproduce a leak by triggering the housekeeping task (so I have this problem every 24 hours):
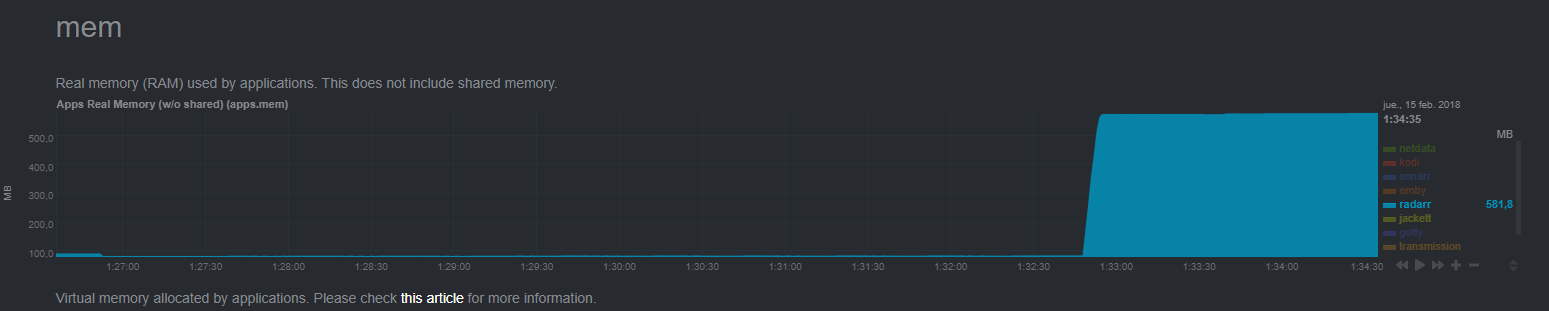
This is on a linux system with latest mono 5.8.0 and 2GB of mem total. Thats a +500MB increase in an instant (pure mem usage, non shared, non virtual) that eventually crashes Radarr but in the mean time might make the system unusable, as soon as something else (kodi playing) is going on. This has been happening to me more less since the latest update where previously would not go over ~200MB. Radarr holds ~50 items. Got no problems with Sonarr nor Jackett.
Executing the housekeeping a second time does not further increase memory usage as far as I can tell.
Profiling data:
https://ufile.io/peu3y
Trace logs, not much happening to be honest.
radarr.trace.txt
 jacaru
on 15 Feb 2018
jacaru
on 15 Feb 2018
@jacaru Did you try limiting Radarr's memory usage? Not sure why the houskeeping task would cause such a memory increase, it only executes a few sql queries. Especially, since we didn't add any stuff to that in the latest release. Are you sure the daily movies refresh doesn't happen at the same time?
Thanks for the profile report, unfortunately the allocations dont seem to be in there for whatever reason :( Can you redo the report with log:calls,alloc ?
galli-leo
on 15 Feb 2018
Probably did something wrong with that profile, I wanted to leave calls out because it becomes very big and slow. This new profile has both calls and allocs anyway.
https://ufile.io/jgv5o
How would I go about limiting the memory for radarr? Any hint?
jacaru
on 15 Feb 2018
Oh wow yeah that's big (rip my laptop processing that). Are you using docker, if so it should be relatively easy (just search for, don't know it myself either). If not, probably a lot harder.
galli-leo
on 15 Feb 2018
Took a look on my side, and the profile does not match the numbers:
Total memory allocated: 101057416 bytes in 1984716 objects
Against the +500MB usage the system reports. How would that be? I guess the architecture where you analyze the report needs not be the same as where it was generated?
jacaru
on 15 Feb 2018
@jacaru Could be something like Taloth is experiencing?:
Your graph missing something important: what kind of memory usage. If during a library scan Radarr opens up a lot of files then the OS will happily load/cache those files in memory.
I have a mongodb instance on my server that uses 139 GB of virtual memory... (the machine has 8 GB of physical ram). It just happens to have mapped the database into virtual memory space, but in reality it uses only 58 MB with another 111 MB swapped out. Once the database gets busy, the RAM usage shoots up since data from the disk is suddenly cached into memory, and that's fine.
Also what's the timeframe of your profile? i.e. started radarr at 0s, executed x at 2s, killed radarr at 4s.
galli-leo
on 15 Feb 2018
@Taloth Sorry to bother you again, but I basically have no idea what I am doing when it comes to memory debugging 😬.
Anyways, according to @jacaru profile, the most memory is taken up by Strings. Most of that is taken up by sqlite stuff, especially the Providers. Maybe something in the sqlite process, BasicRepository, DataMapper doesn't release the strings / objects? As I said, no idea why that would be happening.
28013440     489131       57 System.String
    6858192 bytes from:
        Marr.Data.QGen.QueryBuilder`1<T_REF>:ToList ()
        Marr.Data.DataMapper:Query<T_REF> (string,System.Collections.Generic.ICollection`1<T_REF>,bool)
        Marr.Data.Mapping.MappingHelper:CreateAndLoadEntity<T_REF> (Marr.Data.Mapping.ColumnMapCollection,System.Data.Common.DbDataReader,bool)
        Marr.Data.Mapping.MappingHelper:CreateAndLoadEntity (System.Type,Marr.Data.Mapping.ColumnMapCollection,System.Data.Common.DbDataReader,bool)
        Marr.Data.Mapping.MappingHelper:LoadExistingEntity (Marr.Data.Mapping.ColumnMapCollection,System.Data.Common.DbDataReader,object,bool)
        NzbDrone.Core.Datastore.Converters.ProviderSettingConverter:FromDB (Marr.Data.Converters.ConverterContext)
        NzbDrone.Common.Reflection.ReflectionExtensions:FindTypeByName (System.Reflection.Assembly,string)
        System.Linq.Enumerable:SingleOrDefault<TSource_REF> (System.Collections.Generic.IEnumerable`1<TSource_REF>,System.Func`2<TSource_REF, bool>)
        NzbDrone.Common.Reflection.ReflectionExtensions/<>c__DisplayClass7_0:<FindTypeByName>b__0 (System.Type)
        (wrapper managed-to-native) System.RuntimeType:get_Name (System.RuntimeType)
    1376216 bytes from:
        Marr.Data.QGen.SortBuilder`1<T_REF>:ToList ()
        Marr.Data.QGen.QueryBuilder`1<T_REF>:ToList ()
        Marr.Data.DataMapper:QueryToGraph<T_REF> (string,Marr.Data.EntityGraph,System.Collections.Generic.List`1<System.Reflection.MemberInfo>)
        Marr.Data.Mapping.MappingHelper:CreateAndLoadEntity (System.Type,Marr.Data.Mapping.ColumnMapCollection,System.Data.Common.DbDataReader,bool)
        Marr.Data.Mapping.MappingHelper:LoadExistingEntity (Marr.Data.Mapping.ColumnMapCollection,System.Data.Common.DbDataReader,object,bool)
        System.Data.SQLite.SQLiteDataReader:GetOrdinal (string)
        System.Data.SQLite.SQLite3:ColumnIndex (System.Data.SQLite.SQLiteStatement,string)
        System.Data.SQLite.SQLite3:ColumnName (System.Data.SQLite.SQLiteStatement,int)
        System.Data.SQLite.SQLiteConvert:UTF8ToString (intptr,int)
        (wrapper managed-to-native) string:FastAllocateString (int)
    339848 bytes from:
        Marr.Data.QGen.QueryBuilder`1<T_REF>:ToList ()
        Marr.Data.DataMapper:Query<T_REF> (string,System.Collections.Generic.ICollection`1<T_REF>,bool)
        Marr.Data.Mapping.MappingHelper:CreateAndLoadEntity<T_REF> (Marr.Data.Mapping.ColumnMapCollection,System.Data.Common.DbDataReader,bool)
        Marr.Data.Mapping.MappingHelper:CreateAndLoadEntity (System.Type,Marr.Data.Mapping.ColumnMapCollection,System.Data.Common.DbDataReader,bool)
        Marr.Data.Mapping.MappingHelper:LoadExistingEntity (Marr.Data.Mapping.ColumnMapCollection,System.Data.Common.DbDataReader,object,bool)
        System.Data.SQLite.SQLiteDataReader:GetValue (int)
        System.Data.SQLite.SQLite3:GetValue (System.Data.SQLite.SQLiteStatement,System.Data.SQLite.SQLiteConnectionFlags,int,System.Data.SQLite.SQLiteType)
        System.Data.SQLite.SQLite3:GetText (System.Data.SQLite.SQLiteStatement,int)
        System.Data.SQLite.SQLiteConvert:UTF8ToString (intptr,int)
        (wrapper managed-to-native) string:FastAllocateString (int)
    333216 bytes from:
        Marr.Data.QGen.QueryBuilder`1<T_REF>:ToList ()
        Marr.Data.DataMapper:QueryToGraph<T_REF> (string,Marr.Data.EntityGraph,System.Collections.Generic.List`1<System.Reflection.MemberInfo>)
        Marr.Data.EntityGraph:IsNewGroup (System.Data.Common.DbDataReader)
        Marr.Data.GroupingKeyCollection:CreateGroupingKey (System.Data.Common.DbDataReader)
        System.Data.SQLite.SQLiteDataReader:get_Item (string)
        System.Data.SQLite.SQLiteDataReader:GetOrdinal (string)
        System.Data.SQLite.SQLite3:ColumnIndex (System.Data.SQLite.SQLiteStatement,string)
        System.Data.SQLite.SQLite3:ColumnName (System.Data.SQLite.SQLiteStatement,int)
        System.Data.SQLite.SQLiteConvert:UTF8ToString (intptr,int)
        (wrapper managed-to-native) string:FastAllocateString (int)
    325008 bytes from:
        System.Data.SQLite.UnsafeNativeMethods:Initialize ()
        System.Data.SQLite.UnsafeNativeMethods:SearchForDirectory (string&,string&)
        System.Data.SQLite.UnsafeNativeMethods:GetPlatformName (string)
        System.Data.SQLite.UnsafeNativeMethods:GetProcessorArchitecture ()
        System.Data.SQLite.UnsafeNativeMethods:GetSettingValue (string,string)
        System.Data.SQLite.UnsafeNativeMethods:GetXmlConfigFileName ()
        System.Data.SQLite.UnsafeNativeMethods:GetAssemblyDirectory ()
        System.Data.SQLite.UnsafeNativeMethods:CheckAssemblyCodeBase (System.Reflection.Assembly,string&)
        System.Data.SQLite.UnsafeNativeMethods:CheckForArchitecturesAndPlatforms (string,System.Collections.Generic.List`1<string>&)
        (wrapper managed-to-native) string:FastAllocateString (int)
    323056 bytes from:
        System.Data.SQLite.SQLiteConnection:.ctor (string,bool)
        System.Data.SQLite.UnsafeNativeMethods:Initialize ()
        System.Data.SQLite.UnsafeNativeMethods:SearchForDirectory (string&,string&)
        System.Data.SQLite.UnsafeNativeMethods:GetProcessorArchitecture ()
        System.Data.SQLite.UnsafeNativeMethods:GetSettingValue (string,string)
        System.Data.SQLite.UnsafeNativeMethods:GetXmlConfigFileName ()
        System.Data.SQLite.UnsafeNativeMethods:GetAssemblyDirectory ()
        System.Data.SQLite.UnsafeNativeMethods:CheckAssemblyCodeBase (System.Reflection.Assembly,string&)
        System.Data.SQLite.UnsafeNativeMethods:CheckForArchitecturesAndPlatforms (string,System.Collections.Generic.List`1<string>&)
        (wrapper managed-to-native) string:FastAllocateString (int)
    323056 bytes from:
        System.Data.SQLite.SQLiteConnection:.ctor (string,bool)
        System.Data.SQLite.UnsafeNativeMethods:Initialize ()
        System.Data.SQLite.UnsafeNativeMethods:PreLoadSQLiteDll (string,string,string&,intptr&)
        System.Data.SQLite.UnsafeNativeMethods:GetBaseDirectory ()
        System.Data.SQLite.UnsafeNativeMethods:GetSettingValue (string,string)
        System.Data.SQLite.UnsafeNativeMethods:GetXmlConfigFileName ()
        System.Data.SQLite.UnsafeNativeMethods:GetAssemblyDirectory ()
        System.Data.SQLite.UnsafeNativeMethods:CheckAssemblyCodeBase (System.Reflection.Assembly,string&)
        System.Data.SQLite.UnsafeNativeMethods:CheckForArchitecturesAndPlatforms (string,System.Collections.Generic.List`1<string>&)
        (wrapper managed-to-native) string:FastAllocateString (int)
    267000 bytes from:
        Marr.Data.QGen.SortBuilder`1<T_REF>:ToList ()
        Marr.Data.QGen.QueryBuilder`1<T_REF>:ToList ()
        Marr.Data.DataMapper:QueryToGraph<T_REF> (string,Marr.Data.EntityGraph,System.Collections.Generic.List`1<System.Reflection.MemberInfo>)
        Marr.Data.Mapping.MappingHelper:CreateAndLoadEntity (System.Type,Marr.Data.Mapping.ColumnMapCollection,System.Data.Common.DbDataReader,bool)
        Marr.Data.Mapping.MappingHelper:LoadExistingEntity (Marr.Data.Mapping.ColumnMapCollection,System.Data.Common.DbDataReader,object,bool)
        System.Data.SQLite.SQLiteDataReader:GetValue (int)
        System.Data.SQLite.SQLite3:GetValue (System.Data.SQLite.SQLiteStatement,System.Data.SQLite.SQLiteConnectionFlags,int,System.Data.SQLite.SQLiteType)
        System.Data.SQLite.SQLite3:GetText (System.Data.SQLite.SQLiteStatement,int)
        System.Data.SQLite.SQLiteConvert:UTF8ToString (intptr,int)
        (wrapper managed-to-native) string:FastAllocateString (int)
    265920 bytes from:
        TinyIoC.TinyIoCContainer:ConstructType (System.Type,System.Type,System.Reflection.ConstructorInfo,TinyIoC.NamedParameterOverloads,TinyIoC.ResolveOptions)
        (wrapper dynamic-method) object:lambda_method (System.Runtime.CompilerServices.Closure,object[])
        NzbDrone.Core.Download.DownloadClientFactory:.ctor (NzbDrone.Core.Download.IDownloadClientRepository,System.Collections.Generic.IEnumerable`1<NzbDrone.Core.Download.IDownloadClient>,NzbDrone.Common.Composition.IContainer,NzbDrone.Core.Messaging.Events.IEventAggregator,NLog.Logger)
        NzbDrone.Core.ThingiProvider.ProviderFactory`2<TProvider_REF, TProviderDefinition_REF>:.ctor (NzbDrone.Core.ThingiProvider.IProviderRepository`1<TProviderDefinition_REF>,System.Collections.Generic.IEnumerable`1<TProvider_REF>,NzbDrone.Common.Composition.IContainer,NzbDrone.Core.Messaging.Events.IEventAggregator,NLog.Logger)
        System.Linq.Enumerable:ToList<TSource_REF> (System.Collections.Generic.IEnumerable`1<TSource_REF>)
        System.Linq.Enumerable/<CastIterator>d__34`1<TResult_REF>:MoveNext ()
        System.Linq.Enumerable/WhereSelectEnumerableIterator`2<TSource_REF, TResult_REF>:MoveNext ()
        TinyIoC.TinyIoCContainer:<ResolveAllInternal>b__134_2 (TinyIoC.TinyIoCContainer/TypeRegistration)
        TinyIoC.TinyIoCContainer:ResolveInternal (TinyIoC.TinyIoCContainer/TypeRegistration,TinyIoC.NamedParameterOverloads,TinyIoC.ResolveOptions)
        TinyIoC.TinyIoCContainer/DelegateFactory:GetObject (System.Type,TinyIoC.TinyIoCContainer,TinyIoC.NamedParameterOverloads,TinyIoC.ResolveOptions)
The next most allocated object seems to be just bytes, which seems to mostly stem from cryptography (I am assuming ssl):
15534992      95255      163 System.UInt32[]
    14732088 bytes from:
        Microsoft.Owin.Infrastructure.AppFuncTransition:Invoke (Microsoft.Owin.IOwinContext)
        Microsoft.AspNet.SignalR.Owin.Handlers.PersistentConnectionHandler:Invoke (System.Collections.Generic.IDictionary`2<string, object>)
        Microsoft.AspNet.SignalR.Owin.CallHandler:Invoke (System.Collections.Generic.IDictionary`2<string, object>)
        Microsoft.AspNet.SignalR.PersistentConnection:ProcessRequest (Microsoft.AspNet.SignalR.Hosting.HostContext)
        Microsoft.AspNet.SignalR.PersistentConnection:TryGetConnectionId (Microsoft.AspNet.SignalR.Hosting.HostContext,string,string&,string&,int&)
        Microsoft.AspNet.SignalR.Infrastructure.DefaultProtectedData:Unprotect (string,string)
        System.Security.Cryptography.ProtectedData:Unprotect (byte[],byte[],System.Security.Cryptography.DataProtectionScope)
        Mono.Security.Cryptography.ManagedProtection:Unprotect (byte[],byte[],System.Security.Cryptography.DataProtectionScope)
        (wrapper alloc) object:ProfilerAllocVector (intptr,intptr)
        (wrapper managed-to-native) object:__icall_wrapper_mono_profiler_raise_gc_allocation (object)
    774008 bytes from:
        Microsoft.Owin.Infrastructure.AppFuncTransition:Invoke (Microsoft.Owin.IOwinContext)
        Microsoft.AspNet.SignalR.Owin.Handlers.PersistentConnectionHandler:Invoke (System.Collections.Generic.IDictionary`2<string, object>)
        Microsoft.AspNet.SignalR.Owin.CallHandler:Invoke (System.Collections.Generic.IDictionary`2<string, object>)
        Microsoft.AspNet.SignalR.PersistentConnection:ProcessRequest (Microsoft.AspNet.SignalR.Hosting.HostContext)
        Microsoft.AspNet.SignalR.PersistentConnection:TryGetConnectionId (Microsoft.AspNet.SignalR.Hosting.HostContext,string,string&,string&,int&)
        Microsoft.AspNet.SignalR.Infrastructure.DefaultProtectedData:Unprotect (string,string)
        System.Security.Cryptography.ProtectedData:Unprotect (byte[],byte[],System.Security.Cryptography.DataProtectionScope)
        Mono.Security.Cryptography.ManagedProtection:Unprotect (byte[],byte[],System.Security.Cryptography.DataProtectionScope)
        (wrapper alloc) object:ProfilerAllocVector (intptr,intptr)
        (wrapper managed-to-native) object:__icall_wrapper_mono_gc_alloc_vector (intptr,intptr,intptr)
    5792 bytes from:
        Microsoft.Owin.Infrastructure.AppFuncTransition:Invoke (Microsoft.Owin.IOwinContext)
        Microsoft.AspNet.SignalR.Owin.Handlers.PersistentConnectionHandler:Invoke (System.Collections.Generic.IDictionary`2<string, object>)
        Microsoft.AspNet.SignalR.Owin.CallHandler:Invoke (System.Collections.Generic.IDictionary`2<string, object>)
        Microsoft.AspNet.SignalR.PersistentConnection:ProcessRequest (Microsoft.AspNet.SignalR.Hosting.HostContext)
        Microsoft.AspNet.SignalR.PersistentConnection:ProcessNegotiationRequest (Microsoft.AspNet.SignalR.Hosting.HostContext)
        Microsoft.AspNet.SignalR.Infrastructure.DefaultProtectedData:Protect (string,string)
        System.Security.Cryptography.ProtectedData:Protect (byte[],byte[],System.Security.Cryptography.DataProtectionScope)
        Mono.Security.Cryptography.ManagedProtection:Protect (byte[],byte[],System.Security.Cryptography.DataProtectionScope)
        (wrapper alloc) object:ProfilerAllocVector (intptr,intptr)
        (wrapper managed-to-native) object:__icall_wrapper_mono_profiler_raise_gc_allocation (object)
    5248 bytes from:
        Microsoft.AspNet.SignalR.Owin.Handlers.PersistentConnectionHandler:Invoke (System.Collections.Generic.IDictionary`2<string, object>)
        Microsoft.AspNet.SignalR.Owin.CallHandler:Invoke (System.Collections.Generic.IDictionary`2<string, object>)
        Microsoft.AspNet.SignalR.PersistentConnection:ProcessRequest (Microsoft.AspNet.SignalR.Hosting.HostContext)
        Microsoft.AspNet.SignalR.PersistentConnection:ProcessNegotiationRequest (Microsoft.AspNet.SignalR.Hosting.HostContext)
        Microsoft.AspNet.SignalR.Infrastructure.DefaultProtectedData:Protect (string,string)
        System.Security.Cryptography.ProtectedData:Protect (byte[],byte[],System.Security.Cryptography.DataProtectionScope)
        Mono.Security.Cryptography.ManagedProtection:Protect (byte[],byte[],System.Security.Cryptography.DataProtectionScope)
        Mono.Security.Cryptography.ManagedProtection:GetKey
So got some advice from mono devs. This might be unmanaged memory which wont show on profile, for example, open files. They suggested to take a coredump:
https://ufile.io/5f3zy
jacaru
on 15 Feb 2018
@jacaru Could you try using a different uploader (e.g. google drive) next time, this one takes ages to download. Also any suggestions from the mono devs on how to analyze a coredump?
galli-leo
on 15 Feb 2018
@jacaru Could be something like Taloth is experiencing?:
Your graph missing something important: what kind of memory usage. If during a library scan Radarr opens up a lot of files then the OS will happily load/cache those files in memory.
I have a mongodb instance on my server that uses 139 GB of virtual memory... (the machine has 8 GB of physical ram). It just happens to have mapped the database into virtual memory space, but in reality it uses only 58 MB with another 111 MB swapped out. Once the database gets busy, the RAM usage shoots up since data from the disk is suddenly cached into memory, and that's fine.
It may load files into virtual memory, but that should not take up rss memory permanently.
These are the sizes of my radarr dir:
1,2M   Backups
224M    MediaCover
1,5M    UpdateLogs
4,0K    config.xml
12M logs
208M    logs.db
1,1M    logs.db-shm
214M    logs.db-wal
1,8M    nzbdrone.db
32K nzbdrone.db-shm
340K    nzbdrone.db-wal
4,0K    nzbdrone.pid
Also what's the timeframe of your profile? i.e. started radarr at 0s, executed x at 2s, killed radarr at 4s.
Yeah, thats what I do, dont have any precise timing at hand.
@jacaru Could you try using a different uploader (e.g. google drive) next time, this one takes ages to download.
Ok.
So I guess we need to find a way to track down unmanaged memory.
jacaru
on 15 Feb 2018
Yeah, thats what I do, dont have any precise timing at hand.
But do you have some estimations? e.g. did you start Radarr, ran it for 10 minutes, downloaded some stuff, then executed Housekeeping, then killed it?
galli-leo
on 15 Feb 2018
I would say it would be start Radarr, go to the tasks page, let it breath 30 seconds, execute housekeeping, 30 seconds more, shutdown.
jacaru
on 15 Feb 2018
The bit about unmanaged memory is what I was going to say, coz 28 MB in 'strings' isn't much.
But 500 MB isn't a huge amount of memory... it's also not a leak unless triggering housekeeping will add 500 MB each time you do it. (to analyze that you'll have to look at virtual memory usage trend after triggering housekeeping repeatedly, since the resident usage will quickly top out due to physical memory constraints)
Finally, debugging core dump is particularly difficult. I think you'd have to look at tools like valgrind to be able to see where the relevant chunks of unmanaged memory is allocated (at runtime, can't do that with a core dump). I haven't gone down that particular rabbit hole myself.
Taloth
on 15 Feb 2018
To add: Determine the trend, if it's leaking periodically then valgrind might help. If it's just once after the first housekeeping then it probably requires a different approach.
@galli-leo Find out what the individual housekeeping does exactly and find a way to trigger those individually. Add a property to HousekeepingCommand so the individual housekeepers can be filtered (A string 'filter' property for housekeepers.Where(v =>v.GetType().Name.Contains(...))). Then jacaru can call the api and try the various combinations to see which adds the most memory.
Once the likely culprit has been found, make sure you have a managed memory profile for before housekeeping is run, and one after. So it can be compared. (The unmanaged memory might well be 'kept alive' by an managed instance of something)
Taloth
on 15 Feb 2018
I will check valgrind and crosscheck virtual memory. I do agree it might no be proper to talk about a leak but that does not mean the memory use is reasonable.
Comparing the file sizes to that of Sonnar...
2,1M    Backups
26M MediaCover
788K    UpdateLogs
4,0K    config.xml
8,8M    logs
3,0M    logs.db
32K logs.db-shm
5,0M    logs.db-wal
2,8M    nzbdrone.db
32K nzbdrone.db-shm
4,0K    nzbdrone.db-wal
4,0K    nzbdrone.pid
... which roughly holds 25 items compared to the 50 items of Radarr. Much smaller sizes all around. I wonder if it has anything to do.
jacaru
on 15 Feb 2018
Is there a way to reproduce this on a Mac?
 migueldeicaza
on 15 Feb 2018
migueldeicaza
on 15 Feb 2018
@Taloth Cool will check it out. I can just setup a linux environment or try to replicate memory usage on my mac, where I can attach valgrind. One thing I could think of would be the MediaCovers? Maybe it's loading the media covers into virtual memory.
Anyways, I still don't think the memory usage has anything to do with housekeepers, as others have seen it happen with the refresh movies task or rss sync. Hmm so two housekeepers (the media covers one and Clean Title Fixer), gets all movies. I am guessing _movieservice.GetAllMovies() is the culprit, since it occurs in all those other tasks too.
galli-leo
on 15 Feb 2018
I will check valgrind and crosscheck virtual memory. I do agree it might no be proper to talk about a leak but that does not mean the memory use is reasonable.
Agreed, I just wanted to point out that it's not a necessarily a 'leak' since our approach will have to be different. (If it's a truly leak then we just repeat the process to find out what gets allocated the most).
Anyway, you might want to start with the virtual memory crosscheck. What add how much vsize vs vrss vs vdata. Baseline, 1x housekeeping, 2x housekeeping. Is the baseline the same for multiple startups? etc
I'd also like to know whether it scales: Backup your appdata dir. delete half the items. run housekeeping (vacuum's the db), restart Radarr and do the test again.
Doing those tests is a bit tedious, but it's going to be easier than valgrind and gives us some basic numbers.
The first time that housekeeping gets called, mono will 'jit compile' quite a bit of methods that haven't been called yet, and the sql abstraction layer will have generated cached queries etc. Stuff that won't (shouldn't) happen again, but adds to memory. I wouldn't expect that to add that much memory usage.
@galli-leo Yes, but housekeeping is fairly local. RssSync and Refresh does quite a bit of http calls and other noisy logic. If we can exclude http then we don't have to worry about that subsystem and related unmanaged libraries. It's not the 'cause', it just likely makes it easier to isolate.
Let us know if you get it reproduced on your mac. miguel's input could be invaluable.
Last time I opened Sonarr's mlpd trace into Xamarin's Profiler it took an hour to load :smile:
Taloth
on 15 Feb 2018
I haven't been able to get radarr working with valgrind, it starts but timeouts on access. Maybe I could try triggering the houseekeeping with a REST call but dont know what resource to point the request to.
Multiple calls to housekeeping doesn't increase the memory usage further, including virtual memory. The rss sync and movie refresh tasks dont have the problem either.
I tried a separate Radarr instance with an empty database, and the problem does not happen. How is the MediaCover folder structured? Does it hold a subdir per movie? In that case I have more subdirs than movies. Also, how is 214M logs.db-wal so big?
jacaru
on 15 Feb 2018
This is htop output. Each line after the following respective actions: radarr start, housekeeping x 3, refresh movies, rss sync, housekeeping:
  PID USER      PRI  NI  VIRT   RES   SHR S CPU% MEM%   TIME+  Command
10493 radarr     30  10  160M 90464 24596 S 12.7  4.9  0:34.06 /usr/bin/mono /opt/share/Radarr/Radarr.exe -nobrowser
10493 radarr     30  10  662M  589M 25712 S  0.0 33.0  1:04.40 /usr/bin/mono /opt/share/Radarr/Radarr.exe -nobrowser
10493 radarr     30  10  663M  589M 25864 S  0.0 32.9  1:31.16 /usr/bin/mono /opt/share/Radarr/Radarr.exe -nobrowser
10493 radarr     30  10  663M  589M 25896 S  0.0 33.0  1:57.22 /usr/bin/mono /opt/share/Radarr/Radarr.exe -nobrowser
10493 radarr     30  10  681M  599M 26476 S  0.6 33.5  3:55.84 /usr/bin/mono /opt/share/Radarr/Radarr.exe -nobrowser
10493 radarr     30  10  684M  599M 26520 S  0.0 33.5  4:16.02 /usr/bin/mono /opt/share/Radarr/Radarr.exe -nobrowser
10493 radarr     30  10 1176M 1068M  1072 S  7.8 59.7  4:43.57 /usr/bin/mono /opt/share/Radarr/Radarr.exe -nobrowser
The I restarted radarr, deleted half of the movies, housekeeping, restarted again. Note the size of the radarr directory did not decrease after this procedure.
After that, got this htop output where each line after the following respective actions: radarr start, housekeeping x 3, refresh movies, housekeeping, rss sync, housekeeping, refresh movies, housekeeping:
  PID USER      PRI  NI  VIRT   RES   SHR S CPU% MEM%   TIME+  Command
10956 radarr     30  10  162M 91836 24404 S  0.0  5.0  0:26.91 /usr/bin/mono /opt/share/Radarr/Radarr.exe -nobrowser
10956 radarr     30  10  665M  591M 26332 S 66.2 33.0  0:51.45 /usr/bin/mono /opt/share/Radarr/Radarr.exe -nobrowser
10956 radarr     30  10  672M  592M 26364 S  0.0 33.1  1:09.77 /usr/bin/mono /opt/share/Radarr/Radarr.exe -nobrowser
10956 radarr     30  10  672M  593M 26400 S  0.0 33.2  1:43.50 /usr/bin/mono /opt/share/Radarr/Radarr.exe -nobrowser
10956 radarr     30  10  694M  607M 22944 S  0.0 33.9  2:41.65 /usr/bin/mono /opt/share/Radarr/Radarr.exe -nobrowser
10956 radarr     30  10 1189M 1083M  2524 S  9.5 60.6  3:06.28 /usr/bin/mono /opt/share/Radarr/Radarr.exe -nobrowser
10956 radarr     30  10 1129M 1025M  4128 S  7.2 57.3  3:37.83 /usr/bin/mono /opt/share/Radarr/Radarr.exe -nobrowser
10956 radarr     30  10 1133M 1030M  5444 S  0.0 57.6  4:37.54 /usr/bin/mono /opt/share/Radarr/Radarr.exe -nobrowser
10956 radarr     30  10 1136M 1032M  4276 S  9.3 57.7  4:49.80 /usr/bin/mono /opt/share/Radarr/Radarr.exe -nobrowser
but dont know what resource to point the request to.
bash script https://gist.github.com/Taloth/dee53e840f5dd7080687cf65c02e2bc1 don't forget to update url and apikey, please note that commands are asynchronous, the api call will only trigger the command, it won't wait for it to finish.
Multiple calls to housekeeping doesn't increase the memory usage further
Excellent, we'll have to look at the one-time init and caches. You'll need @galli-leo help to trigger individual housekeepers.
I tried a separate Radarr instance with an empty database, and the problem does not happen.
Use half the items, not empty, but given the earlier results don't expect it to scale.
How is the MediaCover folder structured? Does it hold a subdir per movie?
It does on Sonarr, so probably yes. Each dir is the ID of the item in the database, an incremental integer. However, that's rather unlikely to be related.
Also, how is 214M logs.db-wal so big?
writeahead journal for sqlite. How big is logs.db itself?
214M is too big imho, at least for Sonarr, but I don't know if Radarr logs a lot more details to System->Logs.
Run sqlite3 logs.db "PRAGMA integrity_check" it should return 'ok'. If it's ok, then be sure Radarr is stopped and run sqlite3 logs.db "pragma journal_mode=truncate; VACUUM;" then restart Radarr. The wal file will return but start at 0.
If logs.db is that big too, then stop Radarr, move logs.db* (all 3 files) to somewhere else, start Radarr and run the memory test again. (again unlikely, but I rather not skip over anything at this point)
_I'll reply to your second post separately_
Taloth
on 15 Feb 2018
@galli-leo The increase from 600M RSS to 1060M after rss-sync+housekeeping is peculiar. Obviously the code has been jitted already and relevant caches filled due to earlier calls. So what's swallowing 400M? Can you get jacaru a version with housekeeper filter?
Taloth
on 15 Feb 2018
Yes, the logs.db file is just as big. Removed the log files and tested: these show start, housekeeping, rss sync, housekeeping, movie refresh, housekeeping x2, movie refresh, housekeeping, rss, housekeeping, rss, housekeeping:
  PID USER      PRI  NI  VIRT   RES   SHR S CPU% MEM%   TIME+  Command
12374 radarr     30  10  167M 95208 24676 S  0.0  5.2  0:43.79 /usr/bin/mono /opt/share/Radarr/Radarr.exe -nobrowser
12374 radarr     30  10  168M 96848 24736 S  0.0  5.3  0:52.65 /usr/bin/mono /opt/share/Radarr/Radarr.exe -nobrowser
12374 radarr     30  10  174M   99M 24756 S  0.0  5.5  1:28.08 /usr/bin/mono /opt/share/Radarr/Radarr.exe -nobrowser
12374 radarr     30  10  177M  102M 24868 S  0.0  5.7  1:37.74 /usr/bin/mono /opt/share/Radarr/Radarr.exe -nobrowser
12374 radarr     30  10  186M  106M 26396 S  0.0  6.0  3:16.21 /usr/bin/mono /opt/share/Radarr/Radarr.exe -nobrowser
12374 radarr     30  10  190M  109M 26504 S  0.0  6.1  3:28.34 /usr/bin/mono /opt/share/Radarr/Radarr.exe -nobrowser
12374 radarr     30  10  192M  112M 26504 S  0.0  6.3  3:41.94 /usr/bin/mono /opt/share/Radarr/Radarr.exe -nobrowser
12374 radarr     30  10  191M  112M 26564 S 86.4  6.3  5:28.12 /usr/bin/mono /opt/share/Radarr/Radarr.exe -nobrowser
12374 radarr     30  10  191M  112M 26564 S  0.0  6.3  5:34.98 /usr/bin/mono /opt/share/Radarr/Radarr.exe -nobrowser
12374 radarr     30  10  193M  113M 26500 S  0.0  6.4  6:12.87 /usr/bin/mono /opt/share/Radarr/Radarr.exe -nobrowser
12374 radarr     30  10  193M  113M 26500 S  0.7  6.4  6:15.95 /usr/bin/mono /opt/share/Radarr/Radarr.exe -nobrowser
12374 radarr     30  10  192M  113M 26532 S  0.0  6.3  6:51.83 /usr/bin/mono /opt/share/Radarr/Radarr.exe -nobrowser
12374 radarr     30  10  192M  113M 26564 S  0.0  6.3  6:56.52 /usr/bin/mono /opt/share/Radarr/Radarr.exe -nobrowser
So problem is gone by removing the logs files, duh.
jacaru
on 15 Feb 2018
zip up the original logs.db* files and get em to galli, that might allow him to reproduce the issue consistently and find out where in sqlite the memory is kept alive.
Also, with the original logs db check /proc/(id)/maps to see if it actually is memory mapped.
my guess is that the VACUUM during housekeeping keeps open the connection.
Taloth
on 16 Feb 2018
@jacaru Yup if you could send over the log it should be easy to replicate.
@Taloth Do you think the issue could be the log statements surrounding the Vacuum command?:
_logger.Info("Vacuuming {0} database", _databaseName);
                _datamapperFactory().ExecuteNonQuery("Vacuum;");
                _logger.Info("{0} database compressed", _databaseName);
Not sure what else would keep the connection open.
galli-leo
on 16 Feb 2018
Here are the logs
https://drive.google.com/file/d/12lxOdq7jCGCZ0_hk5eXm5F1DMaF-A_6X/view?usp=sharing
jacaru
on 16 Feb 2018
@galli-leo Afaik the connection is always kept open. I kinda ran into that when tweaking the Backup logic last year. My concern is why it's using memory in the first place, hence the question about the memory map. In my Sonarr instance only .db-shm is memory mapped, which means the db data is probably loaded (and kept in memory) by libsqlite itself. I believe System.Data.Sqlite has some methods of looking at sqlite's memory usage.
Anyway, if you check the logs he posted you'll see an abundance of recurring warnings, that explains the db size. There are ways to prevent that Warn from being logged repeatedly, but it depends on how the ParserService is called.
I'm thinking two issues:
- That Warn logged every minute, causing too many log events.
- db data is likely being kept in memory. we need to find out if that's done by libsqlite and why.
Taloth
on 16 Feb 2018
@Taloth Hmm that makes a lot more sense than my guess. I really should stop guessing at things I have no idea about lol.
Regarding the warn (haven't had the time to look at the actual logs, guessing parser having problems with a download): This is probably why this issue has come up more for radarr users. We do the downloaded movies scan every 15 seconds instead of 1 minute like you. This would probably lead to a 4x blowup compared to Sonarr in similar situations. Pair that with users having much more movies compared to series in their libraries, info log entries (or warnings on poster downloads) could blow up the log db quite a bit after the daily refresh.
Regarding on how to fix this, maybe we should only keep one entry per log message? i.e. do an insert ... on duplicate update ... and add occurences as well as last_occurance?
sample query: insert into log (message) Values ('My Error') on duplicate key update last_occurance=now, occurances=occurances+1
Regarding your second point, no idea on how to fix that, will check it and the logs from jacaru out once I get home.
galli-leo
on 17 Feb 2018
Regarding on how to fix this, maybe we should only keep one entry per log message? i.e. do an insert ... on duplicate update ... and add occurences as well as last_occurance?
It's a log, not a 'pending issues' list, so I don't think so. What's the problem here is that unidentifiable imports aren't visible anywhere (For Sonarr v3 we plan to add it to Activity), meaning the log is the user's only method of seeing something's wrong. Fix that and you won't need a Warn level message there.
Taloth
on 17 Feb 2018
The reason I asked for a repro on the Mac, is that on the Mac you can use Instruments to profile the unmanaged memory and it would be very simple to pinpoint the culprit there.
migueldeicaza
on 20 Feb 2018
@migueldeicaza That's a good point. you could try using the huge log db from above to repro it. Though I doubt that instrument gives anything useful without debugging symbols.
Edit: Just noticed you're working for Microsoft :sweat_smile: Last time I used instruments for something, I had a really hard time getting the debug symbols to build and actually load. Is there something special you have to do, to get debugging symbols for mono apps?
galli-leo
on 20 Feb 2018
Hi guys, I read this topic after I saw radarr consuming 1054MB while sonarr is consuming 299MB.
[Linux Server docker image]
Version: 0.2.0.995
Mono Version: 5.10.0.160
-------
Movies: 516
Downloaded: 62
Monitored: 60
-------
Idk if I'm on the same issue or the library is just big.
(these 516 is this big because of the movie Lists configuration
option, (i think) but few of them is monitored (and I think most
of them do not need to be monitored anymore) )
I will try to unmonitor some movies and disable the "Lists" to
reduce the movie count.
Anyway, if someone needs anything I could try to help.
Edit---------
I've deleted all my movies, and yes, i think the problem
was the movie count. With no Movies reduced to 159MB.
I will add my movies again and report how much it uses.
Edit2--------
Now with 61 Movies and 0 Monitored:
Before Library Update, it uses arround 299MB.
After Library Update, it uses arround 644MB.
It doubles the ram usage during Library Update,
and maintain the ram usage even after is done.
 felipewnp
on 10 Apr 2018
felipewnp
on 10 Apr 2018
Any news about this issue? I can't even import my library after a fresh install, when bulk importing more than 50 movies at once it's 100% chance of OOM Killer killing something (most times it kills radarr). Machine has just 1GB ram and 1GB swap. Sonarr is working fine with 100+ series and 2000+ episodes.
 drwyrm
on 25 Apr 2018
drwyrm
on 25 Apr 2018
Any update on this? Radarr was eating 2GB of RAM on my CentOS 7 install with latest kernel 4.x and latest patches to python & mono
 billykwooten
on 11 May 2018
billykwooten
on 11 May 2018
Any update. I also can not get through a bulk import
 dougshell
on 24 Jun 2018
dougshell
on 24 Jun 2018
is this solved? my radarr was using 12gb, running the latest version of it on ubuntu 18.04, after restart service it droped to almost 0 and slowly creep up 4-6gb a day until swap file is full.
 yanxunhu
on 4 Jul 2018
yanxunhu
on 4 Jul 2018
Well it's been over a year and no fix yet. So here is my fix for this issue, I limited the memory my systemd process uses like so:
[Service]
CPUShares=512
MemoryLimit=1G
If you're running this inside a docker image, limit the container memory with the --memory=1G flag for example when you run your container.
Radarr seems to be fine when doing this and even though it eats all the memory you allocate to it obviously due to the memory leak, it runs fine.
billykwooten
on 4 Jul 2018
One thing to try out is to delete your log db file and or post here how many entries you have / how large it is. It may be the culprit.
galli-leo
on 4 Jul 2018
This bug is kind of easy to reproduce, so, I'm not sure if the devs really
need more information.. It's just a matter of bulk importing a small (100
movies is more than enough) collection. It happens also on a fresh install
of Radarr, and seems completely unrelated to the total DB size, if you keep
restarting Radarr every 50-100 movies imported you are able to have a 5000+
movies collection without problems. If you bulk import 200 movies at once
it will cause Radarr to use 3GB+ of RAM even if you start from scratch,
with a clean DB. It happens also when importing movies from lists or add
them manually.
Limiting the resource usage at container/systemd level isn't a proper fix
either, as it will simply kill Radarr when it reaches the limit, adding a
cron job to kill Radarr every X hours would be just as "good".
Em qua, 4 de jul de 2018 às 18:50, Leonardo Galli notifications@github.com
escreveu:
One thing to try out is to delete your log db file and or post here how
many entries you have / how large it is. It may be the culprit.—
You are receiving this because you are subscribed to this thread.
Reply to this email directly, view it on GitHub
https://github.com/Radarr/Radarr/issues/1580#issuecomment-402563787, or mute
the thread
https://github.com/notifications/unsubscribe-auth/AAhRBtY0RWz_0sA5mNgZoK-DeHQh3bspks5uDTiQgaJpZM4NoXml
.
--
Daniel Ribeiro
drwyrm
on 5 Jul 2018
I can confirm that this leak is also happening in sonarr. I'm running sonarr and radarr through docker on a linux machine, so it's probably a mono problem. Does anyone have this issue on a windows box ?
 danielbibit
on 6 Jul 2018
danielbibit
on 6 Jul 2018
Sonarr is fine for me, only Radarr uses abnormal amount of RAM. Linux, not
using docker, same mono binaries for both Sonarr and Radarr.
Em sex, 6 de jul de 2018 01:59, Daniel M. notifications@github.com
escreveu:
I can confirm that this leak is also happening in sonarr. I'm running
sonarr and radarr through docker on a linux machine, so it's probably a
mono problem. Does anyone have this issue on a windows box ?—
You are receiving this because you are subscribed to this thread.
Reply to this email directly, view it on GitHub
https://github.com/Radarr/Radarr/issues/1580#issuecomment-402925908, or mute
the thread
https://github.com/notifications/unsubscribe-auth/AAhRBpIarwTlI3n5O8KlpQXhFgOyqX2_ks5uDu6cgaJpZM4NoXml
.
Em 6 de jul de 2018 1:59 AM, "Daniel M." notifications@github.com
escreveu:
I can confirm that this leak is also happening in sonarr. I'm running
sonarr and radarr through docker on a linux machine, so it's probably a
mono problem. Does anyone have this issue on a windows box ?
—
You are receiving this because you are subscribed to this thread.
Reply to this email directly, view it on GitHub
https://github.com/Radarr/Radarr/issues/1580#issuecomment-402925908, or mute
the thread
https://github.com/notifications/unsubscribe-auth/AAhRBpIarwTlI3n5O8KlpQXhFgOyqX2_ks5uDu6cgaJpZM4NoXml
.
drwyrm
on 6 Jul 2018
This issue has been automatically marked as stale because it has not had recent activity. Please verify that this is still an issue with the latest version of Radarr and report back. Otherwise this issue will be closed.
![stale[bot] picture](https://avatars3.githubusercontent.com/in/1724?v=4&s=40) stale[bot]
on 4 Sep 2018
stale[bot]
on 4 Sep 2018
So I have tried reproducing it again under a profiler but failed. Can anyone confirm this is happening on vanilla osx (so no dockers)? Else I will have to fire up an ubuntu machine and try profiling there.
galli-leo
on 12 Sep 2018
@bskrtich @drwyrm @yanxunhu What happens when you delete your log db file?
galli-leo
on 12 Sep 2018
This bug is kind of easy to reproduce, so, I'm not sure if the devs really
need more information.. It's just a matter of bulk importing a small (100
movies is more than enough) collection. It happens also on a fresh install
of Radarr, and seems completely unrelated to the total DB size, if you keep
restarting Radarr every 50-100 movies imported you are able to have a 5000+
movies collection without problems. If you bulk import 200 movies at once
it will cause Radarr to use 3GB+ of RAM even if you start from scratch,
with a clean DB. It happens also when importing movies from lists or add
them manually.
It isn't as simple as it seems, since both Windows and MacOS do not exhibit this behaviour, so I will have to install ubuntu on an old machine and create a report there.
galli-leo
on 12 Sep 2018
I have removed some unused housekeeping tasks in the latest nightly, could you guys try the latest nightly and report back on memory usage? (Before and after log deletion as well).
galli-leo
on 12 Sep 2018
Still happening, made Radarr crash for me today
 ssolidus
on 20 Sep 2018
ssolidus
on 20 Sep 2018
This is happening for me on Debian. It looks like memory isn't freed after running the 'Refresh Movie' task. I don't have the same issue with the other tasks, only 'Refresh Movie' causes ram usage to skyrocket and not return to its original level.
You won't really notice this unless you have a significant number of films as memory usage increases based on the number of films that needs scanning. Memory usage just keeps increasing and doesn't stop for the duration of that task.
 MrTopCat
on 27 Sep 2018
MrTopCat
on 27 Sep 2018
@MrTopCat Do you have the latest nightly? How large is your log.db? Have you tried deleting your log.db?
galli-leo
on 2 Oct 2018
I was running into issues where radar was using all the memory on my raspberry pi 3 running Arch Linux. Deleting the logs.db file resolved the issue for me, at least for now.
 macbeth322
on 4 Oct 2018
macbeth322
on 4 Oct 2018
i have the same problem running on ubuntu 16.04 lts odroid c2. When starting radarr it only uses around 100mb but after half a day it uses 800mb and keeps growing till the point i run out of memory wich is only 2gb on the odroid c2.
I switched from CP to radarr and i think its verry good besides this memory problem. So if this could be fixed, that would be verry nice.
 Nervwrecker
on 20 Oct 2018
Nervwrecker
on 20 Oct 2018
@macbeth322 Have you tried switching to nightly?
@Nervwrecker Have you tried nightly and deleting the logs.db?
galli-leo
on 20 Oct 2018
After reports of multiple users having success with deleting their logs.db (and related) files, I suggest everyone try this as a tempory fix.
For the long run, I have increased the DownloadedMoviesScan interval, so that log messages shouldn‘t occur that frequently anymore. Additionally, I implemented a mechanism that prevents printing a warn message for a file every time the file is scanned (i.e. every 30 seconds). This should greatly help keeping the logs.db file down.
The underlying issue is still not fixed though :(
galli-leo
on 1 Nov 2018
So I might have found out where the memory leak is. I have fixed the issue on a separate branch. Could anyone with this issue try out this build:
And tell me if anything has improved?
Note: This was quickly hacked together, so it might have some errors. Probably not good to use in production, so make a backup beforehand.
galli-leo
on 30 Nov 2018
+1 for this. Ubuntu 18.04, first install of Radarr today and everything seems to be working great, except for the large amount of memory used. Fresh reboot shows less than 1GB total system usage, then goes up to 3.5 within an hour or two.
 kstlouis
on 30 Nov 2018
kstlouis
on 30 Nov 2018
Excited to see if the memory leak fix works. I've seen my processes get up to 10G resident ;)
 seitzbg
on 30 Nov 2018
seitzbg
on 30 Nov 2018
So I am sharing my findings here, in hope of someone able to help me figure out something about this.
@everyone in this thread, if you have some experience with finding memory leaks with mono or with valgrind, please let me know / help me out with the issues described below!
@Taloth I found a definite leak of resources with how the DataMappers are handled. They are IDisposables, but aren't actually disposed. I fixed that on a separate branch, you can view the changes here: https://github.com/Radarr/Radarr/compare/fix/memory-leak#diff-1f6555e9a3ca5f1b5f2d6610480e1079
On this branch, I also tried out some other things, that could have helped: Updating System.Data.Sqlite, not setting the sqlite cache size (you set it to -10M, but according to the sqlite docs, this seems to be 10M*1024 = around 10GB. Is that intended?), etc.
Unfortunately, none of these seem to have worked. I have ran a lot of Radarr instances with the mono log profiler and analyzed those results in the Xamarin profiler. You can find a "good" run here, if you want to look at it and see what you can find out: https://galli.me/output.mlpd (it's only 700MB so should load into Xamarin profiler somewhat quickly :)).
From what I can tell, while we do have a lot of allocations going to Strings for the sql queries, they do not seem to be retained. Additionally, from the various heapshots in that profiler run, I see that 11MB are persisted. However, this does not seem to match up with the working set, which is well in the 600MB range by that time. This means, the leak is likely in unmanaged code, correct?
I tried to run valgrind against Radarr, however, I didn't manage to find any leaks / as soon as I make an HTTP request, the following happens:
- Owin will set the CurrentPrincipal of the current thread to null.
- This calls the following function in the sdtlib: https://github.com/mono/mono/blob/ab0736fa79a31cff42abe5941deb225bb15b5461/mcs/class/corlib/System.Threading/Thread.cs#L278
- Since the new value is null, this will obviously throw an exception.
- It seems that mono implemented this, by listening for a SIGSEGV and then reconstructing the stack, to set the instruction pointer to where the catch block is.
Now, this is fine in normal execution and works correctly. However, valgrind thinks this is an error and kills the process :( do you have any idea how to get around this? I have tried to search for an option to ignore that for valgring, but I haven't found anything. I am currently in the process of "fixing" this in the mono stdlib itself locally, so I can at least have valgrind listen on an HTTP request. Is there a better option?
Furthermore, when valgrind kills the process, it has already detected some possible leaks, the ones especially interesting are in the sqlite library. However, this could also just be because it just killed the process? Anyways, here is the valgrind log for anyone that is interested:
--30309-- Reading syms from /home/leo/Radarr/_output_mono/Prowlin.dll.so
--30309-- Discarding syms at 0x10800450-0x108021f0 in /home/leo/Radarr/_output_mono/Prowlin.dll.so due to munmap()
--30309-- Reading syms from /home/leo/Radarr/_output_mono/Growl.CoreLibrary.dll.so
--30309-- Discarding syms at 0x10800450-0x10802f00 in /home/leo/Radarr/_output_mono/Growl.CoreLibrary.dll.so due to munmap()
--30309-- memcheck GC: 1000 nodes, 5 survivors (0.5%)
==30309== Conditional jump or move depends on uninitialised value(s)
==30309==    at 0x5BFAFB: mono_icall_get_machine_name (icall.c:6741)
==30309==    by 0x5D4EA7: ves_icall_System_Environment_get_MachineName (icall.c:6762)
==30309==    by 0x5D4EA7: ves_icall_System_Environment_get_MachineName_raw (icall-def.h:318)
==30309==    by 0x106D53F2: ???
==30309==    by 0x42C7A0: mono_jit_runtime_invoke (mini-runtime.c:3189)
==30309==    by 0x620F7F: do_runtime_invoke (object.c:2978)
==30309==    by 0x627A93: mono_runtime_class_init_full (object.c:521)
==30309==    by 0x459D93: mono_method_to_ir (method-to-ir.c:9321)
==30309==    by 0x51E27F: mini_method_compile (mini.c:3488)
==30309==    by 0x51FFB3: mono_jit_compile_method_inner (mini.c:4076)
==30309==    by 0x42A75E: mono_jit_compile_method_with_opt (mini-runtime.c:2450)
==30309==    by 0x4AC824: common_call_trampoline (mini-trampolines.c:751)
==30309==    by 0x4AD1C2: mono_magic_trampoline (mini-trampolines.c:891)
==30309==
--30309-- memcheck GC: 1000 nodes, 5 survivors (0.5%)
--30309-- memcheck GC: 1000 nodes, 180 survivors (18.0%)
--30309-- memcheck GC: 1014 new table size (driftup)
--30309-- memcheck GC: 1014 nodes, 29 survivors (2.9%)
--30309-- Reading syms from /lib/x86_64-linux-gnu/libnss_files-2.23.so
--30309--   Considering /lib/x86_64-linux-gnu/libnss_files-2.23.so ..
--30309--   .. CRC mismatch (computed bbddf769 wanted cc29886c)
--30309--   Considering /usr/lib/debug/lib/x86_64-linux-gnu/libnss_files-2.23.so ..
--30309--   .. CRC is valid
--30309-- REDIR: 0x5a0d1a0 (libc.so.6:__GI_strcpy) redirected to 0x4c31110 (__GI_strcpy)
--30309-- memcheck GC: 1014 nodes, 7 survivors (0.7%)
--30309-- memcheck GC: 1014 nodes, 11 survivors (1.1%)
--30309-- memcheck GC: 1014 nodes, 7 survivors (0.7%)
--30309-- memcheck GC: 1014 nodes, 15 survivors (1.5%)
--30309-- memcheck GC: 1014 nodes, 11 survivors (1.1%)
--30309-- memcheck GC: 1014 nodes, 10 survivors (1.0%)
==30309== Thread 14 Thread Pool Wor:
==30309== Invalid read of size 8
==30309==    at 0x868C118: System_Threading_Thread_SerializePrincipal_System_Threading_Thread_System_Security_Principal_IPrincipal (Thread.cs:203)
==30309==    by 0x868C870: System_Threading_Thread_set_CurrentPrincipal_System_Security_Principal_IPrincipal (Thread.cs:278)
==30309==    by 0x1332D9FA: ???
==30309==  Address 0x0 is not stack'd, malloc'd or (recently) free'd
==30309==
==30309== Invalid write of size 8
==30309==    at 0x70A6F2: mono_sigctx_to_monoctx (mono-context.c:205)
==30309==    by 0x5123A0: mono_arch_handle_altstack_exception (exceptions-amd64.c:908)
==30309==    by 0x42D483: mono_sigsegv_signal_handler_debug (mini-runtime.c:3546)
==30309==    by 0x556038F: ??? (in /lib/x86_64-linux-gnu/libpthread-2.23.so)
==30309==    by 0x868C117: System_Threading_Thread_SerializePrincipal_System_Threading_Thread_System_Security_Principal_IPrincipal (Thread.cs:202)
==30309==    by 0x868C870: System_Threading_Thread_set_CurrentPrincipal_System_Security_Principal_IPrincipal (Thread.cs:278)
==30309==    by 0x1332D9FA: ???
==30309==  Address 0x12f13dc0 is on thread 14's stack
==30309==
==30309== Invalid write of size 8
==30309==    at 0x70A6F9: mono_sigctx_to_monoctx (mono-context.c:205)
==30309==    by 0x5123A0: mono_arch_handle_altstack_exception (exceptions-amd64.c:908)
==30309==    by 0x42D483: mono_sigsegv_signal_handler_debug (mini-runtime.c:3546)
==30309==    by 0x556038F: ??? (in /lib/x86_64-linux-gnu/libpthread-2.23.so)
==30309==    by 0x868C117: System_Threading_Thread_SerializePrincipal_System_Threading_Thread_System_Security_Principal_IPrincipal (Thread.cs:202)
==30309==    by 0x868C870: System_Threading_Thread_set_CurrentPrincipal_System_Security_Principal_IPrincipal (Thread.cs:278)
==30309==    by 0x1332D9FA: ???
==30309==  Address 0x12f13db8 is on thread 14's stack
==30309==
==30309== Invalid write of size 8
==30309==    at 0x70A715: mono_sigctx_to_monoctx (mono-context.c:206)
==30309==    by 0x5123A0: mono_arch_handle_altstack_exception (exceptions-amd64.c:908)
==30309==    by 0x42D483: mono_sigsegv_signal_handler_debug (mini-runtime.c:3546)
==30309==    by 0x556038F: ??? (in /lib/x86_64-linux-gnu/libpthread-2.23.so)
==30309==    by 0x868C117: System_Threading_Thread_SerializePrincipal_System_Threading_Thread_System_Security_Principal_IPrincipal (Thread.cs:202)
==30309==    by 0x868C870: System_Threading_Thread_set_CurrentPrincipal_System_Security_Principal_IPrincipal (Thread.cs:278)
==30309==    by 0x1332D9FA: ???
==30309==  Address 0x12f13dd0 is on thread 14's stack
==30309==
==30309== Invalid write of size 8
==30309==    at 0x70A71C: mono_sigctx_to_monoctx (mono-context.c:206)
==30309==    by 0x5123A0: mono_arch_handle_altstack_exception (exceptions-amd64.c:908)
==30309==    by 0x42D483: mono_sigsegv_signal_handler_debug (mini-runtime.c:3546)
==30309==    by 0x556038F: ??? (in /lib/x86_64-linux-gnu/libpthread-2.23.so)
==30309==    by 0x868C117: System_Threading_Thread_SerializePrincipal_System_Threading_Thread_System_Security_Principal_IPrincipal (Thread.cs:202)
==30309==    by 0x868C870: System_Threading_Thread_set_CurrentPrincipal_System_Security_Principal_IPrincipal (Thread.cs:278)
==30309==    by 0x1332D9FA: ???
==30309==  Address 0x12f13dc8 is on thread 14's stack
==30309==
==30309== Invalid write of size 8
==30309==    at 0x70A738: mono_sigctx_to_monoctx (mono-context.c:207)
==30309==    by 0x5123A0: mono_arch_handle_altstack_exception (exceptions-amd64.c:908)
==30309==    by 0x42D483: mono_sigsegv_signal_handler_debug (mini-runtime.c:3546)
==30309==    by 0x556038F: ??? (in /lib/x86_64-linux-gnu/libpthread-2.23.so)
==30309==    by 0x868C117: System_Threading_Thread_SerializePrincipal_System_Threading_Thread_System_Security_Principal_IPrincipal (Thread.cs:202)
==30309==    by 0x868C870: System_Threading_Thread_set_CurrentPrincipal_System_Security_Principal_IPrincipal (Thread.cs:278)
==30309==    by 0x1332D9FA: ???
==30309==  Address 0x12f13de0 is on thread 14's stack
==30309==
==30309== Invalid write of size 8
==30309==    at 0x70A73F: mono_sigctx_to_monoctx (mono-context.c:207)
==30309==    by 0x5123A0: mono_arch_handle_altstack_exception (exceptions-amd64.c:908)
==30309==    by 0x42D483: mono_sigsegv_signal_handler_debug (mini-runtime.c:3546)
==30309==    by 0x556038F: ??? (in /lib/x86_64-linux-gnu/libpthread-2.23.so)
==30309==    by 0x868C117: System_Threading_Thread_SerializePrincipal_System_Threading_Thread_System_Security_Principal_IPrincipal (Thread.cs:202)
==30309==    by 0x868C870: System_Threading_Thread_set_CurrentPrincipal_System_Security_Principal_IPrincipal (Thread.cs:278)
==30309==    by 0x1332D9FA: ???
==30309==  Address 0x12f13dd8 is on thread 14's stack
==30309==
==30309== Invalid write of size 8
==30309==    at 0x70A75B: mono_sigctx_to_monoctx (mono-context.c:208)
==30309==    by 0x5123A0: mono_arch_handle_altstack_exception (exceptions-amd64.c:908)
==30309==    by 0x42D483: mono_sigsegv_signal_handler_debug (mini-runtime.c:3546)
==30309==    by 0x556038F: ??? (in /lib/x86_64-linux-gnu/libpthread-2.23.so)
==30309==    by 0x868C117: System_Threading_Thread_SerializePrincipal_System_Threading_Thread_System_Security_Principal_IPrincipal (Thread.cs:202)
==30309==    by 0x868C870: System_Threading_Thread_set_CurrentPrincipal_System_Security_Principal_IPrincipal (Thread.cs:278)
==30309==    by 0x1332D9FA: ???
==30309==  Address 0x12f13df0 is on thread 14's stack
==30309==
==30309== Invalid write of size 8
==30309==    at 0x70A762: mono_sigctx_to_monoctx (mono-context.c:208)
==30309==    by 0x5123A0: mono_arch_handle_altstack_exception (exceptions-amd64.c:908)
==30309==    by 0x42D483: mono_sigsegv_signal_handler_debug (mini-runtime.c:3546)
==30309==    by 0x556038F: ??? (in /lib/x86_64-linux-gnu/libpthread-2.23.so)
==30309==    by 0x868C117: System_Threading_Thread_SerializePrincipal_System_Threading_Thread_System_Security_Principal_IPrincipal (Thread.cs:202)
==30309==    by 0x868C870: System_Threading_Thread_set_CurrentPrincipal_System_Security_Principal_IPrincipal (Thread.cs:278)
==30309==    by 0x1332D9FA: ???
==30309==  Address 0x12f13de8 is on thread 14's stack
==30309==
==30309== Invalid write of size 8
==30309==    at 0x70A77E: mono_sigctx_to_monoctx (mono-context.c:209)
==30309==    by 0x5123A0: mono_arch_handle_altstack_exception (exceptions-amd64.c:908)
==30309==    by 0x42D483: mono_sigsegv_signal_handler_debug (mini-runtime.c:3546)
==30309==    by 0x556038F: ??? (in /lib/x86_64-linux-gnu/libpthread-2.23.so)
==30309==    by 0x868C117: System_Threading_Thread_SerializePrincipal_System_Threading_Thread_System_Security_Principal_IPrincipal (Thread.cs:202)
==30309==    by 0x868C870: System_Threading_Thread_set_CurrentPrincipal_System_Security_Principal_IPrincipal (Thread.cs:278)
==30309==    by 0x1332D9FA: ???
==30309==  Address 0x12f13e00 is on thread 14's stack
==30309==
==30309== Invalid write of size 8
==30309==    at 0x70A785: mono_sigctx_to_monoctx (mono-context.c:209)
==30309==    by 0x5123A0: mono_arch_handle_altstack_exception (exceptions-amd64.c:908)
==30309==    by 0x42D483: mono_sigsegv_signal_handler_debug (mini-runtime.c:3546)
==30309==    by 0x556038F: ??? (in /lib/x86_64-linux-gnu/libpthread-2.23.so)
==30309==    by 0x868C117: System_Threading_Thread_SerializePrincipal_System_Threading_Thread_System_Security_Principal_IPrincipal (Thread.cs:202)
==30309==    by 0x868C870: System_Threading_Thread_set_CurrentPrincipal_System_Security_Principal_IPrincipal (Thread.cs:278)
==30309==    by 0x1332D9FA: ???
==30309==  Address 0x12f13df8 is on thread 14's stack
==30309==
==30309== Invalid write of size 8
==30309==    at 0x70A7A1: mono_sigctx_to_monoctx (mono-context.c:210)
==30309==    by 0x5123A0: mono_arch_handle_altstack_exception (exceptions-amd64.c:908)
==30309==    by 0x42D483: mono_sigsegv_signal_handler_debug (mini-runtime.c:3546)
==30309==    by 0x556038F: ??? (in /lib/x86_64-linux-gnu/libpthread-2.23.so)
==30309==    by 0x868C117: System_Threading_Thread_SerializePrincipal_System_Threading_Thread_System_Security_Principal_IPrincipal (Thread.cs:202)
==30309==    by 0x868C870: System_Threading_Thread_set_CurrentPrincipal_System_Security_Principal_IPrincipal (Thread.cs:278)
==30309==    by 0x1332D9FA: ???
==30309==  Address 0x12f13e10 is on thread 14's stack
==30309==
==30309== Invalid write of size 8
==30309==    at 0x70A7A8: mono_sigctx_to_monoctx (mono-context.c:210)
==30309==    by 0x5123A0: mono_arch_handle_altstack_exception (exceptions-amd64.c:908)
==30309==    by 0x42D483: mono_sigsegv_signal_handler_debug (mini-runtime.c:3546)
==30309==    by 0x556038F: ??? (in /lib/x86_64-linux-gnu/libpthread-2.23.so)
==30309==    by 0x868C117: System_Threading_Thread_SerializePrincipal_System_Threading_Thread_System_Security_Principal_IPrincipal (Thread.cs:202)
==30309==    by 0x868C870: System_Threading_Thread_set_CurrentPrincipal_System_Security_Principal_IPrincipal (Thread.cs:278)
==30309==    by 0x1332D9FA: ???
==30309==  Address 0x12f13e08 is on thread 14's stack
==30309==
==30309== Invalid write of size 8
==30309==    at 0x70A7C4: mono_sigctx_to_monoctx (mono-context.c:211)
==30309==    by 0x5123A0: mono_arch_handle_altstack_exception (exceptions-amd64.c:908)
==30309==    by 0x42D483: mono_sigsegv_signal_handler_debug (mini-runtime.c:3546)
==30309==    by 0x556038F: ??? (in /lib/x86_64-linux-gnu/libpthread-2.23.so)
==30309==    by 0x868C117: System_Threading_Thread_SerializePrincipal_System_Threading_Thread_System_Security_Principal_IPrincipal (Thread.cs:202)
==30309==    by 0x868C870: System_Threading_Thread_set_CurrentPrincipal_System_Security_Principal_IPrincipal (Thread.cs:278)
==30309==    by 0x1332D9FA: ???
==30309==  Address 0x12f13e20 is on thread 14's stack
==30309==
==30309== Invalid write of size 8
==30309==    at 0x70A7CB: mono_sigctx_to_monoctx (mono-context.c:211)
==30309==    by 0x5123A0: mono_arch_handle_altstack_exception (exceptions-amd64.c:908)
==30309==    by 0x42D483: mono_sigsegv_signal_handler_debug (mini-runtime.c:3546)
==30309==    by 0x556038F: ??? (in /lib/x86_64-linux-gnu/libpthread-2.23.so)
==30309==    by 0x868C117: System_Threading_Thread_SerializePrincipal_System_Threading_Thread_System_Security_Principal_IPrincipal (Thread.cs:202)
==30309==    by 0x868C870: System_Threading_Thread_set_CurrentPrincipal_System_Security_Principal_IPrincipal (Thread.cs:278)
==30309==    by 0x1332D9FA: ???
==30309==  Address 0x12f13e18 is on thread 14's stack
==30309==
==30309== Invalid write of size 8
==30309==    at 0x70A7E7: mono_sigctx_to_monoctx (mono-context.c:212)
==30309==    by 0x5123A0: mono_arch_handle_altstack_exception (exceptions-amd64.c:908)
==30309==    by 0x42D483: mono_sigsegv_signal_handler_debug (mini-runtime.c:3546)
==30309==    by 0x556038F: ??? (in /lib/x86_64-linux-gnu/libpthread-2.23.so)
==30309==    by 0x868C117: System_Threading_Thread_SerializePrincipal_System_Threading_Thread_System_Security_Principal_IPrincipal (Thread.cs:202)
==30309==    by 0x868C870: System_Threading_Thread_set_CurrentPrincipal_System_Security_Principal_IPrincipal (Thread.cs:278)
==30309==    by 0x1332D9FA: ???
==30309==  Address 0x12f13e30 is on thread 14's stack
==30309==
==30309== Invalid write of size 8
==30309==    at 0x70A7EE: mono_sigctx_to_monoctx (mono-context.c:212)
==30309==    by 0x5123A0: mono_arch_handle_altstack_exception (exceptions-amd64.c:908)
==30309==    by 0x42D483: mono_sigsegv_signal_handler_debug (mini-runtime.c:3546)
==30309==    by 0x556038F: ??? (in /lib/x86_64-linux-gnu/libpthread-2.23.so)
==30309==    by 0x868C117: System_Threading_Thread_SerializePrincipal_System_Threading_Thread_System_Security_Principal_IPrincipal (Thread.cs:202)
==30309==    by 0x868C870: System_Threading_Thread_set_CurrentPrincipal_System_Security_Principal_IPrincipal (Thread.cs:278)
==30309==    by 0x1332D9FA: ???
==30309==  Address 0x12f13e28 is on thread 14's stack
==30309==
==30309== Thread 14 return signal frame corrupted.  Killing process.
==30309==
==30309== Process terminating with default action of signal 11 (SIGSEGV)
==30309==  General Protection Fault
==30309==    at 0x5560397: ??? (in /lib/x86_64-linux-gnu/libpthread-2.23.so)
==30309==    by 0x12F13C87: ???
--30309-- Discarding syms at 0x10d9a1b0-0x10da02a1 in /lib/x86_64-linux-gnu/libnss_files-2.23.so due to munmap()
==30309==
==30309== HEAP SUMMARY:
==30309==     in use at exit: 37,298,051 bytes in 259,126 blocks
==30309==   total heap usage: 3,204,775 allocs, 2,945,649 frees, 863,306,729 bytes allocated
==30309==
==30309== Searching for pointers to 259,126 not-freed blocks
==30309== Checked 134,810,544 bytes
==30309==
==30309== Thread 1:
==30309== 1 bytes in 1 blocks are definitely lost in loss record 51 of 60,265
==30309==    at 0x4C2DB8F: malloc (in /usr/lib/valgrind/vgpreload_memcheck-amd64-linux.so)
==30309==    by 0x71A0FD: monoeg_malloc (gmem.c:108)
==30309==    by 0x684BFD: load_cattr_value (custom-attrs.c:310)
==30309==    by 0x685F85: create_custom_attr (custom-attrs.c:972)
==30309==    by 0x6863FE: create_custom_attr_into_array (custom-attrs.c:1006)
==30309==    by 0x6863FE: mono_custom_attrs_construct_by_type (custom-attrs.c:1516)
==30309==    by 0x689397: mono_reflection_get_custom_attrs_by_type_handle (custom-attrs.c:2208)
==30309==    by 0x5CF4F9: ves_icall_MonoCustomAttrs_GetCustomAttributesInternal (icall.c:8044)
==30309==    by 0x5D669E: ves_icall_MonoCustomAttrs_GetCustomAttributesInternal_raw (icall-def.h:515)
==30309==    by 0xB6EF31D: ???
==30309==
==30309== 4 bytes in 1 blocks are definitely lost in loss record 282 of 60,265
==30309==    at 0x4C2DB8F: malloc (in /usr/lib/valgrind/vgpreload_memcheck-amd64-linux.so)
==30309==    by 0x71A0FD: monoeg_malloc (gmem.c:108)
==30309==    by 0x684E9D: load_cattr_value (custom-attrs.c:334)
==30309==    by 0x68763C: mono_reflection_create_custom_attr_data_args_noalloc (custom-attrs.c:1211)
==30309==    by 0x5F9894: mono_marshal_get_managed_wrapper (marshal.c:3844)
==30309==    by 0x5F9EBF: mono_delegate_handle_to_ftnptr (marshal.c:384)
==30309==    by 0x5FA02C: mono_delegate_to_ftnptr (marshal.c:330)
==30309==    by 0xF3E6011: ???
==30309==    by 0xF3E26B7: ???
==30309==    by 0x42C7A0: mono_jit_runtime_invoke (mini-runtime.c:3189)
==30309==    by 0x620F7F: do_runtime_invoke (object.c:2978)
==30309==    by 0x627A93: mono_runtime_class_init_full (object.c:521)
==30309==
==30309== 10 bytes in 1 blocks are definitely lost in loss record 3,825 of 60,265
==30309==    at 0x4C2DB8F: malloc (in /usr/lib/valgrind/vgpreload_memcheck-amd64-linux.so)
==30309==    by 0x71A0FD: monoeg_malloc (gmem.c:108)
==30309==    by 0x685D38: create_custom_attr (custom-attrs.c:935)
==30309==    by 0x6863FE: create_custom_attr_into_array (custom-attrs.c:1006)
==30309==    by 0x6863FE: mono_custom_attrs_construct_by_type (custom-attrs.c:1516)
==30309==    by 0x689397: mono_reflection_get_custom_attrs_by_type_handle (custom-attrs.c:2208)
==30309==    by 0x5CF4F9: ves_icall_MonoCustomAttrs_GetCustomAttributesInternal (icall.c:8044)
==30309==    by 0x5D669E: ves_icall_MonoCustomAttrs_GetCustomAttributesInternal_raw (icall-def.h:515)
==30309==    by 0xB6EF31D: ???
==30309==
==30309== 12 bytes in 1 blocks are definitely lost in loss record 4,266 of 60,265
==30309==    at 0x4C2DB8F: malloc (in /usr/lib/valgrind/vgpreload_memcheck-amd64-linux.so)
==30309==    by 0x71A0FD: monoeg_malloc (gmem.c:108)
==30309==    by 0x685D38: create_custom_attr (custom-attrs.c:935)
==30309==    by 0x6863FE: create_custom_attr_into_array (custom-attrs.c:1006)
==30309==    by 0x6863FE: mono_custom_attrs_construct_by_type (custom-attrs.c:1516)
==30309==    by 0x689397: mono_reflection_get_custom_attrs_by_type_handle (custom-attrs.c:2208)
==30309==    by 0x5CF4F9: ves_icall_MonoCustomAttrs_GetCustomAttributesInternal (icall.c:8044)
==30309==    by 0x5D669E: ves_icall_MonoCustomAttrs_GetCustomAttributesInternal_raw (icall-def.h:515)
==30309==    by 0xB6EF31D: ???
==30309==    by 0xB6F0C43: ???
==30309==    by 0xFC42873: ???
==30309==    by 0x42C7A0: mono_jit_runtime_invoke (mini-runtime.c:3189)
==30309==    by 0x620F7F: do_runtime_invoke (object.c:2978)
==30309==
==30309== 12 bytes in 1 blocks are definitely lost in loss record 4,267 of 60,265
==30309==    at 0x4C2DB8F: malloc (in /usr/lib/valgrind/vgpreload_memcheck-amd64-linux.so)
==30309==    by 0x71A0FD: monoeg_malloc (gmem.c:108)
==30309==    by 0x685D38: create_custom_attr (custom-attrs.c:935)
==30309==    by 0x6863FE: create_custom_attr_into_array (custom-attrs.c:1006)
==30309==    by 0x6863FE: mono_custom_attrs_construct_by_type (custom-attrs.c:1516)
==30309==    by 0x689397: mono_reflection_get_custom_attrs_by_type_handle (custom-attrs.c:2208)
==30309==    by 0x5CF4F9: ves_icall_MonoCustomAttrs_GetCustomAttributesInternal (icall.c:8044)
==30309==    by 0x5D669E: ves_icall_MonoCustomAttrs_GetCustomAttributesInternal_raw (icall-def.h:515)
==30309==    by 0xB6EF31D: ???
==30309==    by 0xB6F0C43: ???
==30309==    by 0xFC428E3: ???
==30309==    by 0x42C7A0: mono_jit_runtime_invoke (mini-runtime.c:3189)
==30309==    by 0x620F7F: do_runtime_invoke (object.c:2978)
==30309==
==30309== 12 bytes in 1 blocks are definitely lost in loss record 4,268 of 60,265
==30309==    at 0x4C2DB8F: malloc (in /usr/lib/valgrind/vgpreload_memcheck-amd64-linux.so)
==30309==    by 0x71A0FD: monoeg_malloc (gmem.c:108)
==30309==    by 0x685D38: create_custom_attr (custom-attrs.c:935)
==30309==    by 0x6863FE: create_custom_attr_into_array (custom-attrs.c:1006)
==30309==    by 0x6863FE: mono_custom_attrs_construct_by_type (custom-attrs.c:1516)
==30309==    by 0x689397: mono_reflection_get_custom_attrs_by_type_handle (custom-attrs.c:2208)
==30309==    by 0x5CF4F9: ves_icall_MonoCustomAttrs_GetCustomAttributesInternal (icall.c:8044)
==30309==    by 0x5D669E: ves_icall_MonoCustomAttrs_GetCustomAttributesInternal_raw (icall-def.h:515)
==30309==    by 0xB6EF31D: ???
==30309==    by 0xC0AB2CB: ???
==30309==    by 0x64EB337: ???
==30309==    by 0xFFEFFDBDF: ???
==30309==    by 0x64EB337: ???
==30309==
==30309== 12 bytes in 1 blocks are definitely lost in loss record 4,269 of 60,265
==30309==    at 0x4C2DB8F: malloc (in /usr/lib/valgrind/vgpreload_memcheck-amd64-linux.so)
==30309==    by 0x71A0FD: monoeg_malloc (gmem.c:108)
==30309==    by 0x685D38: create_custom_attr (custom-attrs.c:935)
==30309==    by 0x6863FE: create_custom_attr_into_array (custom-attrs.c:1006)
==30309==    by 0x6863FE: mono_custom_attrs_construct_by_type (custom-attrs.c:1516)
==30309==    by 0x689397: mono_reflection_get_custom_attrs_by_type_handle (custom-attrs.c:2208)
==30309==    by 0x5CF4F9: ves_icall_MonoCustomAttrs_GetCustomAttributesInternal (icall.c:8044)
==30309==    by 0x5D669E: ves_icall_MonoCustomAttrs_GetCustomAttributesInternal_raw (icall-def.h:515)
==30309==    by 0xB6EF31D: ???
==30309==    by 0xC0AB2CB: ???
==30309==    by 0x64F072F: ???
==30309==    by 0xFFEFFDBDF: ???
==30309==    by 0x64F072F: ???
==30309==
==30309== 33 bytes in 1 blocks are definitely lost in loss record 38,467 of 60,265
==30309==    at 0x4C2DB8F: malloc (in /usr/lib/valgrind/vgpreload_memcheck-amd64-linux.so)
==30309==    by 0x5A9AA17: __vasprintf_chk (vasprintf_chk.c:80)
==30309==    by 0x71AC89: monoeg_g_strdup_printf (gstr.c:192)
==30309==    by 0x597919: mono_assembly_load_corlib (assembly.c:4147)
==30309==    by 0x59641E: mono_assembly_load_full_gac_base_default (assembly.c:4298)
==30309==    by 0x59641E: mono_assembly_request_byname_nosearch (assembly.c:4274)
==30309==    by 0x59641E: mono_assembly_request_byname (assembly.c:4359)
==30309==    by 0x597AE1: mono_assembly_load (assembly.c:4419)
==30309==    by 0x4928A3: load_image (aot-runtime.c:305)
==30309==    by 0x493648: load_aot_module (aot-runtime.c:2413)
==30309==    by 0x594271: mono_assembly_invoke_load_hook (assembly.c:1751)
==30309==    by 0x594E31: mono_assembly_request_load_from (assembly.c:2897)
==30309==    by 0x597063: mono_assembly_request_open (assembly.c:2372)
==30309==    by 0x5977D6: load_in_path (assembly.c:776)
==30309==
==30309== 37 bytes in 1 blocks are definitely lost in loss record 38,707 of 60,265
==30309==    at 0x4C2DB8F: malloc (in /usr/lib/valgrind/vgpreload_memcheck-amd64-linux.so)
==30309==    by 0x5A9AA17: __vasprintf_chk (vasprintf_chk.c:80)
==30309==    by 0x71AC89: monoeg_g_strdup_printf (gstr.c:192)
==30309==    by 0x5B9CF4: mono_ppdb_load_file (debug-mono-ppdb.c:150)
==30309==    by 0x61AD97: mono_debug_open_image (mono-debug.c:283)
==30309==    by 0x61AECA: mono_debug_add_assembly (mono-debug.c:305)
==30309==    by 0x594271: mono_assembly_invoke_load_hook (assembly.c:1751)
==30309==    by 0x596F23: mono_assembly_request_open (assembly.c:2365)
==30309==    by 0x5977D6: load_in_path (assembly.c:776)
==30309==    by 0x5979E4: mono_assembly_load_corlib (assembly.c:4142)
==30309==    by 0x59641E: mono_assembly_load_full_gac_base_default (assembly.c:4298)
==30309==    by 0x59641E: mono_assembly_request_byname_nosearch (assembly.c:4274)
==30309==    by 0x59641E: mono_assembly_request_byname (assembly.c:4359)
==30309==    by 0x597AE1: mono_assembly_load (assembly.c:4419)
==30309==
==30309== 48 bytes in 4 blocks are definitely lost in loss record 43,336 of 60,265
==30309==    at 0x4C2DB8F: malloc (in /usr/lib/valgrind/vgpreload_memcheck-amd64-linux.so)
==30309==    by 0x71A0FD: monoeg_malloc (gmem.c:108)
==30309==    by 0x685D38: create_custom_attr (custom-attrs.c:935)
==30309==    by 0x6863FE: create_custom_attr_into_array (custom-attrs.c:1006)
==30309==    by 0x6863FE: mono_custom_attrs_construct_by_type (custom-attrs.c:1516)
==30309==    by 0x689397: mono_reflection_get_custom_attrs_by_type_handle (custom-attrs.c:2208)
==30309==    by 0x5CF4F9: ves_icall_MonoCustomAttrs_GetCustomAttributesInternal (icall.c:8044)
==30309==    by 0x5D669E: ves_icall_MonoCustomAttrs_GetCustomAttributesInternal_raw (icall-def.h:515)
==30309==    by 0xB6EF31D: ???
==30309==    by 0xC0AAC63: ???
==30309==
==30309== 68 bytes in 1 blocks are definitely lost in loss record 47,471 of 60,265
==30309==    at 0x4C2DB8F: malloc (in /usr/lib/valgrind/vgpreload_memcheck-amd64-linux.so)
==30309==    by 0x71A0FD: monoeg_malloc (gmem.c:108)
==30309==    by 0x71A147: monoeg_g_memdup (gmem.c:82)
==30309==    by 0x7011E1: mono_dl_open (mono-dl.c:195)
==30309==    by 0x5EAB4F: cached_module_load.constprop.20 (loader.c:1145)
==30309==    by 0x5EC30A: mono_lookup_pinvoke_call (loader.c:1458)
==30309==    by 0x5F8945: mono_marshal_get_native_wrapper (marshal.c:3406)
==30309==    by 0x45709B: mono_method_to_ir (method-to-ir.c:7083)
==30309==    by 0x51E27F: mini_method_compile (mini.c:3488)
==30309==    by 0x51FFB3: mono_jit_compile_method_inner (mini.c:4076)
==30309==    by 0x42A75E: mono_jit_compile_method_with_opt (mini-runtime.c:2450)
==30309==    by 0x4AC824: common_call_trampoline (mini-trampolines.c:751)
==30309==
==30309== 112 bytes in 1 blocks are definitely lost in loss record 53,681 of 60,265
==30309==    at 0x4C2DB8F: malloc (in /usr/lib/valgrind/vgpreload_memcheck-amd64-linux.so)
==30309==    by 0x5A9AA17: __vasprintf_chk (vasprintf_chk.c:80)
==30309==    by 0x71AC89: monoeg_g_strdup_printf (gstr.c:192)
==30309==    by 0x5B9CF4: mono_ppdb_load_file (debug-mono-ppdb.c:150)
==30309==    by 0x61AD97: mono_debug_open_image (mono-debug.c:283)
==30309==    by 0x61AECA: mono_debug_add_assembly (mono-debug.c:305)
==30309==    by 0x594271: mono_assembly_invoke_load_hook (assembly.c:1751)
==30309==    by 0x594E31: mono_assembly_request_load_from (assembly.c:2897)
==30309==    by 0x597063: mono_assembly_request_open (assembly.c:2372)
==30309==    by 0x5968A1: mono_assembly_load_from_gac (assembly.c:4094)
==30309==    by 0x5968A1: mono_assembly_load_full_gac_base_default (assembly.c:4328)
==30309==    by 0x5968A1: mono_assembly_request_byname_nosearch (assembly.c:4274)
==30309==    by 0x5968A1: mono_assembly_request_byname (assembly.c:4359)
==30309==    by 0x5969B5: load_reference_by_aname_default_asmctx (assembly.c:1496)
==30309==    by 0x59863B: mono_assembly_load_reference (assembly.c:1644)
==30309==
==30309== 174 bytes in 2 blocks are definitely lost in loss record 54,596 of 60,265
==30309==    at 0x4C2FD5F: realloc (in /usr/lib/valgrind/vgpreload_memcheck-amd64-linux.so)
==30309==    by 0x5A9A9EC: __vasprintf_chk (vasprintf_chk.c:88)
==30309==    by 0x71AC89: monoeg_g_strdup_printf (gstr.c:192)
==30309==    by 0x5B9CF4: mono_ppdb_load_file (debug-mono-ppdb.c:150)
==30309==    by 0x61AD97: mono_debug_open_image (mono-debug.c:283)
==30309==    by 0x61AECA: mono_debug_add_assembly (mono-debug.c:305)
==30309==    by 0x594271: mono_assembly_invoke_load_hook (assembly.c:1751)
==30309==    by 0x594E31: mono_assembly_request_load_from (assembly.c:2897)
==30309==    by 0x597063: mono_assembly_request_open (assembly.c:2372)
==30309==    by 0x5968A1: mono_assembly_load_from_gac (assembly.c:4094)
==30309==    by 0x5968A1: mono_assembly_load_full_gac_base_default (assembly.c:4328)
==30309==    by 0x5968A1: mono_assembly_request_byname_nosearch (assembly.c:4274)
==30309==    by 0x5968A1: mono_assembly_request_byname (assembly.c:4359)
==30309==    by 0x597AE1: mono_assembly_load (assembly.c:4419)
==30309==    by 0x5C2A8B: type_from_parsed_name (icall.c:1442)
==30309==    by 0x5C2A8B: ves_icall_System_RuntimeTypeHandle_internal_from_name (icall.c:1502)
==30309==
==30309== 288 bytes in 1 blocks are possibly lost in loss record 55,734 of 60,265
==30309==    at 0x4C2FB55: calloc (in /usr/lib/valgrind/vgpreload_memcheck-amd64-linux.so)
==30309==    by 0x40138A4: allocate_dtv (dl-tls.c:322)
==30309==    by 0x40138A4: _dl_allocate_tls (dl-tls.c:539)
==30309==    by 0x555726E: allocate_stack (allocatestack.c:588)
==30309==    by 0x555726E: pthread_create@@GLIBC_2.2.5 (pthread_create.c:539)
==30309==    by 0x711C40: mono_native_thread_create (mono-threads-posix.c:211)
==30309==    by 0x6F7CF6: sgen_thread_pool_start (sgen-thread-pool.c:288)
==30309==    by 0x6CC8D2: sgen_gc_init (sgen-gc.c:3733)
==30309==    by 0x6A82C2: mono_gc_base_init (sgen-mono.c:2923)
==30309==    by 0x58F103: mono_init_internal (domain.c:535)
==30309==    by 0x430342: mini_init (mini-runtime.c:4494)
==30309==    by 0x4750D0: mono_main (driver.c:2445)
==30309==    by 0x42714A: mono_main_with_options (main.c:50)
==30309==    by 0x42714A: main (main.c:406)
==30309==
==30309== 288 bytes in 1 blocks are possibly lost in loss record 55,735 of 60,265
==30309==    at 0x4C2FB55: calloc (in /usr/lib/valgrind/vgpreload_memcheck-amd64-linux.so)
==30309==    by 0x40138A4: allocate_dtv (dl-tls.c:322)
==30309==    by 0x40138A4: _dl_allocate_tls (dl-tls.c:539)
==30309==    by 0x555726E: allocate_stack (allocatestack.c:588)
==30309==    by 0x555726E: pthread_create@@GLIBC_2.2.5 (pthread_create.c:539)
==30309==    by 0x6A788A: mono_gc_pthread_create (sgen-mono.c:2327)
==30309==    by 0x7119C2: mono_thread_platform_create_thread (mono-threads-posix.c:83)
==30309==    by 0x64A2C7: create_thread (threads.c:1311)
==30309==    by 0x64A81F: mono_thread_create_internal (threads.c:1398)
==30309==    by 0x69AD36: mono_gc_init_finalizer_thread (gc.c:959)
==30309==    by 0x69AD36: mono_gc_init (gc.c:1001)
==30309==    by 0x589BAB: mono_runtime_init_checked (appdomain.c:321)
==30309==    by 0x430289: mini_init (mini-runtime.c:4560)
==30309==    by 0x4750D0: mono_main (driver.c:2445)
==30309==    by 0x42714A: mono_main_with_options (main.c:50)
==30309==    by 0x42714A: main (main.c:406)
==30309==
==30309== 288 bytes in 1 blocks are possibly lost in loss record 55,736 of 60,265
==30309==    at 0x4C2FB55: calloc (in /usr/lib/valgrind/vgpreload_memcheck-amd64-linux.so)
==30309==    by 0x40138A4: allocate_dtv (dl-tls.c:322)
==30309==    by 0x40138A4: _dl_allocate_tls (dl-tls.c:539)
==30309==    by 0x555726E: allocate_stack (allocatestack.c:588)
==30309==    by 0x555726E: pthread_create@@GLIBC_2.2.5 (pthread_create.c:539)
==30309==    by 0x6A788A: mono_gc_pthread_create (sgen-mono.c:2327)
==30309==    by 0x7119C2: mono_thread_platform_create_thread (mono-threads-posix.c:83)
==30309==    by 0x64A2C7: create_thread (threads.c:1311)
==30309==    by 0x64A81F: mono_thread_create_internal (threads.c:1398)
==30309==    by 0x6523C2: initialize (threadpool-io.c:585)
==30309==    by 0x6523C2: mono_lazy_initialize (mono-lazy-init.h:77)
==30309==    by 0x6523C2: ves_icall_System_IOSelector_Add (threadpool-io.c:618)
==30309==    by 0x10D7FDDD: ???
==30309==    by 0x6647327: ???
==30309==    by 0x66473DF: ???
==30309==    by 0x64B776F: ???
==30309==
==30309== 288 bytes in 1 blocks are possibly lost in loss record 55,737 of 60,265
==30309==    at 0x4C2FB55: calloc (in /usr/lib/valgrind/vgpreload_memcheck-amd64-linux.so)
==30309==    by 0x40138A4: allocate_dtv (dl-tls.c:322)
==30309==    by 0x40138A4: _dl_allocate_tls (dl-tls.c:539)
==30309==    by 0x555726E: allocate_stack (allocatestack.c:588)
==30309==    by 0x555726E: pthread_create@@GLIBC_2.2.5 (pthread_create.c:539)
==30309==    by 0x6A788A: mono_gc_pthread_create (sgen-mono.c:2327)
==30309==    by 0x7119C2: mono_thread_platform_create_thread (mono-threads-posix.c:83)
==30309==    by 0x64A2C7: create_thread (threads.c:1311)
==30309==    by 0x64A81F: mono_thread_create_internal (threads.c:1398)
==30309==    by 0x6AFA67: monitor_ensure_running (threadpool-worker-default.c:790)
==30309==    by 0x6AFA67: worker_request (threadpool-worker-default.c:597)
==30309==    by 0x6B03C4: mono_threadpool_worker_request (threadpool-worker-default.c:354)
==30309==    by 0x64FE9C: ves_icall_System_Threading_ThreadPool_RequestWorkerThread (threadpool.c:804)
==30309==    by 0x5E3727: ves_icall_System_Threading_ThreadPool_RequestWorkerThread_raw (icall-def.h:1109)
==30309==    by 0x10D81B42: ???
==30309==
==30309== 288 bytes in 1 blocks are possibly lost in loss record 55,738 of 60,265
==30309==    at 0x4C2FB55: calloc (in /usr/lib/valgrind/vgpreload_memcheck-amd64-linux.so)
==30309==    by 0x40138A4: allocate_dtv (dl-tls.c:322)
==30309==    by 0x40138A4: _dl_allocate_tls (dl-tls.c:539)
==30309==    by 0x555726E: allocate_stack (allocatestack.c:588)
==30309==    by 0x555726E: pthread_create@@GLIBC_2.2.5 (pthread_create.c:539)
==30309==    by 0x6A788A: mono_gc_pthread_create (sgen-mono.c:2327)
==30309==    by 0x7119C2: mono_thread_platform_create_thread (mono-threads-posix.c:83)
==30309==    by 0x64A2C7: create_thread (threads.c:1311)
==30309==    by 0x64AB3C: ves_icall_System_Threading_Thread_Thread_internal (threads.c:1624)
==30309==    by 0x5E2F05: ves_icall_System_Threading_Thread_Thread_internal_raw (icall-def.h:1067)
==30309==    by 0x11DCE9B3: ???
==30309==    by 0x42C7A0: mono_jit_runtime_invoke (mini-runtime.c:3189)
==30309==    by 0x620F7F: do_runtime_invoke (object.c:2978)
==30309==    by 0x627A93: mono_runtime_class_init_full (object.c:521)
==30309==
==30309== 864 bytes in 3 blocks are possibly lost in loss record 57,508 of 60,265
==30309==    at 0x4C2FB55: calloc (in /usr/lib/valgrind/vgpreload_memcheck-amd64-linux.so)
==30309==    by 0x40138A4: allocate_dtv (dl-tls.c:322)
==30309==    by 0x40138A4: _dl_allocate_tls (dl-tls.c:539)
==30309==    by 0x555726E: allocate_stack (allocatestack.c:588)
==30309==    by 0x555726E: pthread_create@@GLIBC_2.2.5 (pthread_create.c:539)
==30309==    by 0x6A788A: mono_gc_pthread_create (sgen-mono.c:2327)
==30309==    by 0x7119C2: mono_thread_platform_create_thread (mono-threads-posix.c:83)
==30309==    by 0x64A2C7: create_thread (threads.c:1311)
==30309==    by 0x64AB3C: ves_icall_System_Threading_Thread_Thread_internal (threads.c:1624)
==30309==    by 0x5E2F05: ves_icall_System_Threading_Thread_Thread_internal_raw (icall-def.h:1067)
==30309==    by 0x11DCE9B3: ???
==30309==    by 0xDF234DC: ???
==30309==    by 0xB899CC7: ???
==30309==    by 0xB899F45: ???
==30309==
==30309== 1,102 bytes in 13 blocks are definitely lost in loss record 57,856 of 60,265
==30309==    at 0x4C2FD5F: realloc (in /usr/lib/valgrind/vgpreload_memcheck-amd64-linux.so)
==30309==    by 0x5A9A9EC: __vasprintf_chk (vasprintf_chk.c:88)
==30309==    by 0x71AC89: monoeg_g_strdup_printf (gstr.c:192)
==30309==    by 0x5B9CF4: mono_ppdb_load_file (debug-mono-ppdb.c:150)
==30309==    by 0x61AD97: mono_debug_open_image (mono-debug.c:283)
==30309==    by 0x61AECA: mono_debug_add_assembly (mono-debug.c:305)
==30309==    by 0x594271: mono_assembly_invoke_load_hook (assembly.c:1751)
==30309==    by 0x594E31: mono_assembly_request_load_from (assembly.c:2897)
==30309==    by 0x597063: mono_assembly_request_open (assembly.c:2372)
==30309==    by 0x5968A1: mono_assembly_load_from_gac (assembly.c:4094)
==30309==    by 0x5968A1: mono_assembly_load_full_gac_base_default (assembly.c:4328)
==30309==    by 0x5968A1: mono_assembly_request_byname_nosearch (assembly.c:4274)
==30309==    by 0x5968A1: mono_assembly_request_byname (assembly.c:4359)
==30309==    by 0x5969B5: load_reference_by_aname_default_asmctx (assembly.c:1496)
==30309==    by 0x59863B: mono_assembly_load_reference (assembly.c:1644)
==30309==
==30309== 2,016 bytes in 7 blocks are possibly lost in loss record 58,398 of 60,265
==30309==    at 0x4C2FB55: calloc (in /usr/lib/valgrind/vgpreload_memcheck-amd64-linux.so)
==30309==    by 0x40138A4: allocate_dtv (dl-tls.c:322)
==30309==    by 0x40138A4: _dl_allocate_tls (dl-tls.c:539)
==30309==    by 0x555726E: allocate_stack (allocatestack.c:588)
==30309==    by 0x555726E: pthread_create@@GLIBC_2.2.5 (pthread_create.c:539)
==30309==    by 0x6A788A: mono_gc_pthread_create (sgen-mono.c:2327)
==30309==    by 0x7119C2: mono_thread_platform_create_thread (mono-threads-posix.c:83)
==30309==    by 0x64A2C7: create_thread (threads.c:1311)
==30309==    by 0x64A81F: mono_thread_create_internal (threads.c:1398)
==30309==    by 0x6AF5D1: worker_try_create (threadpool-worker-default.c:561)
==30309==    by 0x6AFA95: worker_request (threadpool-worker-default.c:605)
==30309==    by 0x6B03C4: mono_threadpool_worker_request (threadpool-worker-default.c:354)
==30309==    by 0x64FE9C: ves_icall_System_Threading_ThreadPool_RequestWorkerThread (threadpool.c:804)
==30309==    by 0x5E3727: ves_icall_System_Threading_ThreadPool_RequestWorkerThread_raw (icall-def.h:1109)
==30309==
==30309== 4,104 bytes in 1 blocks are possibly lost in loss record 58,738 of 60,265
==30309==    at 0x4C2DB8F: malloc (in /usr/lib/valgrind/vgpreload_memcheck-amd64-linux.so)
==30309==    by 0xF43C136: sqlite3MemMalloc (in /usr/lib/x86_64-linux-gnu/libsqlite3.so.0.8.6)
==30309==    by 0xF41795B: sqlite3Malloc (in /usr/lib/x86_64-linux-gnu/libsqlite3.so.0.8.6)
==30309==    by 0xF41AEA6: pcache1Alloc (in /usr/lib/x86_64-linux-gnu/libsqlite3.so.0.8.6)
==30309==    by 0xF43A6F2: sqlite3BtreeCursor (in /usr/lib/x86_64-linux-gnu/libsqlite3.so.0.8.6)
==30309==    by 0xF473A02: sqlite3VdbeExec (in /usr/lib/x86_64-linux-gnu/libsqlite3.so.0.8.6)
==30309==    by 0xF47D1A6: sqlite3_step (in /usr/lib/x86_64-linux-gnu/libsqlite3.so.0.8.6)
==30309==    by 0xFC052F4: ???
==30309==    by 0x66D0F8F: ???
==30309==    by 0x752F: ???
==30309==    by 0x66D12E7: ???
==30309==    by 0x66CAFEF: ???
==30309==
==30309== 4,104 bytes in 1 blocks are possibly lost in loss record 58,739 of 60,265
==30309==    at 0x4C2DB8F: malloc (in /usr/lib/valgrind/vgpreload_memcheck-amd64-linux.so)
==30309==    by 0xF43C136: sqlite3MemMalloc (in /usr/lib/x86_64-linux-gnu/libsqlite3.so.0.8.6)
==30309==    by 0xF41795B: sqlite3Malloc (in /usr/lib/x86_64-linux-gnu/libsqlite3.so.0.8.6)
==30309==    by 0xF41AEA6: pcache1Alloc (in /usr/lib/x86_64-linux-gnu/libsqlite3.so.0.8.6)
==30309==    by 0xF43A6F2: sqlite3BtreeCursor (in /usr/lib/x86_64-linux-gnu/libsqlite3.so.0.8.6)
==30309==    by 0xF473A02: sqlite3VdbeExec (in /usr/lib/x86_64-linux-gnu/libsqlite3.so.0.8.6)
==30309==    by 0xF47D1A6: sqlite3_step (in /usr/lib/x86_64-linux-gnu/libsqlite3.so.0.8.6)
==30309==    by 0xFC052F4: ???
==30309==    by 0x6502D27: ???
==30309==    by 0x752F: ???
==30309==    by 0x65031CF: ???
==30309==    by 0x1041BEAF: ???
==30309==
==30309== LEAK SUMMARY:
==30309==    definitely lost: 1,637 bytes in 30 blocks
==30309==    indirectly lost: 0 bytes in 0 blocks
==30309==      possibly lost: 12,528 bytes in 17 blocks
==30309==    still reachable: 37,283,886 bytes in 259,079 blocks
==30309==                       of which reachable via heuristic:
==30309==                         length64           : 1,431,688 bytes in 1,628 blocks
==30309==         suppressed: 0 bytes in 0 blocks
==30309== Reachable blocks (those to which a pointer was found) are not shown.
==30309== To see them, rerun with: --leak-check=full --show-leak-kinds=all
==30309==
==30309== Use --track-origins=yes to see where uninitialised values come from
==30309== ERROR SUMMARY: 1010 errors from 50 contexts (suppressed: 0 from 0)
==30309==
==30309== 1 errors in context 1 of 50:
==30309== Thread 14 Thread Pool Wor:
==30309== Invalid write of size 8
==30309==    at 0x70A7EE: mono_sigctx_to_monoctx (mono-context.c:212)
==30309==    by 0x5123A0: mono_arch_handle_altstack_exception (exceptions-amd64.c:908)
==30309==    by 0x42D483: mono_sigsegv_signal_handler_debug (mini-runtime.c:3546)
==30309==    by 0x556038F: ??? (in /lib/x86_64-linux-gnu/libpthread-2.23.so)
==30309==    by 0x868C117: System_Threading_Thread_SerializePrincipal_System_Threading_Thread_System_Security_Principal_IPrincipal (Thread.cs:202)
==30309==    by 0x868C870: System_Threading_Thread_set_CurrentPrincipal_System_Security_Principal_IPrincipal (Thread.cs:278)
==30309==    by 0x1332D9FA: ???
==30309==  Address 0x12f13e28 is on thread 14's stack
==30309==
==30309==
==30309== 1 errors in context 2 of 50:
==30309== Invalid write of size 8
==30309==    at 0x70A7E7: mono_sigctx_to_monoctx (mono-context.c:212)
==30309==    by 0x5123A0: mono_arch_handle_altstack_exception (exceptions-amd64.c:908)
==30309==    by 0x42D483: mono_sigsegv_signal_handler_debug (mini-runtime.c:3546)
==30309==    by 0x556038F: ??? (in /lib/x86_64-linux-gnu/libpthread-2.23.so)
==30309==    by 0x868C117: System_Threading_Thread_SerializePrincipal_System_Threading_Thread_System_Security_Principal_IPrincipal (Thread.cs:202)
==30309==    by 0x868C870: System_Threading_Thread_set_CurrentPrincipal_System_Security_Principal_IPrincipal (Thread.cs:278)
==30309==    by 0x1332D9FA: ???
==30309==  Address 0x12f13e30 is on thread 14's stack
==30309==
==30309==
==30309== 1 errors in context 3 of 50:
==30309== Invalid write of size 8
==30309==    at 0x70A7CB: mono_sigctx_to_monoctx (mono-context.c:211)
==30309==    by 0x5123A0: mono_arch_handle_altstack_exception (exceptions-amd64.c:908)
==30309==    by 0x42D483: mono_sigsegv_signal_handler_debug (mini-runtime.c:3546)
==30309==    by 0x556038F: ??? (in /lib/x86_64-linux-gnu/libpthread-2.23.so)
==30309==    by 0x868C117: System_Threading_Thread_SerializePrincipal_System_Threading_Thread_System_Security_Principal_IPrincipal (Thread.cs:202)
==30309==    by 0x868C870: System_Threading_Thread_set_CurrentPrincipal_System_Security_Principal_IPrincipal (Thread.cs:278)
==30309==    by 0x1332D9FA: ???
==30309==  Address 0x12f13e18 is on thread 14's stack
==30309==
==30309==
==30309== 1 errors in context 4 of 50:
==30309== Invalid write of size 8
==30309==    at 0x70A7C4: mono_sigctx_to_monoctx (mono-context.c:211)
==30309==    by 0x5123A0: mono_arch_handle_altstack_exception (exceptions-amd64.c:908)
==30309==    by 0x42D483: mono_sigsegv_signal_handler_debug (mini-runtime.c:3546)
==30309==    by 0x556038F: ??? (in /lib/x86_64-linux-gnu/libpthread-2.23.so)
==30309==    by 0x868C117: System_Threading_Thread_SerializePrincipal_System_Threading_Thread_System_Security_Principal_IPrincipal (Thread.cs:202)
==30309==    by 0x868C870: System_Threading_Thread_set_CurrentPrincipal_System_Security_Principal_IPrincipal (Thread.cs:278)
==30309==    by 0x1332D9FA: ???
==30309==  Address 0x12f13e20 is on thread 14's stack
==30309==
==30309==
==30309== 1 errors in context 5 of 50:
==30309== Invalid write of size 8
==30309==    at 0x70A7A8: mono_sigctx_to_monoctx (mono-context.c:210)
==30309==    by 0x5123A0: mono_arch_handle_altstack_exception (exceptions-amd64.c:908)
==30309==    by 0x42D483: mono_sigsegv_signal_handler_debug (mini-runtime.c:3546)
==30309==    by 0x556038F: ??? (in /lib/x86_64-linux-gnu/libpthread-2.23.so)
==30309==    by 0x868C117: System_Threading_Thread_SerializePrincipal_System_Threading_Thread_System_Security_Principal_IPrincipal (Thread.cs:202)
==30309==    by 0x868C870: System_Threading_Thread_set_CurrentPrincipal_System_Security_Principal_IPrincipal (Thread.cs:278)
==30309==    by 0x1332D9FA: ???
==30309==  Address 0x12f13e08 is on thread 14's stack
==30309==
==30309==
==30309== 1 errors in context 6 of 50:
==30309== Invalid write of size 8
==30309==    at 0x70A7A1: mono_sigctx_to_monoctx (mono-context.c:210)
==30309==    by 0x5123A0: mono_arch_handle_altstack_exception (exceptions-amd64.c:908)
==30309==    by 0x42D483: mono_sigsegv_signal_handler_debug (mini-runtime.c:3546)
==30309==    by 0x556038F: ??? (in /lib/x86_64-linux-gnu/libpthread-2.23.so)
==30309==    by 0x868C117: System_Threading_Thread_SerializePrincipal_System_Threading_Thread_System_Security_Principal_IPrincipal (Thread.cs:202)
==30309==    by 0x868C870: System_Threading_Thread_set_CurrentPrincipal_System_Security_Principal_IPrincipal (Thread.cs:278)
==30309==    by 0x1332D9FA: ???
==30309==  Address 0x12f13e10 is on thread 14's stack
==30309==
==30309==
==30309== 1 errors in context 7 of 50:
==30309== Invalid write of size 8
==30309==    at 0x70A785: mono_sigctx_to_monoctx (mono-context.c:209)
==30309==    by 0x5123A0: mono_arch_handle_altstack_exception (exceptions-amd64.c:908)
==30309==    by 0x42D483: mono_sigsegv_signal_handler_debug (mini-runtime.c:3546)
==30309==    by 0x556038F: ??? (in /lib/x86_64-linux-gnu/libpthread-2.23.so)
==30309==    by 0x868C117: System_Threading_Thread_SerializePrincipal_System_Threading_Thread_System_Security_Principal_IPrincipal (Thread.cs:202)
==30309==    by 0x868C870: System_Threading_Thread_set_CurrentPrincipal_System_Security_Principal_IPrincipal (Thread.cs:278)
==30309==    by 0x1332D9FA: ???
==30309==  Address 0x12f13df8 is on thread 14's stack
==30309==
==30309==
==30309== 1 errors in context 8 of 50:
==30309== Invalid write of size 8
==30309==    at 0x70A77E: mono_sigctx_to_monoctx (mono-context.c:209)
==30309==    by 0x5123A0: mono_arch_handle_altstack_exception (exceptions-amd64.c:908)
==30309==    by 0x42D483: mono_sigsegv_signal_handler_debug (mini-runtime.c:3546)
==30309==    by 0x556038F: ??? (in /lib/x86_64-linux-gnu/libpthread-2.23.so)
==30309==    by 0x868C117: System_Threading_Thread_SerializePrincipal_System_Threading_Thread_System_Security_Principal_IPrincipal (Thread.cs:202)
==30309==    by 0x868C870: System_Threading_Thread_set_CurrentPrincipal_System_Security_Principal_IPrincipal (Thread.cs:278)
==30309==    by 0x1332D9FA: ???
==30309==  Address 0x12f13e00 is on thread 14's stack
==30309==
==30309==
==30309== 1 errors in context 9 of 50:
==30309== Invalid write of size 8
==30309==    at 0x70A762: mono_sigctx_to_monoctx (mono-context.c:208)
==30309==    by 0x5123A0: mono_arch_handle_altstack_exception (exceptions-amd64.c:908)
==30309==    by 0x42D483: mono_sigsegv_signal_handler_debug (mini-runtime.c:3546)
==30309==    by 0x556038F: ??? (in /lib/x86_64-linux-gnu/libpthread-2.23.so)
==30309==    by 0x868C117: System_Threading_Thread_SerializePrincipal_System_Threading_Thread_System_Security_Principal_IPrincipal (Thread.cs:202)
==30309==    by 0x868C870: System_Threading_Thread_set_CurrentPrincipal_System_Security_Principal_IPrincipal (Thread.cs:278)
==30309==    by 0x1332D9FA: ???
==30309==  Address 0x12f13de8 is on thread 14's stack
==30309==
==30309==
==30309== 1 errors in context 10 of 50:
==30309== Invalid write of size 8
==30309==    at 0x70A75B: mono_sigctx_to_monoctx (mono-context.c:208)
==30309==    by 0x5123A0: mono_arch_handle_altstack_exception (exceptions-amd64.c:908)
==30309==    by 0x42D483: mono_sigsegv_signal_handler_debug (mini-runtime.c:3546)
==30309==    by 0x556038F: ??? (in /lib/x86_64-linux-gnu/libpthread-2.23.so)
==30309==    by 0x868C117: System_Threading_Thread_SerializePrincipal_System_Threading_Thread_System_Security_Principal_IPrincipal (Thread.cs:202)
==30309==    by 0x868C870: System_Threading_Thread_set_CurrentPrincipal_System_Security_Principal_IPrincipal (Thread.cs:278)
==30309==    by 0x1332D9FA: ???
==30309==  Address 0x12f13df0 is on thread 14's stack
==30309==
==30309==
==30309== 1 errors in context 11 of 50:
==30309== Invalid write of size 8
==30309==    at 0x70A73F: mono_sigctx_to_monoctx (mono-context.c:207)
==30309==    by 0x5123A0: mono_arch_handle_altstack_exception (exceptions-amd64.c:908)
==30309==    by 0x42D483: mono_sigsegv_signal_handler_debug (mini-runtime.c:3546)
==30309==    by 0x556038F: ??? (in /lib/x86_64-linux-gnu/libpthread-2.23.so)
==30309==    by 0x868C117: System_Threading_Thread_SerializePrincipal_System_Threading_Thread_System_Security_Principal_IPrincipal (Thread.cs:202)
==30309==    by 0x868C870: System_Threading_Thread_set_CurrentPrincipal_System_Security_Principal_IPrincipal (Thread.cs:278)
==30309==    by 0x1332D9FA: ???
==30309==  Address 0x12f13dd8 is on thread 14's stack
==30309==
==30309==
==30309== 1 errors in context 12 of 50:
==30309== Invalid write of size 8
==30309==    at 0x70A738: mono_sigctx_to_monoctx (mono-context.c:207)
==30309==    by 0x5123A0: mono_arch_handle_altstack_exception (exceptions-amd64.c:908)
==30309==    by 0x42D483: mono_sigsegv_signal_handler_debug (mini-runtime.c:3546)
==30309==    by 0x556038F: ??? (in /lib/x86_64-linux-gnu/libpthread-2.23.so)
==30309==    by 0x868C117: System_Threading_Thread_SerializePrincipal_System_Threading_Thread_System_Security_Principal_IPrincipal (Thread.cs:202)
==30309==    by 0x868C870: System_Threading_Thread_set_CurrentPrincipal_System_Security_Principal_IPrincipal (Thread.cs:278)
==30309==    by 0x1332D9FA: ???
==30309==  Address 0x12f13de0 is on thread 14's stack
==30309==
==30309==
==30309== 1 errors in context 13 of 50:
==30309== Invalid write of size 8
==30309==    at 0x70A71C: mono_sigctx_to_monoctx (mono-context.c:206)
==30309==    by 0x5123A0: mono_arch_handle_altstack_exception (exceptions-amd64.c:908)
==30309==    by 0x42D483: mono_sigsegv_signal_handler_debug (mini-runtime.c:3546)
==30309==    by 0x556038F: ??? (in /lib/x86_64-linux-gnu/libpthread-2.23.so)
==30309==    by 0x868C117: System_Threading_Thread_SerializePrincipal_System_Threading_Thread_System_Security_Principal_IPrincipal (Thread.cs:202)
==30309==    by 0x868C870: System_Threading_Thread_set_CurrentPrincipal_System_Security_Principal_IPrincipal (Thread.cs:278)
==30309==    by 0x1332D9FA: ???
==30309==  Address 0x12f13dc8 is on thread 14's stack
==30309==
==30309==
==30309== 1 errors in context 14 of 50:
==30309== Invalid write of size 8
==30309==    at 0x70A715: mono_sigctx_to_monoctx (mono-context.c:206)
==30309==    by 0x5123A0: mono_arch_handle_altstack_exception (exceptions-amd64.c:908)
==30309==    by 0x42D483: mono_sigsegv_signal_handler_debug (mini-runtime.c:3546)
==30309==    by 0x556038F: ??? (in /lib/x86_64-linux-gnu/libpthread-2.23.so)
==30309==    by 0x868C117: System_Threading_Thread_SerializePrincipal_System_Threading_Thread_System_Security_Principal_IPrincipal (Thread.cs:202)
==30309==    by 0x868C870: System_Threading_Thread_set_CurrentPrincipal_System_Security_Principal_IPrincipal (Thread.cs:278)
==30309==    by 0x1332D9FA: ???
==30309==  Address 0x12f13dd0 is on thread 14's stack
==30309==
==30309==
==30309== 1 errors in context 15 of 50:
==30309== Invalid write of size 8
==30309==    at 0x70A6F9: mono_sigctx_to_monoctx (mono-context.c:205)
==30309==    by 0x5123A0: mono_arch_handle_altstack_exception (exceptions-amd64.c:908)
==30309==    by 0x42D483: mono_sigsegv_signal_handler_debug (mini-runtime.c:3546)
==30309==    by 0x556038F: ??? (in /lib/x86_64-linux-gnu/libpthread-2.23.so)
==30309==    by 0x868C117: System_Threading_Thread_SerializePrincipal_System_Threading_Thread_System_Security_Principal_IPrincipal (Thread.cs:202)
==30309==    by 0x868C870: System_Threading_Thread_set_CurrentPrincipal_System_Security_Principal_IPrincipal (Thread.cs:278)
==30309==    by 0x1332D9FA: ???
==30309==  Address 0x12f13db8 is on thread 14's stack
==30309==
==30309==
==30309== 1 errors in context 16 of 50:
==30309== Invalid write of size 8
==30309==    at 0x70A6F2: mono_sigctx_to_monoctx (mono-context.c:205)
==30309==    by 0x5123A0: mono_arch_handle_altstack_exception (exceptions-amd64.c:908)
==30309==    by 0x42D483: mono_sigsegv_signal_handler_debug (mini-runtime.c:3546)
==30309==    by 0x556038F: ??? (in /lib/x86_64-linux-gnu/libpthread-2.23.so)
==30309==    by 0x868C117: System_Threading_Thread_SerializePrincipal_System_Threading_Thread_System_Security_Principal_IPrincipal (Thread.cs:202)
==30309==    by 0x868C870: System_Threading_Thread_set_CurrentPrincipal_System_Security_Principal_IPrincipal (Thread.cs:278)
==30309==    by 0x1332D9FA: ???
==30309==  Address 0x12f13dc0 is on thread 14's stack
==30309==
==30309==
==30309== 1 errors in context 17 of 50:
==30309== Invalid read of size 8
==30309==    at 0x868C118: System_Threading_Thread_SerializePrincipal_System_Threading_Thread_System_Security_Principal_IPrincipal (Thread.cs:203)
==30309==    by 0x868C870: System_Threading_Thread_set_CurrentPrincipal_System_Security_Principal_IPrincipal (Thread.cs:278)
==30309==    by 0x1332D9FA: ???
==30309==  Address 0x0 is not stack'd, malloc'd or (recently) free'd
==30309==
==30309==
==30309== 4 errors in context 18 of 50:
==30309== Thread 1:
==30309== Conditional jump or move depends on uninitialised value(s)
==30309==    at 0x5A71A2: mono_class_setup_vtable_general (class-init.c:2956)
==30309==    by 0x5A88E0: mono_class_setup_vtable_full (class-init.c:2540)
==30309==    by 0x5EA504: get_method_constrained.isra.13 (loader.c:1901)
==30309==    by 0x457167: mono_method_to_ir (method-to-ir.c:7024)
==30309==    by 0x51E27F: mini_method_compile (mini.c:3488)
==30309==    by 0x51FFB3: mono_jit_compile_method_inner (mini.c:4076)
==30309==    by 0x42A75E: mono_jit_compile_method_with_opt (mini-runtime.c:2450)
==30309==    by 0x4AC824: common_call_trampoline (mini-trampolines.c:751)
==30309==    by 0x4AD1C2: mono_magic_trampoline (mini-trampolines.c:891)
==30309==    by 0x41D1386: ???
==30309==    by 0x10521E5A: ???
==30309==    by 0x10521C42: ???
==30309==
==30309==
==30309== 15 errors in context 19 of 50:
==30309== Conditional jump or move depends on uninitialised value(s)
==30309==    at 0x5A71A2: mono_class_setup_vtable_general (class-init.c:2956)
==30309==    by 0x5A88E0: mono_class_setup_vtable_full (class-init.c:2540)
==30309==    by 0x45DDFB: mono_method_to_ir (method-to-ir.c:7288)
==30309==    by 0x51E27F: mini_method_compile (mini.c:3488)
==30309==    by 0x51FFB3: mono_jit_compile_method_inner (mini.c:4076)
==30309==    by 0x42A75E: mono_jit_compile_method_with_opt (mini-runtime.c:2450)
==30309==    by 0x4AC824: common_call_trampoline (mini-trampolines.c:751)
==30309==    by 0x4AD1C2: mono_magic_trampoline (mini-trampolines.c:891)
==30309==    by 0x41D1386: ???
==30309==    by 0xC068B23: ???
==30309==    by 0xBC9CA4B: ???
==30309==    by 0xBC9C8E3: ???
==30309==
==30309==
==30309== 53 errors in context 20 of 50:
==30309== Conditional jump or move depends on uninitialised value(s)
==30309==    at 0x5BFAFB: mono_icall_get_machine_name (icall.c:6741)
==30309==    by 0x5D4EA7: ves_icall_System_Environment_get_MachineName (icall.c:6762)
==30309==    by 0x5D4EA7: ves_icall_System_Environment_get_MachineName_raw (icall-def.h:318)
==30309==    by 0x106D53F2: ???
==30309==    by 0x42C7A0: mono_jit_runtime_invoke (mini-runtime.c:3189)
==30309==    by 0x620F7F: do_runtime_invoke (object.c:2978)
==30309==    by 0x627A93: mono_runtime_class_init_full (object.c:521)
==30309==    by 0x459D93: mono_method_to_ir (method-to-ir.c:9321)
==30309==    by 0x51E27F: mini_method_compile (mini.c:3488)
==30309==    by 0x51FFB3: mono_jit_compile_method_inner (mini.c:4076)
==30309==    by 0x42A75E: mono_jit_compile_method_with_opt (mini-runtime.c:2450)
==30309==    by 0x4AC824: common_call_trampoline (mini-trampolines.c:751)
==30309==    by 0x4AD1C2: mono_magic_trampoline (mini-trampolines.c:891)
==30309==
==30309==
==30309== 57 errors in context 21 of 50:
==30309== Conditional jump or move depends on uninitialised value(s)
==30309==    at 0x5A71A2: mono_class_setup_vtable_general (class-init.c:2956)
==30309==    by 0x5A88E0: mono_class_setup_vtable_full (class-init.c:2540)
==30309==    by 0x5EA407: get_method_constrained.isra.13 (loader.c:1907)
==30309==    by 0x457167: mono_method_to_ir (method-to-ir.c:7024)
==30309==    by 0x51E27F: mini_method_compile (mini.c:3488)
==30309==    by 0x51FFB3: mono_jit_compile_method_inner (mini.c:4076)
==30309==    by 0x42A75E: mono_jit_compile_method_with_opt (mini-runtime.c:2450)
==30309==    by 0x4AC824: common_call_trampoline (mini-trampolines.c:751)
==30309==    by 0x4AD1C2: mono_magic_trampoline (mini-trampolines.c:891)
==30309==    by 0x41D1386: ???
==30309==    by 0x420F527: ???
==30309==    by 0x420F4A3: ???
==30309==
==30309==
==30309== 67 errors in context 22 of 50:
==30309== Conditional jump or move depends on uninitialised value(s)
==30309==    at 0x578F2B: mono_w32process_module_get_information (w32process-unix.c:1355)
==30309==    by 0x634574: process_add_module (w32process.c:495)
==30309==    by 0x634574: ves_icall_System_Diagnostics_Process_GetModules_internal (w32process.c:595)
==30309==    by 0xDF18676: ???
==30309==    by 0xDF183F7: ???
==30309==    by 0xDF18313: ???
==30309==    by 0xDF1691F: ???
==30309==    by 0xDF164D7: ???
==30309==    by 0xB899CC7: ???
==30309==    by 0xB899F45: ???
==30309==    by 0x42C7A0: mono_jit_runtime_invoke (mini-runtime.c:3189)
==30309==    by 0x620F7F: do_runtime_invoke (object.c:2978)
==30309==    by 0x6239DA: do_exec_main_checked (object.c:5029)
==30309==
==30309==
==30309== 67 errors in context 23 of 50:
==30309== Conditional jump or move depends on uninitialised value(s)
==30309==    at 0x578F23: mono_w32process_module_get_information (w32process-unix.c:1353)
==30309==    by 0x634574: process_add_module (w32process.c:495)
==30309==    by 0x634574: ves_icall_System_Diagnostics_Process_GetModules_internal (w32process.c:595)
==30309==    by 0xDF18676: ???
==30309==    by 0xDF183F7: ???
==30309==    by 0xDF18313: ???
==30309==    by 0xDF1691F: ???
==30309==    by 0xDF164D7: ???
==30309==    by 0xB899CC7: ???
==30309==    by 0xB899F45: ???
==30309==    by 0x42C7A0: mono_jit_runtime_invoke (mini-runtime.c:3189)
==30309==    by 0x620F7F: do_runtime_invoke (object.c:2978)
==30309==    by 0x6239DA: do_exec_main_checked (object.c:5029)
==30309==
==30309==
==30309== 67 errors in context 24 of 50:
==30309== Conditional jump or move depends on uninitialised value(s)
==30309==    at 0x578B3D: mono_w32process_module_get_name (w32process-unix.c:1243)
==30309==    by 0x63446F: ves_icall_System_Diagnostics_Process_GetModules_internal (w32process.c:592)
==30309==    by 0xDF18676: ???
==30309==    by 0xDF183F7: ???
==30309==    by 0xDF18313: ???
==30309==    by 0xDF1691F: ???
==30309==    by 0xDF164D7: ???
==30309==    by 0xB899CC7: ???
==30309==    by 0xB899F45: ???
==30309==    by 0x42C7A0: mono_jit_runtime_invoke (mini-runtime.c:3189)
==30309==    by 0x620F7F: do_runtime_invoke (object.c:2978)
==30309==    by 0x6239DA: do_exec_main_checked (object.c:5029)
==30309==
==30309==
==30309== 67 errors in context 25 of 50:
==30309== Conditional jump or move depends on uninitialised value(s)
==30309==    at 0x578B34: mono_w32process_module_get_name (w32process-unix.c:1241)
==30309==    by 0x63446F: ves_icall_System_Diagnostics_Process_GetModules_internal (w32process.c:592)
==30309==    by 0xDF18676: ???
==30309==    by 0xDF183F7: ???
==30309==    by 0xDF18313: ???
==30309==    by 0xDF1691F: ???
==30309==    by 0xDF164D7: ???
==30309==    by 0xB899CC7: ???
==30309==    by 0xB899F45: ???
==30309==    by 0x42C7A0: mono_jit_runtime_invoke (mini-runtime.c:3189)
==30309==    by 0x620F7F: do_runtime_invoke (object.c:2978)
==30309==    by 0x6239DA: do_exec_main_checked (object.c:5029)
==30309==
==30309==
==30309== 254 errors in context 26 of 50:
==30309== Conditional jump or move depends on uninitialised value(s)
==30309==    at 0x5A71A2: mono_class_setup_vtable_general (class-init.c:2956)
==30309==    by 0x5A88E0: mono_class_setup_vtable_full (class-init.c:2540)
==30309==    by 0x5C86B5: mono_class_get_methods_by_name (icall.c:4035)
==30309==    by 0x5DF415: ves_icall_RuntimeType_GetMethodsByName_native_raw (icall-def.h:883)
==30309==    by 0xBCA1AC6: ???
==30309==    by 0x861BED1: System_RuntimeType_GetMethodCandidates_string_int_System_Reflection_BindingFlags_System_Reflection_CallingConventions_System_Type___bool (RtType.cs:64)
==30309==    by 0x861BBCF: System_RuntimeType_GetMethodImplCommon_string_int_System_Reflection_BindingFlags_System_Reflection_Binder_System_Reflection_CallingConventions_System_Type___System_Reflection_ParameterModifier__ (RtType.cs:27)
==30309==    by 0x861BAD7: System_RuntimeType_GetMethodImpl_string_System_Reflection_BindingFlags_System_Reflection_Binder_System_Reflection_CallingConventions_System_Type___System_Reflection_ParameterModifier__ (RtType.cs:13)
==30309==    by 0x85D55E2: System_Type_GetMethod_string_System_Reflection_BindingFlags (Type.cs:174)
==30309==    by 0xD94D4CA: ???
==30309==    by 0x650D5BF: ???
==30309==    by 0x9029BFF: ???
==30309==
==30309==
==30309== 319 errors in context 27 of 50:
==30309== Conditional jump or move depends on uninitialised value(s)
==30309==    at 0x5A71A2: mono_class_setup_vtable_general (class-init.c:2956)
==30309==    by 0x5A88E0: mono_class_setup_vtable_full (class-init.c:2540)
==30309==    by 0x5A7146: mono_class_setup_vtable_general (class-init.c:2935)
==30309==    by 0x5A88E0: mono_class_setup_vtable_full (class-init.c:2540)
==30309==    by 0x62731F: mono_class_create_runtime_vtable (object.c:2010)
==30309==    by 0x62731F: mono_class_vtable_checked (object.c:1899)
==30309==    by 0x42945A: mono_resolve_patch_target (mini-runtime.c:1488)
==30309==    by 0x49BA4D: init_method (aot-runtime.c:4515)
==30309==    by 0x49C083: load_method.part.20 (aot-runtime.c:4184)
==30309==    by 0x49CD1F: load_method (aot-runtime.c:4091)
==30309==    by 0x49CD1F: mono_aot_get_method (aot-runtime.c:4922)
==30309==    by 0x42A43E: mono_jit_compile_method_with_opt (mini-runtime.c:2389)
==30309==    by 0x4AC824: common_call_trampoline (mini-trampolines.c:751)
==30309==    by 0x4AD1C2: mono_magic_trampoline (mini-trampolines.c:891)
==30309==
==30309== ERROR SUMMARY: 1010 errors from 50 contexts (suppressed: 0 from 0)
@Taloth I managed to get Radarr running under valgrind. However, I couldn't get valgrind to detect a memory leak or unusually high memory usage :(
What could this mean?
This is the log:
==14405== Memcheck, a memory error detector
==14405== Copyright (C) 2002-2015, and GNU GPL'd, by Julian Seward et al.
==14405== Using Valgrind-3.11.0 and LibVEX; rerun with -h for copyright info
==14405== Command: mono --debug Radarr.exe
==14405== Parent PID: 2587
==14405==
--14405--
--14405-- Valgrind options:
--14405--    --tool=memcheck
--14405--    -v
--14405--    --leak-check=full
--14405--    --log-file=log.txt
--14405--    --smc-check=all
--14405--    --vgdb=yes
--14405--    --vgdb-error=0
--14405-- Contents of /proc/version:
--14405--   Linux version 4.4.0-92-generic (buildd@lcy01-17) (gcc version 5.4.0 20160609 (Ubuntu 5.4.0-6ubuntu1~16.04.4) ) #115-Ubuntu SMP Thu Aug 10 09:04:33 UTC 2017
--14405--
--14405-- Arch and hwcaps: AMD64, LittleEndian, amd64-cx16-rdtscp-sse3-avx
--14405-- Page sizes: currently 4096, max supported 4096
--14405-- Valgrind library directory: /usr/lib/valgrind
--14405-- Reading syms from /root/mono/bin/mono-sgen
--14405-- Reading syms from /lib/x86_64-linux-gnu/ld-2.23.so
--14405--   Considering /lib/x86_64-linux-gnu/ld-2.23.so ..
--14405--   .. CRC mismatch (computed aa979a42 wanted 9019bbb7)
--14405--   Considering /usr/lib/debug/lib/x86_64-linux-gnu/ld-2.23.so ..
--14405--   .. CRC is valid
--14405-- Reading syms from /usr/lib/valgrind/memcheck-amd64-linux
--14405--   Considering /usr/lib/valgrind/memcheck-amd64-linux ..
--14405--   .. CRC mismatch (computed eea41ea9 wanted 2009db78)
--14405--    object doesn't have a symbol table
--14405--    object doesn't have a dynamic symbol table
--14405-- Scheduler: using generic scheduler lock implementation.
--14405-- Reading suppressions file: /usr/lib/valgrind/default.supp
==14405== (action at startup) vgdb me ...
==14405== embedded gdbserver: reading from /tmp/vgdb-pipe-from-vgdb-to-14405-by-root-on-???
==14405== embedded gdbserver: writing to   /tmp/vgdb-pipe-to-vgdb-from-14405-by-root-on-???
==14405== embedded gdbserver: shared mem   /tmp/vgdb-pipe-shared-mem-vgdb-14405-by-root-on-???
==14405==
==14405== TO CONTROL THIS PROCESS USING vgdb (which you probably
==14405== don't want to do, unless you know exactly what you're doing,
==14405== or are doing some strange experiment):
==14405==   /usr/lib/valgrind/../../bin/vgdb --pid=14405 ...command...
==14405==
==14405== TO DEBUG THIS PROCESS USING GDB: start GDB like this
==14405==   /path/to/gdb mono
==14405== and then give GDB the following command
==14405==   target remote | /usr/lib/valgrind/../../bin/vgdb --pid=14405
==14405== --pid is optional if only one valgrind process is running
==14405==
--14405-- REDIR: 0x401cfd0 (ld-linux-x86-64.so.2:strlen) redirected to 0x3809e181 (???)
--14405-- Reading syms from /usr/lib/valgrind/vgpreload_core-amd64-linux.so
--14405--   Considering /usr/lib/valgrind/vgpreload_core-amd64-linux.so ..
--14405--   .. CRC mismatch (computed 2567ccf6 wanted 49420590)
--14405--    object doesn't have a symbol table
--14405-- Reading syms from /usr/lib/valgrind/vgpreload_memcheck-amd64-linux.so
--14405--   Considering /usr/lib/valgrind/vgpreload_memcheck-amd64-linux.so ..
--14405--   .. CRC mismatch (computed 0e27c9a8 wanted ac585421)
--14405--    object doesn't have a symbol table
==14405== WARNING: new redirection conflicts with existing -- ignoring it
--14405--     old: 0x0401cfd0 (strlen              ) R-> (0000.0) 0x3809e181 ???
--14405--     new: 0x0401cfd0 (strlen              ) R-> (2007.0) 0x04c31020 strlen
--14405-- REDIR: 0x401b920 (ld-linux-x86-64.so.2:index) redirected to 0x4c30bc0 (index)
--14405-- REDIR: 0x401bb40 (ld-linux-x86-64.so.2:strcmp) redirected to 0x4c320d0 (strcmp)
--14405-- REDIR: 0x401dd30 (ld-linux-x86-64.so.2:mempcpy) redirected to 0x4c35270 (mempcpy)
--14405-- Reading syms from /lib/x86_64-linux-gnu/libm-2.23.so
--14405--   Considering /lib/x86_64-linux-gnu/libm-2.23.so ..
--14405--   .. CRC mismatch (computed e8c3647b wanted c3efddac)
--14405--   Considering /usr/lib/debug/lib/x86_64-linux-gnu/libm-2.23.so ..
--14405--   .. CRC is valid
--14405-- Reading syms from /lib/x86_64-linux-gnu/librt-2.23.so
--14405--   Considering /lib/x86_64-linux-gnu/librt-2.23.so ..
--14405--   .. CRC mismatch (computed 734d0439 wanted 09d6393c)
--14405--   Considering /usr/lib/debug/lib/x86_64-linux-gnu/librt-2.23.so ..
--14405--   .. CRC is valid
--14405-- Reading syms from /lib/x86_64-linux-gnu/libdl-2.23.so
--14405--   Considering /lib/x86_64-linux-gnu/libdl-2.23.so ..
--14405--   .. CRC mismatch (computed 39227170 wanted ab6e2c22)
--14405--   Considering /usr/lib/debug/lib/x86_64-linux-gnu/libdl-2.23.so ..
--14405--   .. CRC is valid
--14405-- Reading syms from /lib/x86_64-linux-gnu/libpthread-2.23.so
--14405--   Considering /usr/lib/debug/.build-id/ce/17e023542265fc11d9bc8f534bb4f070493d30.debug ..
--14405--   .. build-id is valid
--14405-- Reading syms from /lib/x86_64-linux-gnu/libgcc_s.so.1
--14405--   Considering /lib/x86_64-linux-gnu/libgcc_s.so.1 ..
--14405--   .. CRC mismatch (computed b9a68419 wanted 29d51b00)
--14405--    object doesn't have a symbol table
--14405-- Reading syms from /lib/x86_64-linux-gnu/libc-2.23.so
--14405--   Considering /lib/x86_64-linux-gnu/libc-2.23.so ..
--14405--   .. CRC mismatch (computed 7a8ee3e4 wanted a5190ac4)
--14405--   Considering /usr/lib/debug/lib/x86_64-linux-gnu/libc-2.23.so ..
--14405--   .. CRC is valid
--14405-- REDIR: 0x5a11a00 (libc.so.6:strcasecmp) redirected to 0x4a286f0 (_vgnU_ifunc_wrapper)
--14405-- REDIR: 0x5a0d280 (libc.so.6:strcspn) redirected to 0x4a286f0 (_vgnU_ifunc_wrapper)
--14405-- REDIR: 0x5a13cf0 (libc.so.6:strncasecmp) redirected to 0x4a286f0 (_vgnU_ifunc_wrapper)
--14405-- REDIR: 0x5a0f6f0 (libc.so.6:strpbrk) redirected to 0x4a286f0 (_vgnU_ifunc_wrapper)
--14405-- REDIR: 0x5a0fa80 (libc.so.6:strspn) redirected to 0x4a286f0 (_vgnU_ifunc_wrapper)
--14405-- REDIR: 0x5a1114b (libc.so.6:memcpy@GLIBC_2.2.5) redirected to 0x4a286f0 (_vgnU_ifunc_wrapper)
--14405-- REDIR: 0x5a0bcd0 (libc.so.6:strcmp) redirected to 0x4a286f0 (_vgnU_ifunc_wrapper)
--14405-- REDIR: 0x5a0f400 (libc.so.6:rindex) redirected to 0x4c308a0 (rindex)
--14405-- REDIR: 0x5a0d720 (libc.so.6:strlen) redirected to 0x4c30f60 (strlen)
--14405-- REDIR: 0x5a0db70 (libc.so.6:__GI_strncmp) redirected to 0x4c31710 (__GI_strncmp)
--14405-- REDIR: 0x5a0db20 (libc.so.6:strncmp) redirected to 0x4a286f0 (_vgnU_ifunc_wrapper)
--14405-- REDIR: 0x5ac7a90 (libc.so.6:__strncmp_sse42) redirected to 0x4c317f0 (__strncmp_sse42)
--14405-- REDIR: 0x5a06130 (libc.so.6:malloc) redirected to 0x4c2db20 (malloc)
--14405-- REDIR: 0x5a0f3c0 (libc.so.6:strncpy) redirected to 0x4a286f0 (_vgnU_ifunc_wrapper)
--14405-- REDIR: 0x5a28000 (libc.so.6:__strncpy_sse2_unaligned) redirected to 0x4c31570 (__strncpy_sse2_unaligned)
--14405-- REDIR: 0x5a21570 (libc.so.6:__strcmp_sse2_unaligned) redirected to 0x4c31f90 (strcmp)
--14405-- REDIR: 0x5a066c0 (libc.so.6:realloc) redirected to 0x4c2fce0 (realloc)
--14405-- REDIR: 0x5a163f0 (libc.so.6:memcpy@@GLIBC_2.14) redirected to 0x4a286f0 (_vgnU_ifunc_wrapper)
--14405-- REDIR: 0x5a21820 (libc.so.6:__memcpy_sse2_unaligned) redirected to 0x4c324a0 (memcpy@@GLIBC_2.14)
--14405-- REDIR: 0x5a10ff0 (libc.so.6:__GI_memmove) redirected to 0x4c347e0 (__GI_memmove)
--14405-- REDIR: 0x5a18760 (libc.so.6:strchrnul) redirected to 0x4c34da0 (strchrnul)
--14405-- REDIR: 0x5a16470 (libc.so.6:__GI_memcpy) redirected to 0x4c32b00 (__GI_memcpy)
--14405-- REDIR: 0x5a064f0 (libc.so.6:free) redirected to 0x4c2ed80 (free)
--14405-- REDIR: 0x5a10bb0 (libc.so.6:bcmp) redirected to 0x4a286f0 (_vgnU_ifunc_wrapper)
--14405-- REDIR: 0x5af0430 (libc.so.6:__memcmp_sse4_1) redirected to 0x4c33cd0 (__memcmp_sse4_1)
--14405-- REDIR: 0x5a0bd10 (libc.so.6:__GI_strcmp) redirected to 0x4c31fe0 (__GI_strcmp)
--14405-- REDIR: 0x5a0bab0 (libc.so.6:__GI_strchr) redirected to 0x4c30a00 (__GI_strchr)
--14405-- REDIR: 0x5a10860 (libc.so.6:memchr) redirected to 0x4c32170 (memchr)
--14405-- REDIR: 0x5a113b0 (libc.so.6:__GI_mempcpy) redirected to 0x4c34fa0 (__GI_mempcpy)
--14405-- REDIR: 0x5a06d10 (libc.so.6:calloc) redirected to 0x4c2faa0 (calloc)
--14405-- REDIR: 0x5a10630 (libc.so.6:strstr) redirected to 0x4a286f0 (_vgnU_ifunc_wrapper)
--14405-- REDIR: 0x5a2c070 (libc.so.6:__strstr_sse2_unaligned) redirected to 0x4c35460 (strstr)
--14405-- REDIR: 0x5a0d160 (libc.so.6:strcpy) redirected to 0x4a286f0 (_vgnU_ifunc_wrapper)
--14405-- REDIR: 0x5a279d0 (libc.so.6:__strcpy_sse2_unaligned) redirected to 0x4c31040 (strcpy)
--14405-- REDIR: 0x5a0b880 (libc.so.6:strcat) redirected to 0x4a286f0 (_vgnU_ifunc_wrapper)
--14405-- REDIR: 0x5a2a7f0 (libc.so.6:__strcat_sse2_unaligned) redirected to 0x4c30c00 (strcat)
--14405-- REDIR: 0x5a0ba80 (libc.so.6:index) redirected to 0x4a286f0 (_vgnU_ifunc_wrapper)
--14405-- REDIR: 0x5a11330 (libc.so.6:mempcpy) redirected to 0x4a286f0 (_vgnU_ifunc_wrapper)
--14405-- REDIR: 0x5add990 (libc.so.6:__mempcpy_ssse3_back) redirected to 0x4c34eb0 (mempcpy)
--14405-- REDIR: 0x5a10060 (libc.so.6:__GI_strstr) redirected to 0x4c354d0 (__strstr_sse2)
--14405-- REDIR: 0x5a18550 (libc.so.6:rawmemchr) redirected to 0x4c34dd0 (rawmemchr)
--14405-- REDIR: 0x5a111b0 (libc.so.6:memset) redirected to 0x4a286f0 (_vgnU_ifunc_wrapper)
--14405-- REDIR: 0x5a11240 (libc.so.6:__GI_memset) redirected to 0x4c344c0 (memset)
--14405-- Reading syms from /root/mono/lib/mono/4.5/mscorlib.dll.so
--14405-- REDIR: 0x401de80 (ld-linux-x86-64.so.2:stpcpy) redirected to 0x4c342c0 (stpcpy)
--14405-- REDIR: 0x5a11890 (libc.so.6:__GI_stpcpy) redirected to 0x4c33f80 (__GI_stpcpy)
--14405-- REDIR: 0x5a11a70 (libc.so.6:__GI___strcasecmp_l) redirected to 0x4c31c00 (__GI___strcasecmp_l)
--14405-- REDIR: 0x5ae0460 (libc.so.6:__memmove_ssse3_back) redirected to 0x4c32230 (memcpy@GLIBC_2.2.5)
--14405-- REDIR: 0x5acc980 (libc.so.6:__strcasecmp_avx) redirected to 0x4c31860 (strcasecmp)
--14405-- Reading syms from /home/leo/Radarr/_output_mono/Radarr.exe.so
--14405-- Discarding syms at 0x92a1450-0x92a17f0 in /home/leo/Radarr/_output_mono/Radarr.exe.so due to munmap()
--14405-- Reading syms from /home/leo/Radarr/_output_mono/Radarr.exe.so
--14405-- Discarding syms at 0x92a1450-0x92a17f0 in /home/leo/Radarr/_output_mono/Radarr.exe.so due to munmap()
--14405-- Reading syms from /home/leo/Radarr/_output_mono/NLog.dll.so
--14405-- Reading syms from /home/leo/Radarr/_output_mono/NzbDrone.Common.dll.so
--14405-- Reading syms from /home/leo/Radarr/_output_mono/ICSharpCode.SharpZipLib.dll.so
--14405-- Reading syms from /home/leo/Radarr/_output_mono/Newtonsoft.Json.dll.so
--14405-- Reading syms from /home/leo/Radarr/_output_mono/LogentriesNLog.dll.so
--14405-- Reading syms from /home/leo/Radarr/_output_mono/LogentriesCore.dll.so
--14405-- Reading syms from /home/leo/Radarr/_output_mono/SocksWebProxy.dll.so
--14405-- Reading syms from /home/leo/Radarr/_output_mono/Org.Mentalis.dll.so
--14405-- Reading syms from /home/leo/Radarr/_output_mono/CurlSharp.dll.so
--14405-- Reading syms from /home/leo/Radarr/_output_mono/Radarr.Host.dll.so
--14405-- Reading syms from /home/leo/Radarr/_output_mono/NzbDrone.Core.dll.so
--14405-- Reading syms from /home/leo/Radarr/_output_mono/FluentValidation.dll.so
--14405-- Reading syms from /home/leo/Radarr/_output_mono/RestSharp.dll.so
--14405-- Reading syms from /home/leo/Radarr/_output_mono/Marr.Data.dll.so
--14405-- Reading syms from /home/leo/Radarr/_output_mono/Prowlin.dll.so
--14405-- Reading syms from /home/leo/Radarr/_output_mono/Growl.Connector.dll.so
--14405-- Reading syms from /home/leo/Radarr/_output_mono/Growl.CoreLibrary.dll.so
--14405-- Reading syms from /home/leo/Radarr/_output_mono/System.Data.SQLite.dll.so
--14405-- Reading syms from /home/leo/Radarr/_output_mono/ImageResizer.dll.so
--14405-- Reading syms from /home/leo/Radarr/_output_mono/MonoTorrent.dll.so
--14405-- Reading syms from /home/leo/Radarr/_output_mono/CookComputing.XmlRpcV2.dll.so
--14405-- Reading syms from /home/leo/Radarr/_output_mono/FluentMigrator.dll.so
--14405-- Reading syms from /home/leo/Radarr/_output_mono/FluentMigrator.Runner.dll.so
--14405-- Reading syms from /home/leo/Radarr/_output_mono/OAuth.dll.so
--14405-- Reading syms from /home/leo/Radarr/_output_mono/Microsoft.Owin.Hosting.dll.so
--14405-- Reading syms from /home/leo/Radarr/_output_mono/Owin.dll.so
--14405-- Reading syms from /home/leo/Radarr/_output_mono/Microsoft.Owin.dll.so
--14405-- Reading syms from /home/leo/Radarr/_output_mono/Nancy.dll.so
--14405-- Reading syms from /home/leo/Radarr/_output_mono/Microsoft.AspNet.SignalR.Core.dll.so
--14405-- Reading syms from /home/leo/Radarr/_output_mono/Interop.NetFwTypeLib.dll.so
--14405-- Reading syms from /home/leo/Radarr/_output_mono/Nancy.Owin.dll.so
--14405-- Reading syms from /home/leo/Radarr/_output_mono/NzbDrone.SignalR.dll.so
--14405-- Reading syms from /home/leo/Radarr/_output_mono/Microsoft.AspNet.SignalR.Owin.dll.so
--14405-- REDIR: 0x5a98210 (libc.so.6:__memcpy_chk) redirected to 0x4a286f0 (_vgnU_ifunc_wrapper)
--14405-- REDIR: 0x5adaeb0 (libc.so.6:__memcpy_chk_ssse3_back) redirected to 0x4c35360 (__memcpy_chk)
==14405== Conditional jump or move depends on uninitialised value(s)
==14405==    at 0x5A71A2: mono_class_setup_vtable_general (class-init.c:2956)
==14405==    by 0x5A88E0: mono_class_setup_vtable_full (class-init.c:2540)
==14405==    by 0x5A7146: mono_class_setup_vtable_general (class-init.c:2935)
==14405==    by 0x5A88E0: mono_class_setup_vtable_full (class-init.c:2540)
==14405==    by 0x62731F: mono_class_create_runtime_vtable (object.c:2010)
==14405==    by 0x62731F: mono_class_vtable_checked (object.c:1899)
==14405==    by 0x42945A: mono_resolve_patch_target (mini-runtime.c:1488)
==14405==    by 0x49BA4D: init_method (aot-runtime.c:4515)
==14405==    by 0x49C083: load_method.part.20 (aot-runtime.c:4184)
==14405==    by 0x49CD1F: load_method (aot-runtime.c:4091)
==14405==    by 0x49CD1F: mono_aot_get_method (aot-runtime.c:4922)
==14405==    by 0x42A43E: mono_jit_compile_method_with_opt (mini-runtime.c:2389)
==14405==    by 0x4AC824: common_call_trampoline (mini-trampolines.c:751)
==14405==    by 0x4AD1C2: mono_magic_trampoline (mini-trampolines.c:891)
==14405==
==14405== (action on error) vgdb me ...
==14405== Continuing ...
--14405-- memcheck GC: 1000 nodes, 6 survivors (0.6%)
--14405-- memcheck GC: 1000 nodes, 6 survivors (0.6%)
--14405-- memcheck GC: 1000 nodes, 6 survivors (0.6%)
--14405-- memcheck GC: 1000 nodes, 10 survivors (1.0%)
==14405== Conditional jump or move depends on uninitialised value(s)
==14405==    at 0x5A71A2: mono_class_setup_vtable_general (class-init.c:2956)
==14405==    by 0x5A88E0: mono_class_setup_vtable_full (class-init.c:2540)
==14405==    by 0x45DDFB: mono_method_to_ir (method-to-ir.c:7288)
==14405==    by 0x51E27F: mini_method_compile (mini.c:3488)
==14405==    by 0x51FFB3: mono_jit_compile_method_inner (mini.c:4076)
==14405==    by 0x42A75E: mono_jit_compile_method_with_opt (mini-runtime.c:2450)
==14405==    by 0x4AC824: common_call_trampoline (mini-trampolines.c:751)
==14405==    by 0x4AD1C2: mono_magic_trampoline (mini-trampolines.c:891)
==14405==    by 0x41D1386: ???
==14405==    by 0x93CD55A: NLog_Config_ConfigurationItemFactory_GetNLogExtensionFiles_string (in /home/leo/Radarr/_output_mono/NLog.dll.so)
==14405==    by 0x93CCACC: NLog_Config_ConfigurationItemFactory_BuildDefaultFactory (in /home/leo/Radarr/_output_mono/NLog.dll.so)
==14405==    by 0x93CBA42: NLog_Config_ConfigurationItemFactory_get_Default (in /home/leo/Radarr/_output_mono/NLog.dll.so)
==14405==
==14405== (action on error) vgdb me ...
==14405== Continuing ...
--14405-- memcheck GC: 1000 nodes, 31 survivors (3.1%)
--14405-- memcheck GC: 1000 nodes, 7 survivors (0.7%)
--14405-- Reading syms from /root/mono/lib/libmono-native.so.0.0.0
--14405-- memcheck GC: 1000 nodes, 5 survivors (0.5%)
--14405-- Reading syms from /home/leo/Radarr/_output_mono/NzbDrone.Api.dll.so
--14405-- Reading syms from /home/leo/Radarr/_output_mono/Ical.Net.dll.so
--14405-- Reading syms from /home/leo/Radarr/_output_mono/Ical.Net.Collections.dll.so
--14405-- Reading syms from /home/leo/Radarr/_output_mono/NodaTime.dll.so
--14405-- Reading syms from /home/leo/Radarr/_output_mono/antlr.runtime.dll.so
--14405-- Reading syms from /home/leo/Radarr/_output_mono/Nancy.Authentication.Basic.dll.so
--14405-- Reading syms from /home/leo/Radarr/_output_mono/Nancy.Authentication.Forms.dll.so
--14405-- Reading syms from /home/leo/Radarr/_output_mono/NzbDrone.Mono.dll.so
==14405== Conditional jump or move depends on uninitialised value(s)
==14405==    at 0x5A71A2: mono_class_setup_vtable_general (class-init.c:2956)
==14405==    by 0x5A88E0: mono_class_setup_vtable_full (class-init.c:2540)
==14405==    by 0x5C86B5: mono_class_get_methods_by_name (icall.c:4035)
==14405==    by 0x5DF415: ves_icall_RuntimeType_GetMethodsByName_native_raw (icall-def.h:883)
==14405==    by 0x11B0B026: ???
==14405==    by 0x861BED1: System_RuntimeType_GetMethodCandidates_string_int_System_Reflection_BindingFlags_System_Reflection_CallingConventions_System_Type___bool (RtType.cs:64)
==14405==    by 0x861BBCF: System_RuntimeType_GetMethodImplCommon_string_int_System_Reflection_BindingFlags_System_Reflection_Binder_System_Reflection_CallingConventions_System_Type___System_Reflection_ParameterModifier__ (RtType.cs:27)
==14405==    by 0x861BAD7: System_RuntimeType_GetMethodImpl_string_System_Reflection_BindingFlags_System_Reflection_Binder_System_Reflection_CallingConventions_System_Type___System_Reflection_ParameterModifier__ (RtType.cs:13)
==14405==    by 0x85D55E2: System_Type_GetMethod_string_System_Reflection_BindingFlags (Type.cs:174)
==14405==    by 0x11CF7BEA: ???
==14405==
==14405== (action on error) vgdb me ...
==14405== Continuing ...
--14405-- memcheck GC: 1000 nodes, 27 survivors (2.7%)
==14405== Conditional jump or move depends on uninitialised value(s)
==14405==    at 0x5A71A2: mono_class_setup_vtable_general (class-init.c:2956)
==14405==    by 0x5A88E0: mono_class_setup_vtable_full (class-init.c:2540)
==14405==    by 0x5EA407: get_method_constrained.isra.13 (loader.c:1907)
==14405==    by 0x457167: mono_method_to_ir (method-to-ir.c:7024)
==14405==    by 0x51E27F: mini_method_compile (mini.c:3488)
==14405==    by 0x51FFB3: mono_jit_compile_method_inner (mini.c:4076)
==14405==    by 0x42A75E: mono_jit_compile_method_with_opt (mini-runtime.c:2450)
==14405==    by 0x4AC824: common_call_trampoline (mini-trampolines.c:751)
==14405==    by 0x4AD4B6: mono_vcall_trampoline (mini-trampolines.c:974)
==14405==    by 0x41D2506: ???
==14405==    by 0x140FFB24: ???
==14405==    by 0x650E25F: ???
==14405==
==14405== (action on error) vgdb me ...
==14405== Continuing ...
--14405-- memcheck GC: 1000 nodes, 5 survivors (0.5%)
==14405== Conditional jump or move depends on uninitialised value(s)
==14405==    at 0x578B34: mono_w32process_module_get_name (w32process-unix.c:1241)
==14405==    by 0x63446F: ves_icall_System_Diagnostics_Process_GetModules_internal (w32process.c:592)
==14405==    by 0x141182D6: ???
==14405==    by 0x14118057: ???
==14405==    by 0x14117F73: ???
==14405==    by 0xA778B8C: NzbDrone_Common_Processes_ProcessProvider_GetCurrentProcess (in /home/leo/Radarr/_output_mono/NzbDrone.Common.dll.so)
==14405==    by 0xBBA500F: Radarr_Host_SingleInstancePolicy_GetOtherNzbDroneProcessIds (in /home/leo/Radarr/_output_mono/Radarr.Host.dll.so)
==14405==    by 0xBBA4FA4: Radarr_Host_SingleInstancePolicy_IsAlreadyRunning (in /home/leo/Radarr/_output_mono/Radarr.Host.dll.so)
==14405==    by 0xBBA4D94: Radarr_Host_SingleInstancePolicy_PreventStartIfAlreadyRunning (in /home/leo/Radarr/_output_mono/Radarr.Host.dll.so)
==14405==    by 0xBBA3D49: Radarr_Host_Bootstrap_EnsureSingleInstance_bool_NzbDrone_Common_EnvironmentInfo_IStartupContext (in /home/leo/Radarr/_output_mono/Radarr.Host.dll.so)
==14405==    by 0xBBA3B99: Radarr_Host_Bootstrap_Start_Radarr_Host_ApplicationModes_NzbDrone_Common_EnvironmentInfo_StartupContext (in /home/leo/Radarr/_output_mono/Radarr.Host.dll.so)
==14405==    by 0xBBA3A08: Radarr_Host_Bootstrap_Start_NzbDrone_Common_EnvironmentInfo_StartupContext_Radarr_Host_IUserAlert_System_Action_1_NzbDrone_Common_Composition_IContainer (in /home/leo/Radarr/_output_mono/Radarr.Host.dll.so)
==14405==
==14405== (action on error) vgdb me ...
==14405== Continuing ...
==14405== Conditional jump or move depends on uninitialised value(s)
==14405==    at 0x578F23: mono_w32process_module_get_information (w32process-unix.c:1353)
==14405==    by 0x634574: process_add_module (w32process.c:495)
==14405==    by 0x634574: ves_icall_System_Diagnostics_Process_GetModules_internal (w32process.c:595)
==14405==    by 0x141182D6: ???
==14405==    by 0x14118057: ???
==14405==    by 0x14117F73: ???
==14405==    by 0xA778B8C: NzbDrone_Common_Processes_ProcessProvider_GetCurrentProcess (in /home/leo/Radarr/_output_mono/NzbDrone.Common.dll.so)
==14405==    by 0xBBA500F: Radarr_Host_SingleInstancePolicy_GetOtherNzbDroneProcessIds (in /home/leo/Radarr/_output_mono/Radarr.Host.dll.so)
==14405==    by 0xBBA4FA4: Radarr_Host_SingleInstancePolicy_IsAlreadyRunning (in /home/leo/Radarr/_output_mono/Radarr.Host.dll.so)
==14405==    by 0xBBA4D94: Radarr_Host_SingleInstancePolicy_PreventStartIfAlreadyRunning (in /home/leo/Radarr/_output_mono/Radarr.Host.dll.so)
==14405==    by 0xBBA3D49: Radarr_Host_Bootstrap_EnsureSingleInstance_bool_NzbDrone_Common_EnvironmentInfo_IStartupContext (in /home/leo/Radarr/_output_mono/Radarr.Host.dll.so)
==14405==    by 0xBBA3B99: Radarr_Host_Bootstrap_Start_Radarr_Host_ApplicationModes_NzbDrone_Common_EnvironmentInfo_StartupContext (in /home/leo/Radarr/_output_mono/Radarr.Host.dll.so)
==14405==    by 0xBBA3A08: Radarr_Host_Bootstrap_Start_NzbDrone_Common_EnvironmentInfo_StartupContext_Radarr_Host_IUserAlert_System_Action_1_NzbDrone_Common_Composition_IContainer (in /home/leo/Radarr/_output_mono/Radarr.Host.dll.so)
==14405==
==14405== (action on error) vgdb me ...
==14405== Continuing ...
--14405-- memcheck GC: 1000 nodes, 6 survivors (0.6%)
--14405-- memcheck GC: 1000 nodes, 6 survivors (0.6%)
--14405-- Reading syms from /usr/lib/x86_64-linux-gnu/libsqlite3.so.0.8.6
--14405--   Considering /usr/lib/debug/.build-id/d9/782ba023caec26b15d8676e3a5d07b55e121ef.debug ..
--14405--   .. build-id is valid
--14405-- WARNING: Serious error when reading debug info
--14405-- When reading debug info from /usr/lib/x86_64-linux-gnu/libsqlite3.so.0.8.6:
--14405-- Ignoring non-Dwarf2/3/4 block in .debug_info
--14405-- WARNING: Serious error when reading debug info
--14405-- When reading debug info from /usr/lib/x86_64-linux-gnu/libsqlite3.so.0.8.6:
--14405-- Last block truncated in .debug_info; ignoring
--14405-- WARNING: Serious error when reading debug info
--14405-- When reading debug info from /usr/lib/x86_64-linux-gnu/libsqlite3.so.0.8.6:
--14405-- parse_CU_Header: is neither DWARF2 nor DWARF3 nor DWARF4
--14405-- memcheck GC: 1000 nodes, 5 survivors (0.5%)
--14405-- memcheck GC: 1000 nodes, 6 survivors (0.6%)
--14405-- memcheck GC: 1000 nodes, 14 survivors (1.4%)
--14405-- Reading syms from /home/leo/Radarr/_output_mono/Microsoft.Owin.Host.HttpListener.dll.so
--14405-- memcheck GC: 1000 nodes, 5 survivors (0.5%)
--14405-- memcheck GC: 1000 nodes, 5 survivors (0.5%)
==14405== Conditional jump or move depends on uninitialised value(s)
==14405==    at 0x5A71A2: mono_class_setup_vtable_general (class-init.c:2956)
==14405==    by 0x5A88E0: mono_class_setup_vtable_full (class-init.c:2540)
==14405==    by 0x5EA504: get_method_constrained.isra.13 (loader.c:1901)
==14405==    by 0x457167: mono_method_to_ir (method-to-ir.c:7024)
==14405==    by 0x51E27F: mini_method_compile (mini.c:3488)
==14405==    by 0x51FFB3: mono_jit_compile_method_inner (mini.c:4076)
==14405==    by 0x42A75E: mono_jit_compile_method_with_opt (mini-runtime.c:2450)
==14405==    by 0x4AC824: common_call_trampoline (mini-trampolines.c:751)
==14405==    by 0x4AD1C2: mono_magic_trampoline (mini-trampolines.c:891)
==14405==    by 0x41D1386: ???
==14405==    by 0x17065FAA: ???
==14405==    by 0x17065D92: ???
==14405==
==14405== (action on error) vgdb me ...
==14405== Continuing ...
--14405-- memcheck GC: 1000 nodes, 14 survivors (1.4%)
--14405-- memcheck GC: 1000 nodes, 6 survivors (0.6%)
--14405-- memcheck GC: 1000 nodes, 8 survivors (0.8%)
--14405-- memcheck GC: 1000 nodes, 7 survivors (0.7%)
--14405-- memcheck GC: 1000 nodes, 5 survivors (0.5%)
--14405-- memcheck GC: 1000 nodes, 7 survivors (0.7%)
==14405== Conditional jump or move depends on uninitialised value(s)
==14405==    at 0x5BFAFB: mono_icall_get_machine_name (icall.c:6741)
==14405==    by 0x5D4EA7: ves_icall_System_Environment_get_MachineName (icall.c:6762)
==14405==    by 0x5D4EA7: ves_icall_System_Environment_get_MachineName_raw (icall-def.h:318)
==14405==    by 0x170DA782: ???
==14405==    by 0x42C7A0: mono_jit_runtime_invoke (mini-runtime.c:3189)
==14405==    by 0x620F7F: do_runtime_invoke (object.c:2978)
==14405==    by 0x627A93: mono_runtime_class_init_full (object.c:521)
==14405==    by 0x4299E6: mono_resolve_patch_target (mini-runtime.c:1520)
==14405==    by 0x49BA4D: init_method (aot-runtime.c:4515)
==14405==    by 0x49C083: load_method.part.20 (aot-runtime.c:4184)
==14405==    by 0x49D7F4: load_method (aot-runtime.c:4091)
==14405==    by 0x49D7F4: mono_aot_get_method_from_token (aot-runtime.c:4951)
==14405==    by 0x4AD2A4: mono_aot_trampoline (mini-trampolines.c:1057)
==14405==    by 0x41D1B06: ???
==14405==
==14405== (action on error) vgdb me ...
==14405== Continuing ...
--14405-- memcheck GC: 1000 nodes, 8 survivors (0.8%)
--14405-- Reading syms from /lib/x86_64-linux-gnu/libnss_files-2.23.so
--14405--   Considering /lib/x86_64-linux-gnu/libnss_files-2.23.so ..
--14405--   .. CRC mismatch (computed bbddf769 wanted cc29886c)
--14405--   Considering /usr/lib/debug/lib/x86_64-linux-gnu/libnss_files-2.23.so ..
--14405--   .. CRC is valid
--14405-- REDIR: 0x5a0d1a0 (libc.so.6:__GI_strcpy) redirected to 0x4c31110 (__GI_strcpy)
--14405-- memcheck GC: 1000 nodes, 8 survivors (0.8%)
--14405-- memcheck GC: 1000 nodes, 26 survivors (2.6%)
--14405-- memcheck GC: 1000 nodes, 7 survivors (0.7%)
--14405-- memcheck GC: 1000 nodes, 9 survivors (0.9%)
--14405-- memcheck GC: 1000 nodes, 8 survivors (0.8%)
--14405-- memcheck GC: 1000 nodes, 10 survivors (1.0%)
--14405-- memcheck GC: 1000 nodes, 8 survivors (0.8%)
--14405-- Reading syms from /root/mono/lib/libMonoPosixHelper.so
--14405-- Reading syms from /lib/x86_64-linux-gnu/libz.so.1.2.8
--14405--    object doesn't have a symbol table
--14405-- memcheck GC: 1000 nodes, 8 survivors (0.8%)
==14405== Thread 3 Finalizer:
==14405== Conditional jump or move depends on uninitialised value(s)
==14405==    at 0x5A71A2: mono_class_setup_vtable_general (class-init.c:2956)
==14405==    by 0x5A88E0: mono_class_setup_vtable_full (class-init.c:2540)
==14405==    by 0x59EA07: mono_class_get_finalizer (class.c:4001)
==14405==    by 0x698DF4: mono_gc_run_finalize (gc.c:274)
==14405==    by 0x6CAD52: sgen_gc_invoke_finalizers (sgen-gc.c:2765)
==14405==    by 0x6996F0: mono_runtime_do_background_work (gc.c:883)
==14405==    by 0x6996F0: finalizer_thread (gc.c:926)
==14405==    by 0x64C7D0: start_wrapper_internal (threads.c:1174)
==14405==    by 0x64C7D0: start_wrapper (threads.c:1234)
==14405==    by 0x55566B9: start_thread (pthread_create.c:333)
==14405==    by 0x5A8941C: clone (clone.S:109)
==14405==
==14405== (action on error) vgdb me ...
==14405== Continuing ...
--14405-- Reading syms from /lib/x86_64-linux-gnu/libnss_compat-2.23.so
--14405--   Considering /lib/x86_64-linux-gnu/libnss_compat-2.23.so ..
--14405--   .. CRC mismatch (computed 45e1d383 wanted 584dcc9d)
--14405--   Considering /usr/lib/debug/lib/x86_64-linux-gnu/libnss_compat-2.23.so ..
--14405--   .. CRC is valid
--14405-- Reading syms from /lib/x86_64-linux-gnu/libnsl-2.23.so
--14405--   Considering /lib/x86_64-linux-gnu/libnsl-2.23.so ..
--14405--   .. CRC mismatch (computed 824f4d52 wanted 959e8ba1)
--14405--   Considering /usr/lib/debug/lib/x86_64-linux-gnu/libnsl-2.23.so ..
--14405--   .. CRC is valid
--14405-- Reading syms from /lib/x86_64-linux-gnu/libnss_nis-2.23.so
--14405--   Considering /lib/x86_64-linux-gnu/libnss_nis-2.23.so ..
--14405--   .. CRC mismatch (computed 97375782 wanted 3001fa61)
--14405--   Considering /usr/lib/debug/lib/x86_64-linux-gnu/libnss_nis-2.23.so ..
--14405--   .. CRC is valid
--14405-- memcheck GC: 1000 nodes, 22 survivors (2.2%)
--14405-- memcheck GC: 1000 nodes, 21 survivors (2.1%)
--14405-- memcheck GC: 1000 nodes, 19 survivors (1.9%)
--14405-- memcheck GC: 1000 nodes, 55 survivors (5.5%)
--14405-- REDIR: 0x5acdff0 (libc.so.6:__strncasecmp_avx) redirected to 0x4c31940 (strncasecmp)
--14405-- Reading syms from /lib/x86_64-linux-gnu/libnss_dns-2.23.so
--14405--   Considering /lib/x86_64-linux-gnu/libnss_dns-2.23.so ..
--14405--   .. CRC mismatch (computed 2395368d wanted 7d518c3c)
--14405--   Considering /usr/lib/debug/lib/x86_64-linux-gnu/libnss_dns-2.23.so ..
--14405--   .. CRC is valid
--14405-- Reading syms from /lib/x86_64-linux-gnu/libresolv-2.23.so
--14405--   Considering /lib/x86_64-linux-gnu/libresolv-2.23.so ..
--14405--   .. CRC mismatch (computed 6c85719f wanted 0ecf24a3)
--14405--   Considering /usr/lib/debug/lib/x86_64-linux-gnu/libresolv-2.23.so ..
--14405--   .. CRC is valid
--14405-- REDIR: 0x5a10bf0 (libc.so.6:__GI_memcmp) redirected to 0x4c33b90 (__GI_memcmp)
--14405-- memcheck GC: 1000 nodes, 32 survivors (3.2%)
--14405-- Reading syms from /root/mono/lib/libmono-btls-shared.so
--14405-- memcheck GC: 1000 nodes, 23 survivors (2.3%)
--14405-- memcheck GC: 1000 nodes, 46 survivors (4.6%)
--14405-- memcheck GC: 1000 nodes, 27 survivors (2.7%)
--14405-- memcheck GC: 1000 nodes, 22 survivors (2.2%)
--14405-- Reading syms from /usr/lib/libgdiplus.so.0.0.0
--14405--    object doesn't have a symbol table
--14405-- Reading syms from /lib/x86_64-linux-gnu/libglib-2.0.so.0.4800.2
--14405--    object doesn't have a symbol table
--14405-- Reading syms from /usr/lib/x86_64-linux-gnu/libcairo.so.2.11400.6
--14405--    object doesn't have a symbol table
--14405-- Reading syms from /usr/lib/x86_64-linux-gnu/libfreetype.so.6.12.1
--14405--    object doesn't have a symbol table
--14405-- Reading syms from /usr/lib/x86_64-linux-gnu/libjpeg.so.8.0.2
--14405--    object doesn't have a symbol table
--14405-- Reading syms from /usr/lib/x86_64-linux-gnu/libtiff.so.5.2.4
--14405--    object doesn't have a symbol table
--14405-- Reading syms from /usr/lib/x86_64-linux-gnu/libgif.so.7.0.0
--14405--    object doesn't have a symbol table
--14405-- Reading syms from /lib/x86_64-linux-gnu/libpng12.so.0.54.0
--14405--   Considering /lib/x86_64-linux-gnu/libpng12.so.0.54.0 ..
--14405--   .. CRC mismatch (computed 6f238d5c wanted 8f335665)
--14405--    object doesn't have a symbol table
--14405-- Reading syms from /usr/lib/x86_64-linux-gnu/libexif.so.12.3.3
--14405--    object doesn't have a symbol table
--14405-- Reading syms from /usr/lib/x86_64-linux-gnu/libfontconfig.so.1.9.0
--14405--    object doesn't have a symbol table
--14405-- Reading syms from /lib/x86_64-linux-gnu/libpcre.so.3.13.2
--14405--   Considering /lib/x86_64-linux-gnu/libpcre.so.3.13.2 ..
--14405--   .. CRC mismatch (computed 276b70fd wanted 22183252)
--14405--    object doesn't have a symbol table
--14405-- Reading syms from /usr/lib/x86_64-linux-gnu/libpixman-1.so.0.33.6
--14405--    object doesn't have a symbol table
--14405-- Reading syms from /usr/lib/x86_64-linux-gnu/libxcb-shm.so.0.0.0
--14405--    object doesn't have a symbol table
--14405-- Reading syms from /usr/lib/x86_64-linux-gnu/libxcb-render.so.0.0.0
--14405--    object doesn't have a symbol table
--14405-- Reading syms from /usr/lib/x86_64-linux-gnu/libxcb.so.1.1.0
--14405--    object doesn't have a symbol table
--14405-- Reading syms from /usr/lib/x86_64-linux-gnu/libXrender.so.1.3.0
--14405--   Considering /usr/lib/x86_64-linux-gnu/libXrender.so.1.3.0 ..
--14405--   .. CRC mismatch (computed 19f12a45 wanted d5c3c1e7)
--14405--    object doesn't have a symbol table
--14405-- Reading syms from /usr/lib/x86_64-linux-gnu/libX11.so.6.3.0
--14405--   Considering /usr/lib/x86_64-linux-gnu/libX11.so.6.3.0 ..
--14405--   .. CRC mismatch (computed 2d6b0194 wanted c4b33c13)
--14405--    object doesn't have a symbol table
--14405-- Reading syms from /usr/lib/x86_64-linux-gnu/libXext.so.6.4.0
--14405--   Considering /usr/lib/x86_64-linux-gnu/libXext.so.6.4.0 ..
--14405--   .. CRC mismatch (computed b483887a wanted 38c83e44)
--14405--    object doesn't have a symbol table
--14405-- Reading syms from /lib/x86_64-linux-gnu/liblzma.so.5.0.0
--14405--    object doesn't have a symbol table
--14405-- Reading syms from /usr/lib/x86_64-linux-gnu/libjbig.so.0
--14405--   Considering /usr/lib/x86_64-linux-gnu/libjbig.so.0 ..
--14405--   .. CRC mismatch (computed 62ceb709 wanted f6cb0ad8)
--14405--    object doesn't have a symbol table
--14405-- Reading syms from /lib/x86_64-linux-gnu/libexpat.so.1.6.0
--14405--    object doesn't have a symbol table
--14405-- Reading syms from /usr/lib/x86_64-linux-gnu/libXau.so.6.0.0
--14405--   Considering /usr/lib/x86_64-linux-gnu/libXau.so.6.0.0 ..
--14405--   .. CRC mismatch (computed 256f5df8 wanted 5d40ac88)
--14405--    object doesn't have a symbol table
--14405-- Reading syms from /usr/lib/x86_64-linux-gnu/libXdmcp.so.6.0.0
--14405--    object doesn't have a symbol table
--14405-- REDIR: 0x5a11850 (libc.so.6:stpcpy) redirected to 0x4a286f0 (_vgnU_ifunc_wrapper)
--14405-- REDIR: 0x5a28fe0 (libc.so.6:__stpcpy_sse2_unaligned) redirected to 0x4c34120 (__stpcpy_sse2_unaligned)
--14405-- memcheck GC: 1000 nodes, 26 survivors (2.6%)
--14405-- memcheck GC: 1000 nodes, 27 survivors (2.7%)
--14405-- memcheck GC: 1000 nodes, 31 survivors (3.1%)
--14405-- memcheck GC: 1000 nodes, 22 survivors (2.2%)
--14405-- REDIR: 0x5a06aa0 (libc.so.6:memalign) redirected to 0x4c2ff20 (memalign)
--14405-- memcheck GC: 1000 nodes, 44 survivors (4.4%)
==14405== Thread 34 Thread Pool Wor:
==14405== Invalid read of size 8
==14405==    at 0x6C9C18: sgen_conservatively_pin_objects_from (sgen-gc.c:827)
==14405==    by 0x6A767C: sgen_client_scan_thread_data (sgen-mono.c:2235)
==14405==    by 0x6C9D3A: pin_from_roots (sgen-gc.c:864)
==14405==    by 0x6CB603: collect_nursery.constprop.44 (sgen-gc.c:1753)
==14405==    by 0x6CE720: sgen_perform_collection_inner (sgen-gc.c:2543)
==14405==    by 0x6BED5D: sgen_alloc_obj_nolock (sgen-alloc.c:256)
==14405==    by 0x6A334B: mono_gc_alloc_vector (sgen-mono.c:1324)
==14405==    by 0x41EBB41: ???
==14405==    by 0x850AAFD: Mono_Math_BigInteger_Kernel_multiByteDivide_Mono_Math_BigInteger_Mono_Math_BigInteger (BigInteger.cs:1994)
==14405==    by 0x850C2AB: Mono_Math_BigInteger_Kernel_modInverse_Mono_Math_BigInteger_Mono_Math_BigInteger (BigInteger.cs:2353)
==14405==    by 0x85082CE: Mono_Math_BigInteger_ModInverse_Mono_Math_BigInteger (BigInteger.cs:892)
==14405==    by 0x84FF1F2: Mono_Security_Cryptography_RSAManaged_DecryptValue_byte__ (RSAManaged.cs:226)
==14405==  Address 0x1abe93b0 is on thread 22's stack
==14405==  2304 bytes below stack pointer
==14405==
==14405== (action on error) vgdb me ...
--14405-- memcheck GC: 1000 nodes, 30 survivors (3.0%)
--14405-- memcheck GC: 1000 nodes, 29 survivors (2.9%)
==14405== Thread 32 Thread Pool Wor:
==14405== Invalid read of size 4
==14405==    at 0xBF82824: NzbDrone_Core_Instrumentation_DatabaseTarget_Handle_NzbDrone_Core_Lifecycle_ApplicationShutdownRequested (in /home/leo/Radarr/_output_mono/NzbDrone.Core.dll.so)
==14405==    by 0xBF783D0: NzbDrone_Core_Messaging_Events_EventAggregator_PublishEvent_TEvent_REF_TEvent_REF (in /home/leo/Radarr/_output_mono/NzbDrone.Core.dll.so)
==14405==    by 0xBF7F8F0: NzbDrone_Core_Lifecycle_LifecycleService_Shutdown (in /home/leo/Radarr/_output_mono/NzbDrone.Core.dll.so)
==14405==    by 0x12458736: NzbDrone_Api_System_SystemModule_Shutdown (in /home/leo/Radarr/_output_mono/NzbDrone.Api.dll.so)
==14405==    by 0x12458844: NzbDrone_Api_System_SystemModule___ctorb__6_2_object (in /home/leo/Radarr/_output_mono/NzbDrone.Api.dll.so)
==14405==    by 0x171AB391: ???
==14405==    by 0xF2F1F92: Nancy_Routing_Route_Invoke_Nancy_DynamicDictionary_System_Threading_CancellationToken (in /home/leo/Radarr/_output_mono/Nancy.dll.so)
==14405==    by 0xF2F1577: Nancy_Routing_DefaultRouteInvoker_Invoke_Nancy_Routing_Route_System_Threading_CancellationToken_Nancy_DynamicDictionary_Nancy_NancyContext (in /home/leo/Radarr/_output_mono/Nancy.dll.so)
==14405==    by 0xF360E1D: Nancy_Routing_DefaultRequestDispatcher__c__DisplayClass2__Dispatchb__0_System_Threading_Tasks_Task_1_Nancy_Response (in /home/leo/Radarr/_output_mono/Nancy.dll.so)
==14405==    by 0xF2DC397: Nancy_Helpers_TaskHelpers_WhenCompleted_T_REF_System_Threading_Tasks_Task_1_T_REF_System_Action_1_System_Threading_Tasks_Task_1_T_REF_System_Action_1_System_Threading_Tasks_Task_1_T_REF_bool (in /home/leo/Radarr/_output_mono/Nancy.dll.so)
==14405==    by 0xF2F010E: Nancy_Routing_DefaultRequestDispatcher_Dispatch_Nancy_NancyContext_System_Threading_CancellationToken (in /home/leo/Radarr/_output_mono/Nancy.dll.so)
==14405==    by 0xF369138: Nancy_NancyEngine__c__DisplayClasse__InvokeRequestLifeCycleb__c_System_Threading_Tasks_Task_1_Nancy_Response (in /home/leo/Radarr/_output_mono/Nancy.dll.so)
==14405==  Address 0x0 is not stack'd, malloc'd or (recently) free'd
==14405==
==14405== (action on error) vgdb me ...
==14405== Continuing ...
==14405== Invalid write of size 8
==14405==    at 0x70A6F2: mono_sigctx_to_monoctx (mono-context.c:205)
==14405==    by 0x5123A0: mono_arch_handle_altstack_exception (exceptions-amd64.c:908)
==14405==    by 0x42D483: mono_sigsegv_signal_handler_debug (mini-runtime.c:3546)
==14405==    by 0x556038F: ??? (in /lib/x86_64-linux-gnu/libpthread-2.23.so)
==14405==    by 0xBF82823: NzbDrone_Core_Instrumentation_DatabaseTarget_Handle_NzbDrone_Core_Lifecycle_ApplicationShutdownRequested (in /home/leo/Radarr/_output_mono/NzbDrone.Core.dll.so)
==14405==    by 0xBF783D0: NzbDrone_Core_Messaging_Events_EventAggregator_PublishEvent_TEvent_REF_TEvent_REF (in /home/leo/Radarr/_output_mono/NzbDrone.Core.dll.so)
==14405==    by 0xBF7F8F0: NzbDrone_Core_Lifecycle_LifecycleService_Shutdown (in /home/leo/Radarr/_output_mono/NzbDrone.Core.dll.so)
==14405==    by 0x12458736: NzbDrone_Api_System_SystemModule_Shutdown (in /home/leo/Radarr/_output_mono/NzbDrone.Api.dll.so)
==14405==    by 0x12458844: NzbDrone_Api_System_SystemModule___ctorb__6_2_object (in /home/leo/Radarr/_output_mono/NzbDrone.Api.dll.so)
==14405==    by 0x171AB391: ???
==14405==    by 0xF2F1F92: Nancy_Routing_Route_Invoke_Nancy_DynamicDictionary_System_Threading_CancellationToken (in /home/leo/Radarr/_output_mono/Nancy.dll.so)
==14405==    by 0xF2F1577: Nancy_Routing_DefaultRouteInvoker_Invoke_Nancy_Routing_Route_System_Threading_CancellationToken_Nancy_DynamicDictionary_Nancy_NancyContext (in /home/leo/Radarr/_output_mono/Nancy.dll.so)
==14405==  Address 0x1d3ff7b0 is on thread 32's stack
==14405==
==14405== (action on error) vgdb me ...
==14405== Continuing ...
==14405== Invalid write of size 8
==14405==    at 0x70A6F9: mono_sigctx_to_monoctx (mono-context.c:205)
==14405==    by 0x5123A0: mono_arch_handle_altstack_exception (exceptions-amd64.c:908)
==14405==    by 0x42D483: mono_sigsegv_signal_handler_debug (mini-runtime.c:3546)
==14405==    by 0x556038F: ??? (in /lib/x86_64-linux-gnu/libpthread-2.23.so)
==14405==    by 0xBF82823: NzbDrone_Core_Instrumentation_DatabaseTarget_Handle_NzbDrone_Core_Lifecycle_ApplicationShutdownRequested (in /home/leo/Radarr/_output_mono/NzbDrone.Core.dll.so)
==14405==    by 0xBF783D0: NzbDrone_Core_Messaging_Events_EventAggregator_PublishEvent_TEvent_REF_TEvent_REF (in /home/leo/Radarr/_output_mono/NzbDrone.Core.dll.so)
==14405==    by 0xBF7F8F0: NzbDrone_Core_Lifecycle_LifecycleService_Shutdown (in /home/leo/Radarr/_output_mono/NzbDrone.Core.dll.so)
==14405==    by 0x12458736: NzbDrone_Api_System_SystemModule_Shutdown (in /home/leo/Radarr/_output_mono/NzbDrone.Api.dll.so)
==14405==    by 0x12458844: NzbDrone_Api_System_SystemModule___ctorb__6_2_object (in /home/leo/Radarr/_output_mono/NzbDrone.Api.dll.so)
==14405==    by 0x171AB391: ???
==14405==    by 0xF2F1F92: Nancy_Routing_Route_Invoke_Nancy_DynamicDictionary_System_Threading_CancellationToken (in /home/leo/Radarr/_output_mono/Nancy.dll.so)
==14405==    by 0xF2F1577: Nancy_Routing_DefaultRouteInvoker_Invoke_Nancy_Routing_Route_System_Threading_CancellationToken_Nancy_DynamicDictionary_Nancy_NancyContext (in /home/leo/Radarr/_output_mono/Nancy.dll.so)
==14405==  Address 0x1d3ff7a8 is on thread 32's stack
==14405==
==14405== (action on error) vgdb me ...
==14405== Continuing ...
==14405== Invalid write of size 8
==14405==    at 0x70A715: mono_sigctx_to_monoctx (mono-context.c:206)
==14405==    by 0x5123A0: mono_arch_handle_altstack_exception (exceptions-amd64.c:908)
==14405==    by 0x42D483: mono_sigsegv_signal_handler_debug (mini-runtime.c:3546)
==14405==    by 0x556038F: ??? (in /lib/x86_64-linux-gnu/libpthread-2.23.so)
==14405==    by 0xBF82823: NzbDrone_Core_Instrumentation_DatabaseTarget_Handle_NzbDrone_Core_Lifecycle_ApplicationShutdownRequested (in /home/leo/Radarr/_output_mono/NzbDrone.Core.dll.so)
==14405==    by 0xBF783D0: NzbDrone_Core_Messaging_Events_EventAggregator_PublishEvent_TEvent_REF_TEvent_REF (in /home/leo/Radarr/_output_mono/NzbDrone.Core.dll.so)
==14405==    by 0xBF7F8F0: NzbDrone_Core_Lifecycle_LifecycleService_Shutdown (in /home/leo/Radarr/_output_mono/NzbDrone.Core.dll.so)
==14405==    by 0x12458736: NzbDrone_Api_System_SystemModule_Shutdown (in /home/leo/Radarr/_output_mono/NzbDrone.Api.dll.so)
==14405==    by 0x12458844: NzbDrone_Api_System_SystemModule___ctorb__6_2_object (in /home/leo/Radarr/_output_mono/NzbDrone.Api.dll.so)
==14405==    by 0x171AB391: ???
==14405==    by 0xF2F1F92: Nancy_Routing_Route_Invoke_Nancy_DynamicDictionary_System_Threading_CancellationToken (in /home/leo/Radarr/_output_mono/Nancy.dll.so)
==14405==    by 0xF2F1577: Nancy_Routing_DefaultRouteInvoker_Invoke_Nancy_Routing_Route_System_Threading_CancellationToken_Nancy_DynamicDictionary_Nancy_NancyContext (in /home/leo/Radarr/_output_mono/Nancy.dll.so)
==14405==  Address 0x1d3ff7c0 is on thread 32's stack
==14405==
==14405== (action on error) vgdb me ...
==14405== Continuing ...
==14405== Invalid write of size 8
==14405==    at 0x70A71C: mono_sigctx_to_monoctx (mono-context.c:206)
==14405==    by 0x5123A0: mono_arch_handle_altstack_exception (exceptions-amd64.c:908)
==14405==    by 0x42D483: mono_sigsegv_signal_handler_debug (mini-runtime.c:3546)
==14405==    by 0x556038F: ??? (in /lib/x86_64-linux-gnu/libpthread-2.23.so)
==14405==    by 0xBF82823: NzbDrone_Core_Instrumentation_DatabaseTarget_Handle_NzbDrone_Core_Lifecycle_ApplicationShutdownRequested (in /home/leo/Radarr/_output_mono/NzbDrone.Core.dll.so)
==14405==    by 0xBF783D0: NzbDrone_Core_Messaging_Events_EventAggregator_PublishEvent_TEvent_REF_TEvent_REF (in /home/leo/Radarr/_output_mono/NzbDrone.Core.dll.so)
==14405==    by 0xBF7F8F0: NzbDrone_Core_Lifecycle_LifecycleService_Shutdown (in /home/leo/Radarr/_output_mono/NzbDrone.Core.dll.so)
==14405==    by 0x12458736: NzbDrone_Api_System_SystemModule_Shutdown (in /home/leo/Radarr/_output_mono/NzbDrone.Api.dll.so)
==14405==    by 0x12458844: NzbDrone_Api_System_SystemModule___ctorb__6_2_object (in /home/leo/Radarr/_output_mono/NzbDrone.Api.dll.so)
==14405==    by 0x171AB391: ???
==14405==    by 0xF2F1F92: Nancy_Routing_Route_Invoke_Nancy_DynamicDictionary_System_Threading_CancellationToken (in /home/leo/Radarr/_output_mono/Nancy.dll.so)
==14405==    by 0xF2F1577: Nancy_Routing_DefaultRouteInvoker_Invoke_Nancy_Routing_Route_System_Threading_CancellationToken_Nancy_DynamicDictionary_Nancy_NancyContext (in /home/leo/Radarr/_output_mono/Nancy.dll.so)
==14405==  Address 0x1d3ff7b8 is on thread 32's stack
==14405==
==14405== (action on error) vgdb me ...
==14405== Continuing ...
==14405== Invalid write of size 8
==14405==    at 0x70A738: mono_sigctx_to_monoctx (mono-context.c:207)
==14405==    by 0x5123A0: mono_arch_handle_altstack_exception (exceptions-amd64.c:908)
==14405==    by 0x42D483: mono_sigsegv_signal_handler_debug (mini-runtime.c:3546)
==14405==    by 0x556038F: ??? (in /lib/x86_64-linux-gnu/libpthread-2.23.so)
==14405==    by 0xBF82823: NzbDrone_Core_Instrumentation_DatabaseTarget_Handle_NzbDrone_Core_Lifecycle_ApplicationShutdownRequested (in /home/leo/Radarr/_output_mono/NzbDrone.Core.dll.so)
==14405==    by 0xBF783D0: NzbDrone_Core_Messaging_Events_EventAggregator_PublishEvent_TEvent_REF_TEvent_REF (in /home/leo/Radarr/_output_mono/NzbDrone.Core.dll.so)
==14405==    by 0xBF7F8F0: NzbDrone_Core_Lifecycle_LifecycleService_Shutdown (in /home/leo/Radarr/_output_mono/NzbDrone.Core.dll.so)
==14405==    by 0x12458736: NzbDrone_Api_System_SystemModule_Shutdown (in /home/leo/Radarr/_output_mono/NzbDrone.Api.dll.so)
==14405==    by 0x12458844: NzbDrone_Api_System_SystemModule___ctorb__6_2_object (in /home/leo/Radarr/_output_mono/NzbDrone.Api.dll.so)
==14405==    by 0x171AB391: ???
==14405==    by 0xF2F1F92: Nancy_Routing_Route_Invoke_Nancy_DynamicDictionary_System_Threading_CancellationToken (in /home/leo/Radarr/_output_mono/Nancy.dll.so)
==14405==    by 0xF2F1577: Nancy_Routing_DefaultRouteInvoker_Invoke_Nancy_Routing_Route_System_Threading_CancellationToken_Nancy_DynamicDictionary_Nancy_NancyContext (in /home/leo/Radarr/_output_mono/Nancy.dll.so)
==14405==  Address 0x1d3ff7d0 is on thread 32's stack
==14405==
==14405== (action on error) vgdb me ...
==14405== Continuing ...
==14405== Invalid write of size 8
==14405==    at 0x70A73F: mono_sigctx_to_monoctx (mono-context.c:207)
==14405==    by 0x5123A0: mono_arch_handle_altstack_exception (exceptions-amd64.c:908)
==14405==    by 0x42D483: mono_sigsegv_signal_handler_debug (mini-runtime.c:3546)
==14405==    by 0x556038F: ??? (in /lib/x86_64-linux-gnu/libpthread-2.23.so)
==14405==    by 0xBF82823: NzbDrone_Core_Instrumentation_DatabaseTarget_Handle_NzbDrone_Core_Lifecycle_ApplicationShutdownRequested (in /home/leo/Radarr/_output_mono/NzbDrone.Core.dll.so)
==14405==    by 0xBF783D0: NzbDrone_Core_Messaging_Events_EventAggregator_PublishEvent_TEvent_REF_TEvent_REF (in /home/leo/Radarr/_output_mono/NzbDrone.Core.dll.so)
==14405==    by 0xBF7F8F0: NzbDrone_Core_Lifecycle_LifecycleService_Shutdown (in /home/leo/Radarr/_output_mono/NzbDrone.Core.dll.so)
==14405==    by 0x12458736: NzbDrone_Api_System_SystemModule_Shutdown (in /home/leo/Radarr/_output_mono/NzbDrone.Api.dll.so)
==14405==    by 0x12458844: NzbDrone_Api_System_SystemModule___ctorb__6_2_object (in /home/leo/Radarr/_output_mono/NzbDrone.Api.dll.so)
==14405==    by 0x171AB391: ???
==14405==    by 0xF2F1F92: Nancy_Routing_Route_Invoke_Nancy_DynamicDictionary_System_Threading_CancellationToken (in /home/leo/Radarr/_output_mono/Nancy.dll.so)
==14405==    by 0xF2F1577: Nancy_Routing_DefaultRouteInvoker_Invoke_Nancy_Routing_Route_System_Threading_CancellationToken_Nancy_DynamicDictionary_Nancy_NancyContext (in /home/leo/Radarr/_output_mono/Nancy.dll.so)
==14405==  Address 0x1d3ff7c8 is on thread 32's stack
==14405==
==14405== (action on error) vgdb me ...
==14405== Continuing ...
==14405== Invalid write of size 8
==14405==    at 0x70A75B: mono_sigctx_to_monoctx (mono-context.c:208)
==14405==    by 0x5123A0: mono_arch_handle_altstack_exception (exceptions-amd64.c:908)
==14405==    by 0x42D483: mono_sigsegv_signal_handler_debug (mini-runtime.c:3546)
==14405==    by 0x556038F: ??? (in /lib/x86_64-linux-gnu/libpthread-2.23.so)
==14405==    by 0xBF82823: NzbDrone_Core_Instrumentation_DatabaseTarget_Handle_NzbDrone_Core_Lifecycle_ApplicationShutdownRequested (in /home/leo/Radarr/_output_mono/NzbDrone.Core.dll.so)
==14405==    by 0xBF783D0: NzbDrone_Core_Messaging_Events_EventAggregator_PublishEvent_TEvent_REF_TEvent_REF (in /home/leo/Radarr/_output_mono/NzbDrone.Core.dll.so)
==14405==    by 0xBF7F8F0: NzbDrone_Core_Lifecycle_LifecycleService_Shutdown (in /home/leo/Radarr/_output_mono/NzbDrone.Core.dll.so)
==14405==    by 0x12458736: NzbDrone_Api_System_SystemModule_Shutdown (in /home/leo/Radarr/_output_mono/NzbDrone.Api.dll.so)
==14405==    by 0x12458844: NzbDrone_Api_System_SystemModule___ctorb__6_2_object (in /home/leo/Radarr/_output_mono/NzbDrone.Api.dll.so)
==14405==    by 0x171AB391: ???
==14405==    by 0xF2F1F92: Nancy_Routing_Route_Invoke_Nancy_DynamicDictionary_System_Threading_CancellationToken (in /home/leo/Radarr/_output_mono/Nancy.dll.so)
==14405==    by 0xF2F1577: Nancy_Routing_DefaultRouteInvoker_Invoke_Nancy_Routing_Route_System_Threading_CancellationToken_Nancy_DynamicDictionary_Nancy_NancyContext (in /home/leo/Radarr/_output_mono/Nancy.dll.so)
==14405==  Address 0x1d3ff7e0 is on thread 32's stack
==14405==
==14405== (action on error) vgdb me ...
==14405== Continuing ...
==14405== Invalid write of size 8
==14405==    at 0x70A762: mono_sigctx_to_monoctx (mono-context.c:208)
==14405==    by 0x5123A0: mono_arch_handle_altstack_exception (exceptions-amd64.c:908)
==14405==    by 0x42D483: mono_sigsegv_signal_handler_debug (mini-runtime.c:3546)
==14405==    by 0x556038F: ??? (in /lib/x86_64-linux-gnu/libpthread-2.23.so)
==14405==    by 0xBF82823: NzbDrone_Core_Instrumentation_DatabaseTarget_Handle_NzbDrone_Core_Lifecycle_ApplicationShutdownRequested (in /home/leo/Radarr/_output_mono/NzbDrone.Core.dll.so)
==14405==    by 0xBF783D0: NzbDrone_Core_Messaging_Events_EventAggregator_PublishEvent_TEvent_REF_TEvent_REF (in /home/leo/Radarr/_output_mono/NzbDrone.Core.dll.so)
==14405==    by 0xBF7F8F0: NzbDrone_Core_Lifecycle_LifecycleService_Shutdown (in /home/leo/Radarr/_output_mono/NzbDrone.Core.dll.so)
==14405==    by 0x12458736: NzbDrone_Api_System_SystemModule_Shutdown (in /home/leo/Radarr/_output_mono/NzbDrone.Api.dll.so)
==14405==    by 0x12458844: NzbDrone_Api_System_SystemModule___ctorb__6_2_object (in /home/leo/Radarr/_output_mono/NzbDrone.Api.dll.so)
==14405==    by 0x171AB391: ???
==14405==    by 0xF2F1F92: Nancy_Routing_Route_Invoke_Nancy_DynamicDictionary_System_Threading_CancellationToken (in /home/leo/Radarr/_output_mono/Nancy.dll.so)
==14405==    by 0xF2F1577: Nancy_Routing_DefaultRouteInvoker_Invoke_Nancy_Routing_Route_System_Threading_CancellationToken_Nancy_DynamicDictionary_Nancy_NancyContext (in /home/leo/Radarr/_output_mono/Nancy.dll.so)
==14405==  Address 0x1d3ff7d8 is on thread 32's stack
==14405==
==14405== (action on error) vgdb me ...
==14405== Continuing ...
==14405== Invalid write of size 8
==14405==    at 0x70A77E: mono_sigctx_to_monoctx (mono-context.c:209)
==14405==    by 0x5123A0: mono_arch_handle_altstack_exception (exceptions-amd64.c:908)
==14405==    by 0x42D483: mono_sigsegv_signal_handler_debug (mini-runtime.c:3546)
==14405==    by 0x556038F: ??? (in /lib/x86_64-linux-gnu/libpthread-2.23.so)
==14405==    by 0xBF82823: NzbDrone_Core_Instrumentation_DatabaseTarget_Handle_NzbDrone_Core_Lifecycle_ApplicationShutdownRequested (in /home/leo/Radarr/_output_mono/NzbDrone.Core.dll.so)
==14405==    by 0xBF783D0: NzbDrone_Core_Messaging_Events_EventAggregator_PublishEvent_TEvent_REF_TEvent_REF (in /home/leo/Radarr/_output_mono/NzbDrone.Core.dll.so)
==14405==    by 0xBF7F8F0: NzbDrone_Core_Lifecycle_LifecycleService_Shutdown (in /home/leo/Radarr/_output_mono/NzbDrone.Core.dll.so)
==14405==    by 0x12458736: NzbDrone_Api_System_SystemModule_Shutdown (in /home/leo/Radarr/_output_mono/NzbDrone.Api.dll.so)
==14405==    by 0x12458844: NzbDrone_Api_System_SystemModule___ctorb__6_2_object (in /home/leo/Radarr/_output_mono/NzbDrone.Api.dll.so)
==14405==    by 0x171AB391: ???
==14405==    by 0xF2F1F92: Nancy_Routing_Route_Invoke_Nancy_DynamicDictionary_System_Threading_CancellationToken (in /home/leo/Radarr/_output_mono/Nancy.dll.so)
==14405==    by 0xF2F1577: Nancy_Routing_DefaultRouteInvoker_Invoke_Nancy_Routing_Route_System_Threading_CancellationToken_Nancy_DynamicDictionary_Nancy_NancyContext (in /home/leo/Radarr/_output_mono/Nancy.dll.so)
==14405==  Address 0x1d3ff7f0 is on thread 32's stack
==14405==
==14405== (action on error) vgdb me ...
==14405== Continuing ...
==14405== Invalid write of size 8
==14405==    at 0x70A785: mono_sigctx_to_monoctx (mono-context.c:209)
==14405==    by 0x5123A0: mono_arch_handle_altstack_exception (exceptions-amd64.c:908)
==14405==    by 0x42D483: mono_sigsegv_signal_handler_debug (mini-runtime.c:3546)
==14405==    by 0x556038F: ??? (in /lib/x86_64-linux-gnu/libpthread-2.23.so)
==14405==    by 0xBF82823: NzbDrone_Core_Instrumentation_DatabaseTarget_Handle_NzbDrone_Core_Lifecycle_ApplicationShutdownRequested (in /home/leo/Radarr/_output_mono/NzbDrone.Core.dll.so)
==14405==    by 0xBF783D0: NzbDrone_Core_Messaging_Events_EventAggregator_PublishEvent_TEvent_REF_TEvent_REF (in /home/leo/Radarr/_output_mono/NzbDrone.Core.dll.so)
==14405==    by 0xBF7F8F0: NzbDrone_Core_Lifecycle_LifecycleService_Shutdown (in /home/leo/Radarr/_output_mono/NzbDrone.Core.dll.so)
==14405==    by 0x12458736: NzbDrone_Api_System_SystemModule_Shutdown (in /home/leo/Radarr/_output_mono/NzbDrone.Api.dll.so)
==14405==    by 0x12458844: NzbDrone_Api_System_SystemModule___ctorb__6_2_object (in /home/leo/Radarr/_output_mono/NzbDrone.Api.dll.so)
==14405==    by 0x171AB391: ???
==14405==    by 0xF2F1F92: Nancy_Routing_Route_Invoke_Nancy_DynamicDictionary_System_Threading_CancellationToken (in /home/leo/Radarr/_output_mono/Nancy.dll.so)
==14405==    by 0xF2F1577: Nancy_Routing_DefaultRouteInvoker_Invoke_Nancy_Routing_Route_System_Threading_CancellationToken_Nancy_DynamicDictionary_Nancy_NancyContext (in /home/leo/Radarr/_output_mono/Nancy.dll.so)
==14405==  Address 0x1d3ff7e8 is on thread 32's stack
==14405==
==14405== (action on error) vgdb me ...
==14405== Continuing ...
==14405== Invalid write of size 8
==14405==    at 0x70A7A1: mono_sigctx_to_monoctx (mono-context.c:210)
==14405==    by 0x5123A0: mono_arch_handle_altstack_exception (exceptions-amd64.c:908)
==14405==    by 0x42D483: mono_sigsegv_signal_handler_debug (mini-runtime.c:3546)
==14405==    by 0x556038F: ??? (in /lib/x86_64-linux-gnu/libpthread-2.23.so)
==14405==    by 0xBF82823: NzbDrone_Core_Instrumentation_DatabaseTarget_Handle_NzbDrone_Core_Lifecycle_ApplicationShutdownRequested (in /home/leo/Radarr/_output_mono/NzbDrone.Core.dll.so)
==14405==    by 0xBF783D0: NzbDrone_Core_Messaging_Events_EventAggregator_PublishEvent_TEvent_REF_TEvent_REF (in /home/leo/Radarr/_output_mono/NzbDrone.Core.dll.so)
==14405==    by 0xBF7F8F0: NzbDrone_Core_Lifecycle_LifecycleService_Shutdown (in /home/leo/Radarr/_output_mono/NzbDrone.Core.dll.so)
==14405==    by 0x12458736: NzbDrone_Api_System_SystemModule_Shutdown (in /home/leo/Radarr/_output_mono/NzbDrone.Api.dll.so)
==14405==    by 0x12458844: NzbDrone_Api_System_SystemModule___ctorb__6_2_object (in /home/leo/Radarr/_output_mono/NzbDrone.Api.dll.so)
==14405==    by 0x171AB391: ???
==14405==    by 0xF2F1F92: Nancy_Routing_Route_Invoke_Nancy_DynamicDictionary_System_Threading_CancellationToken (in /home/leo/Radarr/_output_mono/Nancy.dll.so)
==14405==    by 0xF2F1577: Nancy_Routing_DefaultRouteInvoker_Invoke_Nancy_Routing_Route_System_Threading_CancellationToken_Nancy_DynamicDictionary_Nancy_NancyContext (in /home/leo/Radarr/_output_mono/Nancy.dll.so)
==14405==  Address 0x1d3ff800 is on thread 32's stack
==14405==
==14405== (action on error) vgdb me ...
==14405== Continuing ...
==14405== Invalid write of size 8
==14405==    at 0x70A7A8: mono_sigctx_to_monoctx (mono-context.c:210)
==14405==    by 0x5123A0: mono_arch_handle_altstack_exception (exceptions-amd64.c:908)
==14405==    by 0x42D483: mono_sigsegv_signal_handler_debug (mini-runtime.c:3546)
==14405==    by 0x556038F: ??? (in /lib/x86_64-linux-gnu/libpthread-2.23.so)
==14405==    by 0xBF82823: NzbDrone_Core_Instrumentation_DatabaseTarget_Handle_NzbDrone_Core_Lifecycle_ApplicationShutdownRequested (in /home/leo/Radarr/_output_mono/NzbDrone.Core.dll.so)
==14405==    by 0xBF783D0: NzbDrone_Core_Messaging_Events_EventAggregator_PublishEvent_TEvent_REF_TEvent_REF (in /home/leo/Radarr/_output_mono/NzbDrone.Core.dll.so)
==14405==    by 0xBF7F8F0: NzbDrone_Core_Lifecycle_LifecycleService_Shutdown (in /home/leo/Radarr/_output_mono/NzbDrone.Core.dll.so)
==14405==    by 0x12458736: NzbDrone_Api_System_SystemModule_Shutdown (in /home/leo/Radarr/_output_mono/NzbDrone.Api.dll.so)
==14405==    by 0x12458844: NzbDrone_Api_System_SystemModule___ctorb__6_2_object (in /home/leo/Radarr/_output_mono/NzbDrone.Api.dll.so)
==14405==    by 0x171AB391: ???
==14405==    by 0xF2F1F92: Nancy_Routing_Route_Invoke_Nancy_DynamicDictionary_System_Threading_CancellationToken (in /home/leo/Radarr/_output_mono/Nancy.dll.so)
==14405==    by 0xF2F1577: Nancy_Routing_DefaultRouteInvoker_Invoke_Nancy_Routing_Route_System_Threading_CancellationToken_Nancy_DynamicDictionary_Nancy_NancyContext (in /home/leo/Radarr/_output_mono/Nancy.dll.so)
==14405==  Address 0x1d3ff7f8 is on thread 32's stack
==14405==
==14405== (action on error) vgdb me ...
==14405== Continuing ...
==14405== Invalid write of size 8
==14405==    at 0x70A7C4: mono_sigctx_to_monoctx (mono-context.c:211)
==14405==    by 0x5123A0: mono_arch_handle_altstack_exception (exceptions-amd64.c:908)
==14405==    by 0x42D483: mono_sigsegv_signal_handler_debug (mini-runtime.c:3546)
==14405==    by 0x556038F: ??? (in /lib/x86_64-linux-gnu/libpthread-2.23.so)
==14405==    by 0xBF82823: NzbDrone_Core_Instrumentation_DatabaseTarget_Handle_NzbDrone_Core_Lifecycle_ApplicationShutdownRequested (in /home/leo/Radarr/_output_mono/NzbDrone.Core.dll.so)
==14405==    by 0xBF783D0: NzbDrone_Core_Messaging_Events_EventAggregator_PublishEvent_TEvent_REF_TEvent_REF (in /home/leo/Radarr/_output_mono/NzbDrone.Core.dll.so)
==14405==    by 0xBF7F8F0: NzbDrone_Core_Lifecycle_LifecycleService_Shutdown (in /home/leo/Radarr/_output_mono/NzbDrone.Core.dll.so)
==14405==    by 0x12458736: NzbDrone_Api_System_SystemModule_Shutdown (in /home/leo/Radarr/_output_mono/NzbDrone.Api.dll.so)
==14405==    by 0x12458844: NzbDrone_Api_System_SystemModule___ctorb__6_2_object (in /home/leo/Radarr/_output_mono/NzbDrone.Api.dll.so)
==14405==    by 0x171AB391: ???
==14405==    by 0xF2F1F92: Nancy_Routing_Route_Invoke_Nancy_DynamicDictionary_System_Threading_CancellationToken (in /home/leo/Radarr/_output_mono/Nancy.dll.so)
==14405==    by 0xF2F1577: Nancy_Routing_DefaultRouteInvoker_Invoke_Nancy_Routing_Route_System_Threading_CancellationToken_Nancy_DynamicDictionary_Nancy_NancyContext (in /home/leo/Radarr/_output_mono/Nancy.dll.so)
==14405==  Address 0x1d3ff810 is on thread 32's stack
==14405==
==14405== (action on error) vgdb me ...
==14405== Continuing ...
==14405== Invalid write of size 8
==14405==    at 0x70A7CB: mono_sigctx_to_monoctx (mono-context.c:211)
==14405==    by 0x5123A0: mono_arch_handle_altstack_exception (exceptions-amd64.c:908)
==14405==    by 0x42D483: mono_sigsegv_signal_handler_debug (mini-runtime.c:3546)
==14405==    by 0x556038F: ??? (in /lib/x86_64-linux-gnu/libpthread-2.23.so)
==14405==    by 0xBF82823: NzbDrone_Core_Instrumentation_DatabaseTarget_Handle_NzbDrone_Core_Lifecycle_ApplicationShutdownRequested (in /home/leo/Radarr/_output_mono/NzbDrone.Core.dll.so)
==14405==    by 0xBF783D0: NzbDrone_Core_Messaging_Events_EventAggregator_PublishEvent_TEvent_REF_TEvent_REF (in /home/leo/Radarr/_output_mono/NzbDrone.Core.dll.so)
==14405==    by 0xBF7F8F0: NzbDrone_Core_Lifecycle_LifecycleService_Shutdown (in /home/leo/Radarr/_output_mono/NzbDrone.Core.dll.so)
==14405==    by 0x12458736: NzbDrone_Api_System_SystemModule_Shutdown (in /home/leo/Radarr/_output_mono/NzbDrone.Api.dll.so)
==14405==    by 0x12458844: NzbDrone_Api_System_SystemModule___ctorb__6_2_object (in /home/leo/Radarr/_output_mono/NzbDrone.Api.dll.so)
==14405==    by 0x171AB391: ???
==14405==    by 0xF2F1F92: Nancy_Routing_Route_Invoke_Nancy_DynamicDictionary_System_Threading_CancellationToken (in /home/leo/Radarr/_output_mono/Nancy.dll.so)
==14405==    by 0xF2F1577: Nancy_Routing_DefaultRouteInvoker_Invoke_Nancy_Routing_Route_System_Threading_CancellationToken_Nancy_DynamicDictionary_Nancy_NancyContext (in /home/leo/Radarr/_output_mono/Nancy.dll.so)
==14405==  Address 0x1d3ff808 is on thread 32's stack
==14405==
==14405== (action on error) vgdb me ...
==14405== Continuing ...
==14405== Invalid write of size 8
==14405==    at 0x70A7E7: mono_sigctx_to_monoctx (mono-context.c:212)
==14405==    by 0x5123A0: mono_arch_handle_altstack_exception (exceptions-amd64.c:908)
==14405==    by 0x42D483: mono_sigsegv_signal_handler_debug (mini-runtime.c:3546)
==14405==    by 0x556038F: ??? (in /lib/x86_64-linux-gnu/libpthread-2.23.so)
==14405==    by 0xBF82823: NzbDrone_Core_Instrumentation_DatabaseTarget_Handle_NzbDrone_Core_Lifecycle_ApplicationShutdownRequested (in /home/leo/Radarr/_output_mono/NzbDrone.Core.dll.so)
==14405==    by 0xBF783D0: NzbDrone_Core_Messaging_Events_EventAggregator_PublishEvent_TEvent_REF_TEvent_REF (in /home/leo/Radarr/_output_mono/NzbDrone.Core.dll.so)
==14405==    by 0xBF7F8F0: NzbDrone_Core_Lifecycle_LifecycleService_Shutdown (in /home/leo/Radarr/_output_mono/NzbDrone.Core.dll.so)
==14405==    by 0x12458736: NzbDrone_Api_System_SystemModule_Shutdown (in /home/leo/Radarr/_output_mono/NzbDrone.Api.dll.so)
==14405==    by 0x12458844: NzbDrone_Api_System_SystemModule___ctorb__6_2_object (in /home/leo/Radarr/_output_mono/NzbDrone.Api.dll.so)
==14405==    by 0x171AB391: ???
==14405==    by 0xF2F1F92: Nancy_Routing_Route_Invoke_Nancy_DynamicDictionary_System_Threading_CancellationToken (in /home/leo/Radarr/_output_mono/Nancy.dll.so)
==14405==    by 0xF2F1577: Nancy_Routing_DefaultRouteInvoker_Invoke_Nancy_Routing_Route_System_Threading_CancellationToken_Nancy_DynamicDictionary_Nancy_NancyContext (in /home/leo/Radarr/_output_mono/Nancy.dll.so)
==14405==  Address 0x1d3ff820 is on thread 32's stack
==14405==
==14405== (action on error) vgdb me ...
==14405== Continuing ...
==14405== Invalid write of size 8
==14405==    at 0x70A7EE: mono_sigctx_to_monoctx (mono-context.c:212)
==14405==    by 0x5123A0: mono_arch_handle_altstack_exception (exceptions-amd64.c:908)
==14405==    by 0x42D483: mono_sigsegv_signal_handler_debug (mini-runtime.c:3546)
==14405==    by 0x556038F: ??? (in /lib/x86_64-linux-gnu/libpthread-2.23.so)
==14405==    by 0xBF82823: NzbDrone_Core_Instrumentation_DatabaseTarget_Handle_NzbDrone_Core_Lifecycle_ApplicationShutdownRequested (in /home/leo/Radarr/_output_mono/NzbDrone.Core.dll.so)
==14405==    by 0xBF783D0: NzbDrone_Core_Messaging_Events_EventAggregator_PublishEvent_TEvent_REF_TEvent_REF (in /home/leo/Radarr/_output_mono/NzbDrone.Core.dll.so)
==14405==    by 0xBF7F8F0: NzbDrone_Core_Lifecycle_LifecycleService_Shutdown (in /home/leo/Radarr/_output_mono/NzbDrone.Core.dll.so)
==14405==    by 0x12458736: NzbDrone_Api_System_SystemModule_Shutdown (in /home/leo/Radarr/_output_mono/NzbDrone.Api.dll.so)
==14405==    by 0x12458844: NzbDrone_Api_System_SystemModule___ctorb__6_2_object (in /home/leo/Radarr/_output_mono/NzbDrone.Api.dll.so)
==14405==    by 0x171AB391: ???
==14405==    by 0xF2F1F92: Nancy_Routing_Route_Invoke_Nancy_DynamicDictionary_System_Threading_CancellationToken (in /home/leo/Radarr/_output_mono/Nancy.dll.so)
==14405==    by 0xF2F1577: Nancy_Routing_DefaultRouteInvoker_Invoke_Nancy_Routing_Route_System_Threading_CancellationToken_Nancy_DynamicDictionary_Nancy_NancyContext (in /home/leo/Radarr/_output_mono/Nancy.dll.so)
==14405==  Address 0x1d3ff818 is on thread 32's stack
==14405==
==14405== (action on error) vgdb me ...
==14405== Continuing ...
==14405== Thread 32 return signal frame corrupted.  Killing process.
==14405==
==14405== Process terminating with default action of signal 11 (SIGSEGV)
==14405==  General Protection Fault
==14405==    at 0x5560397: ??? (in /lib/x86_64-linux-gnu/libpthread-2.23.so)
==14405==    by 0x1D3FF677: ???
--14405-- Discarding syms at 0x1c1012d0-0x1c106bf1 in /lib/x86_64-linux-gnu/libnss_compat-2.23.so due to munmap()
--14405-- Discarding syms at 0x1c5240b0-0x1c52a8aa in /lib/x86_64-linux-gnu/libnss_nis-2.23.so due to munmap()
--14405-- Discarding syms at 0x1c30cff0-0x1c31a1e1 in /lib/x86_64-linux-gnu/libnsl-2.23.so due to munmap()
--14405-- Discarding syms at 0x174021b0-0x174082a1 in /lib/x86_64-linux-gnu/libnss_files-2.23.so due to munmap()
--14405-- Discarding syms at 0x1e1b7f90-0x1e1bb6b6 in /lib/x86_64-linux-gnu/libnss_dns-2.23.so due to munmap()
--14405-- Discarding syms at 0x1e3c1950-0x1e3d12b8 in /lib/x86_64-linux-gnu/libresolv-2.23.so due to munmap()
==14405==
==14405== HEAP SUMMARY:
==14405==     in use at exit: 51,061,352 bytes in 325,730 blocks
==14405==   total heap usage: 4,600,555 allocs, 4,274,825 frees, 4,635,161,683 bytes allocated
==14405==
==14405== Searching for pointers to 325,730 not-freed blocks
==14405== Checked 207,794,328 bytes
==14405==
==14405== Thread 1:
==14405== 4 bytes in 1 blocks are definitely lost in loss record 212 of 80,324
==14405==    at 0x4C2DB8F: malloc (in /usr/lib/valgrind/vgpreload_memcheck-amd64-linux.so)
==14405==    by 0x71A0FD: monoeg_malloc (gmem.c:108)
==14405==    by 0x684E9D: load_cattr_value (custom-attrs.c:334)
==14405==    by 0x68763C: mono_reflection_create_custom_attr_data_args_noalloc (custom-attrs.c:1211)
==14405==    by 0x5F9894: mono_marshal_get_managed_wrapper (marshal.c:3844)
==14405==    by 0x5F9EBF: mono_delegate_handle_to_ftnptr (marshal.c:384)
==14405==    by 0x5FA02C: mono_delegate_to_ftnptr (marshal.c:330)
==14405==    by 0x159E3F31: ???
==14405==    by 0xDAE5B77: System_Data_SQLite_SQLiteFactory__cctor (in /home/leo/Radarr/_output_mono/System.Data.SQLite.dll.so)
==14405==    by 0x159E309E: ???
==14405==    by 0x42C7A0: mono_jit_runtime_invoke (mini-runtime.c:3189)
==14405==    by 0x620F7F: do_runtime_invoke (object.c:2978)
==14405==
==14405== 4 bytes in 1 blocks are definitely lost in loss record 213 of 80,324
==14405==    at 0x4C2DB8F: malloc (in /usr/lib/valgrind/vgpreload_memcheck-amd64-linux.so)
==14405==    by 0x71A0FD: monoeg_malloc (gmem.c:108)
==14405==    by 0x684E9D: load_cattr_value (custom-attrs.c:334)
==14405==    by 0x68763C: mono_reflection_create_custom_attr_data_args_noalloc (custom-attrs.c:1211)
==14405==    by 0x5F9894: mono_marshal_get_managed_wrapper (marshal.c:3844)
==14405==    by 0x5F9EBF: mono_delegate_handle_to_ftnptr (marshal.c:384)
==14405==    by 0x5FA02C: mono_delegate_to_ftnptr (marshal.c:330)
==14405==    by 0x159E3F31: ???
==14405==    by 0x114A1EFF: ???
==14405==    by 0x64BB997: ???
==14405==
==14405== 4 bytes in 1 blocks are definitely lost in loss record 214 of 80,324
==14405==    at 0x4C2DB8F: malloc (in /usr/lib/valgrind/vgpreload_memcheck-amd64-linux.so)
==14405==    by 0x71A0FD: monoeg_malloc (gmem.c:108)
==14405==    by 0x684E9D: load_cattr_value (custom-attrs.c:334)
==14405==    by 0x68763C: mono_reflection_create_custom_attr_data_args_noalloc (custom-attrs.c:1211)
==14405==    by 0x5F9894: mono_marshal_get_managed_wrapper (marshal.c:3844)
==14405==    by 0x5F9EBF: mono_delegate_handle_to_ftnptr (marshal.c:384)
==14405==    by 0x5FA02C: mono_delegate_to_ftnptr (marshal.c:330)
==14405==    by 0x159E3F31: ???
==14405==    by 0x155FFEFF: ???
==14405==    by 0x6724C6F: ???
==14405==
==14405== 12 bytes in 1 blocks are definitely lost in loss record 4,128 of 80,324
==14405==    at 0x4C2DB8F: malloc (in /usr/lib/valgrind/vgpreload_memcheck-amd64-linux.so)
==14405==    by 0x71A0FD: monoeg_malloc (gmem.c:108)
==14405==    by 0x685D38: create_custom_attr (custom-attrs.c:935)
==14405==    by 0x6863FE: create_custom_attr_into_array (custom-attrs.c:1006)
==14405==    by 0x6863FE: mono_custom_attrs_construct_by_type (custom-attrs.c:1516)
==14405==    by 0x689397: mono_reflection_get_custom_attrs_by_type_handle (custom-attrs.c:2208)
==14405==    by 0x5CF4F9: ves_icall_MonoCustomAttrs_GetCustomAttributesInternal (icall.c:8044)
==14405==    by 0x5D669E: ves_icall_MonoCustomAttrs_GetCustomAttributesInternal_raw (icall-def.h:515)
==14405==    by 0x115604DD: ???
==14405==    by 0x11561E03: ???
==14405==    by 0x1593BCA3: ???
==14405==    by 0x42C7A0: mono_jit_runtime_invoke (mini-runtime.c:3189)
==14405==    by 0x620F7F: do_runtime_invoke (object.c:2978)
==14405==
==14405== 12 bytes in 1 blocks are definitely lost in loss record 4,129 of 80,324
==14405==    at 0x4C2DB8F: malloc (in /usr/lib/valgrind/vgpreload_memcheck-amd64-linux.so)
==14405==    by 0x71A0FD: monoeg_malloc (gmem.c:108)
==14405==    by 0x685D38: create_custom_attr (custom-attrs.c:935)
==14405==    by 0x6863FE: create_custom_attr_into_array (custom-attrs.c:1006)
==14405==    by 0x6863FE: mono_custom_attrs_construct_by_type (custom-attrs.c:1516)
==14405==    by 0x689397: mono_reflection_get_custom_attrs_by_type_handle (custom-attrs.c:2208)
==14405==    by 0x5CF4F9: ves_icall_MonoCustomAttrs_GetCustomAttributesInternal (icall.c:8044)
==14405==    by 0x5D669E: ves_icall_MonoCustomAttrs_GetCustomAttributesInternal_raw (icall-def.h:515)
==14405==    by 0x115604DD: ???
==14405==    by 0x11561E03: ???
==14405==    by 0x1593BD13: ???
==14405==    by 0x42C7A0: mono_jit_runtime_invoke (mini-runtime.c:3189)
==14405==    by 0x620F7F: do_runtime_invoke (object.c:2978)
==14405==
==14405== 12 bytes in 1 blocks are definitely lost in loss record 4,130 of 80,324
==14405==    at 0x4C2DB8F: malloc (in /usr/lib/valgrind/vgpreload_memcheck-amd64-linux.so)
==14405==    by 0x71A0FD: monoeg_malloc (gmem.c:108)
==14405==    by 0x685D38: create_custom_attr (custom-attrs.c:935)
==14405==    by 0x6863FE: create_custom_attr_into_array (custom-attrs.c:1006)
==14405==    by 0x6863FE: mono_custom_attrs_construct_by_type (custom-attrs.c:1516)
==14405==    by 0x689397: mono_reflection_get_custom_attrs_by_type_handle (custom-attrs.c:2208)
==14405==    by 0x5CF4F9: ves_icall_MonoCustomAttrs_GetCustomAttributesInternal (icall.c:8044)
==14405==    by 0x5D669E: ves_icall_MonoCustomAttrs_GetCustomAttributesInternal_raw (icall-def.h:515)
==14405==    by 0x115604DD: ???
==14405==    by 0x11CCA24B: ???
==14405==    by 0x6769F67: ???
==14405==    by 0xFFEFFDF4F: ???
==14405==    by 0x6769F67: ???
==14405==
==14405== 12 bytes in 1 blocks are definitely lost in loss record 4,131 of 80,324
==14405==    at 0x4C2DB8F: malloc (in /usr/lib/valgrind/vgpreload_memcheck-amd64-linux.so)
==14405==    by 0x71A0FD: monoeg_malloc (gmem.c:108)
==14405==    by 0x685D38: create_custom_attr (custom-attrs.c:935)
==14405==    by 0x6863FE: create_custom_attr_into_array (custom-attrs.c:1006)
==14405==    by 0x6863FE: mono_custom_attrs_construct_by_type (custom-attrs.c:1516)
==14405==    by 0x689397: mono_reflection_get_custom_attrs_by_type_handle (custom-attrs.c:2208)
==14405==    by 0x5CF4F9: ves_icall_MonoCustomAttrs_GetCustomAttributesInternal (icall.c:8044)
==14405==    by 0x5D669E: ves_icall_MonoCustomAttrs_GetCustomAttributesInternal_raw (icall-def.h:515)
==14405==    by 0x115604DD: ???
==14405==    by 0x11CCA24B: ???
==14405==    by 0x676F507: ???
==14405==    by 0xFFEFFDF4F: ???
==14405==    by 0x676F507: ???
==14405==
==14405== 12 bytes in 1 blocks are definitely lost in loss record 4,132 of 80,324
==14405==    at 0x4C2DB8F: malloc (in /usr/lib/valgrind/vgpreload_memcheck-amd64-linux.so)
==14405==    by 0x71A0FD: monoeg_malloc (gmem.c:108)
==14405==    by 0x685D38: create_custom_attr (custom-attrs.c:935)
==14405==    by 0x6863FE: create_custom_attr_into_array (custom-attrs.c:1006)
==14405==    by 0x6863FE: mono_custom_attrs_construct_by_type (custom-attrs.c:1516)
==14405==    by 0x689397: mono_reflection_get_custom_attrs_by_type_handle (custom-attrs.c:2208)
==14405==    by 0x5CF4F9: ves_icall_MonoCustomAttrs_GetCustomAttributesInternal (icall.c:8044)
==14405==    by 0x5D669E: ves_icall_MonoCustomAttrs_GetCustomAttributesInternal_raw (icall-def.h:515)
==14405==    by 0x115604DD: ???
==14405==    by 0x11561E03: ???
==14405==    by 0x1155D123: ???
==14405==    by 0x1BFD6D6B: ???
==14405==    by 0x1BFCEDBE: ???
==14405==
==14405== 24 bytes in 24 blocks are definitely lost in loss record 48,105 of 80,324
==14405==    at 0x4C2DB8F: malloc (in /usr/lib/valgrind/vgpreload_memcheck-amd64-linux.so)
==14405==    by 0x71A0FD: monoeg_malloc (gmem.c:108)
==14405==    by 0x684BFD: load_cattr_value (custom-attrs.c:310)
==14405==    by 0x685F85: create_custom_attr (custom-attrs.c:972)
==14405==    by 0x6863FE: create_custom_attr_into_array (custom-attrs.c:1006)
==14405==    by 0x6863FE: mono_custom_attrs_construct_by_type (custom-attrs.c:1516)
==14405==    by 0x689397: mono_reflection_get_custom_attrs_by_type_handle (custom-attrs.c:2208)
==14405==    by 0x5CF4F9: ves_icall_MonoCustomAttrs_GetCustomAttributesInternal (icall.c:8044)
==14405==    by 0x5D669E: ves_icall_MonoCustomAttrs_GetCustomAttributesInternal_raw (icall-def.h:515)
==14405==    by 0x115604DD: ???
==14405==
==14405== 33 bytes in 1 blocks are definitely lost in loss record 50,720 of 80,324
==14405==    at 0x4C2DB8F: malloc (in /usr/lib/valgrind/vgpreload_memcheck-amd64-linux.so)
==14405==    by 0x5A9AA17: __vasprintf_chk (vasprintf_chk.c:80)
==14405==    by 0x71AC89: monoeg_g_strdup_printf (gstr.c:192)
==14405==    by 0x597919: mono_assembly_load_corlib (assembly.c:4147)
==14405==    by 0x59641E: mono_assembly_load_full_gac_base_default (assembly.c:4298)
==14405==    by 0x59641E: mono_assembly_request_byname_nosearch (assembly.c:4274)
==14405==    by 0x59641E: mono_assembly_request_byname (assembly.c:4359)
==14405==    by 0x597AE1: mono_assembly_load (assembly.c:4419)
==14405==    by 0x4928A3: load_image (aot-runtime.c:305)
==14405==    by 0x493648: load_aot_module (aot-runtime.c:2413)
==14405==    by 0x594271: mono_assembly_invoke_load_hook (assembly.c:1751)
==14405==    by 0x594E31: mono_assembly_request_load_from (assembly.c:2897)
==14405==    by 0x597063: mono_assembly_request_open (assembly.c:2372)
==14405==    by 0x5977D6: load_in_path (assembly.c:776)
==14405==
==14405== 37 bytes in 1 blocks are definitely lost in loss record 51,028 of 80,324
==14405==    at 0x4C2DB8F: malloc (in /usr/lib/valgrind/vgpreload_memcheck-amd64-linux.so)
==14405==    by 0x5A9AA17: __vasprintf_chk (vasprintf_chk.c:80)
==14405==    by 0x71AC89: monoeg_g_strdup_printf (gstr.c:192)
==14405==    by 0x5B9CF4: mono_ppdb_load_file (debug-mono-ppdb.c:150)
==14405==    by 0x61AD97: mono_debug_open_image (mono-debug.c:283)
==14405==    by 0x61AECA: mono_debug_add_assembly (mono-debug.c:305)
==14405==    by 0x594271: mono_assembly_invoke_load_hook (assembly.c:1751)
==14405==    by 0x596F23: mono_assembly_request_open (assembly.c:2365)
==14405==    by 0x5977D6: load_in_path (assembly.c:776)
==14405==    by 0x5979E4: mono_assembly_load_corlib (assembly.c:4142)
==14405==    by 0x59641E: mono_assembly_load_full_gac_base_default (assembly.c:4298)
==14405==    by 0x59641E: mono_assembly_request_byname_nosearch (assembly.c:4274)
==14405==    by 0x59641E: mono_assembly_request_byname (assembly.c:4359)
==14405==    by 0x597AE1: mono_assembly_load (assembly.c:4419)
==14405==
==14405== 68 bytes in 1 blocks are definitely lost in loss record 60,683 of 80,324
==14405==    at 0x4C2DB8F: malloc (in /usr/lib/valgrind/vgpreload_memcheck-amd64-linux.so)
==14405==    by 0x71A0FD: monoeg_malloc (gmem.c:108)
==14405==    by 0x71A147: monoeg_g_memdup (gmem.c:82)
==14405==    by 0x7011E1: mono_dl_open (mono-dl.c:195)
==14405==    by 0x5EAB4F: cached_module_load.constprop.20 (loader.c:1145)
==14405==    by 0x5EC30A: mono_lookup_pinvoke_call (loader.c:1458)
==14405==    by 0x5F8945: mono_marshal_get_native_wrapper (marshal.c:3406)
==14405==    by 0x45709B: mono_method_to_ir (method-to-ir.c:7083)
==14405==    by 0x51E27F: mini_method_compile (mini.c:3488)
==14405==    by 0x51FFB3: mono_jit_compile_method_inner (mini.c:4076)
==14405==    by 0x42A75E: mono_jit_compile_method_with_opt (mini-runtime.c:2450)
==14405==    by 0x4AC824: common_call_trampoline (mini-trampolines.c:751)
==14405==
==14405== 84 bytes in 7 blocks are definitely lost in loss record 62,585 of 80,324
==14405==    at 0x4C2DB8F: malloc (in /usr/lib/valgrind/vgpreload_memcheck-amd64-linux.so)
==14405==    by 0x71A0FD: monoeg_malloc (gmem.c:108)
==14405==    by 0x685D38: create_custom_attr (custom-attrs.c:935)
==14405==    by 0x6863FE: create_custom_attr_into_array (custom-attrs.c:1006)
==14405==    by 0x6863FE: mono_custom_attrs_construct_by_type (custom-attrs.c:1516)
==14405==    by 0x689397: mono_reflection_get_custom_attrs_by_type_handle (custom-attrs.c:2208)
==14405==    by 0x5CF4F9: ves_icall_MonoCustomAttrs_GetCustomAttributesInternal (icall.c:8044)
==14405==    by 0x5D669E: ves_icall_MonoCustomAttrs_GetCustomAttributesInternal_raw (icall-def.h:515)
==14405==    by 0x115604DD: ???
==14405==    by 0x11CC9BE3: ???
==14405==
==14405== 112 bytes in 1 blocks are definitely lost in loss record 71,149 of 80,324
==14405==    at 0x4C2DB8F: malloc (in /usr/lib/valgrind/vgpreload_memcheck-amd64-linux.so)
==14405==    by 0x5A9AA17: __vasprintf_chk (vasprintf_chk.c:80)
==14405==    by 0x71AC89: monoeg_g_strdup_printf (gstr.c:192)
==14405==    by 0x5B9CF4: mono_ppdb_load_file (debug-mono-ppdb.c:150)
==14405==    by 0x61AD97: mono_debug_open_image (mono-debug.c:283)
==14405==    by 0x61AECA: mono_debug_add_assembly (mono-debug.c:305)
==14405==    by 0x594271: mono_assembly_invoke_load_hook (assembly.c:1751)
==14405==    by 0x594E31: mono_assembly_request_load_from (assembly.c:2897)
==14405==    by 0x597063: mono_assembly_request_open (assembly.c:2372)
==14405==    by 0x5968A1: mono_assembly_load_from_gac (assembly.c:4094)
==14405==    by 0x5968A1: mono_assembly_load_full_gac_base_default (assembly.c:4328)
==14405==    by 0x5968A1: mono_assembly_request_byname_nosearch (assembly.c:4274)
==14405==    by 0x5968A1: mono_assembly_request_byname (assembly.c:4359)
==14405==    by 0x5969B5: load_reference_by_aname_default_asmctx (assembly.c:1496)
==14405==    by 0x59863B: mono_assembly_load_reference (assembly.c:1644)
==14405==
==14405== 144 bytes in 2 blocks are definitely lost in loss record 72,019 of 80,324
==14405==    at 0x4C2FD5F: realloc (in /usr/lib/valgrind/vgpreload_memcheck-amd64-linux.so)
==14405==    by 0x5A9A9EC: __vasprintf_chk (vasprintf_chk.c:88)
==14405==    by 0x71AC89: monoeg_g_strdup_printf (gstr.c:192)
==14405==    by 0x5B9CF4: mono_ppdb_load_file (debug-mono-ppdb.c:150)
==14405==    by 0x61AD97: mono_debug_open_image (mono-debug.c:283)
==14405==    by 0x61AECA: mono_debug_add_assembly (mono-debug.c:305)
==14405==    by 0x594271: mono_assembly_invoke_load_hook (assembly.c:1751)
==14405==    by 0x594E31: mono_assembly_request_load_from (assembly.c:2897)
==14405==    by 0x597063: mono_assembly_request_open (assembly.c:2372)
==14405==    by 0x5968A1: mono_assembly_load_from_gac (assembly.c:4094)
==14405==    by 0x5968A1: mono_assembly_load_full_gac_base_default (assembly.c:4328)
==14405==    by 0x5968A1: mono_assembly_request_byname_nosearch (assembly.c:4274)
==14405==    by 0x5968A1: mono_assembly_request_byname (assembly.c:4359)
==14405==    by 0x58D443: ves_icall_System_AppDomain_LoadAssembly (appdomain.c:2523)
==14405==    by 0x5D28C1: ves_icall_System_AppDomain_LoadAssembly_raw (icall-def.h:186)
==14405==
==14405== 174 bytes in 2 blocks are definitely lost in loss record 72,443 of 80,324
==14405==    at 0x4C2FD5F: realloc (in /usr/lib/valgrind/vgpreload_memcheck-amd64-linux.so)
==14405==    by 0x5A9A9EC: __vasprintf_chk (vasprintf_chk.c:88)
==14405==    by 0x71AC89: monoeg_g_strdup_printf (gstr.c:192)
==14405==    by 0x5B9CF4: mono_ppdb_load_file (debug-mono-ppdb.c:150)
==14405==    by 0x61AD97: mono_debug_open_image (mono-debug.c:283)
==14405==    by 0x61AECA: mono_debug_add_assembly (mono-debug.c:305)
==14405==    by 0x594271: mono_assembly_invoke_load_hook (assembly.c:1751)
==14405==    by 0x594E31: mono_assembly_request_load_from (assembly.c:2897)
==14405==    by 0x597063: mono_assembly_request_open (assembly.c:2372)
==14405==    by 0x5968A1: mono_assembly_load_from_gac (assembly.c:4094)
==14405==    by 0x5968A1: mono_assembly_load_full_gac_base_default (assembly.c:4328)
==14405==    by 0x5968A1: mono_assembly_request_byname_nosearch (assembly.c:4274)
==14405==    by 0x5968A1: mono_assembly_request_byname (assembly.c:4359)
==14405==    by 0x597AE1: mono_assembly_load (assembly.c:4419)
==14405==    by 0x5C2A8B: type_from_parsed_name (icall.c:1442)
==14405==    by 0x5C2A8B: ves_icall_System_RuntimeTypeHandle_internal_from_name (icall.c:1502)
==14405==
==14405== 240 bytes in 24 blocks are definitely lost in loss record 73,646 of 80,324
==14405==    at 0x4C2DB8F: malloc (in /usr/lib/valgrind/vgpreload_memcheck-amd64-linux.so)
==14405==    by 0x71A0FD: monoeg_malloc (gmem.c:108)
==14405==    by 0x685D38: create_custom_attr (custom-attrs.c:935)
==14405==    by 0x6863FE: create_custom_attr_into_array (custom-attrs.c:1006)
==14405==    by 0x6863FE: mono_custom_attrs_construct_by_type (custom-attrs.c:1516)
==14405==    by 0x689397: mono_reflection_get_custom_attrs_by_type_handle (custom-attrs.c:2208)
==14405==    by 0x5CF4F9: ves_icall_MonoCustomAttrs_GetCustomAttributesInternal (icall.c:8044)
==14405==    by 0x5D669E: ves_icall_MonoCustomAttrs_GetCustomAttributesInternal_raw (icall-def.h:515)
==14405==    by 0x115604DD: ???
==14405==
==14405== 288 bytes in 1 blocks are possibly lost in loss record 74,206 of 80,324
==14405==    at 0x4C2FB55: calloc (in /usr/lib/valgrind/vgpreload_memcheck-amd64-linux.so)
==14405==    by 0x40138A4: allocate_dtv (dl-tls.c:322)
==14405==    by 0x40138A4: _dl_allocate_tls (dl-tls.c:539)
==14405==    by 0x555726E: allocate_stack (allocatestack.c:588)
==14405==    by 0x555726E: pthread_create@@GLIBC_2.2.5 (pthread_create.c:539)
==14405==    by 0x711C40: mono_native_thread_create (mono-threads-posix.c:211)
==14405==    by 0x6F7CF6: sgen_thread_pool_start (sgen-thread-pool.c:288)
==14405==    by 0x6CC8D2: sgen_gc_init (sgen-gc.c:3733)
==14405==    by 0x6A82C2: mono_gc_base_init (sgen-mono.c:2923)
==14405==    by 0x58F103: mono_init_internal (domain.c:535)
==14405==    by 0x430342: mini_init (mini-runtime.c:4494)
==14405==    by 0x4750D0: mono_main (driver.c:2445)
==14405==    by 0x42714A: mono_main_with_options (main.c:50)
==14405==    by 0x42714A: main (main.c:406)
==14405==
==14405== 288 bytes in 1 blocks are possibly lost in loss record 74,207 of 80,324
==14405==    at 0x4C2FB55: calloc (in /usr/lib/valgrind/vgpreload_memcheck-amd64-linux.so)
==14405==    by 0x40138A4: allocate_dtv (dl-tls.c:322)
==14405==    by 0x40138A4: _dl_allocate_tls (dl-tls.c:539)
==14405==    by 0x555726E: allocate_stack (allocatestack.c:588)
==14405==    by 0x555726E: pthread_create@@GLIBC_2.2.5 (pthread_create.c:539)
==14405==    by 0x6A788A: mono_gc_pthread_create (sgen-mono.c:2327)
==14405==    by 0x7119C2: mono_thread_platform_create_thread (mono-threads-posix.c:83)
==14405==    by 0x64A2C7: create_thread (threads.c:1311)
==14405==    by 0x64A81F: mono_thread_create_internal (threads.c:1398)
==14405==    by 0x69AD36: mono_gc_init_finalizer_thread (gc.c:959)
==14405==    by 0x69AD36: mono_gc_init (gc.c:1001)
==14405==    by 0x589BAB: mono_runtime_init_checked (appdomain.c:321)
==14405==    by 0x430289: mini_init (mini-runtime.c:4560)
==14405==    by 0x4750D0: mono_main (driver.c:2445)
==14405==    by 0x42714A: mono_main_with_options (main.c:50)
==14405==    by 0x42714A: main (main.c:406)
==14405==
==14405== 288 bytes in 1 blocks are possibly lost in loss record 74,208 of 80,324
==14405==    at 0x4C2FB55: calloc (in /usr/lib/valgrind/vgpreload_memcheck-amd64-linux.so)
==14405==    by 0x40138A4: allocate_dtv (dl-tls.c:322)
==14405==    by 0x40138A4: _dl_allocate_tls (dl-tls.c:539)
==14405==    by 0x555726E: allocate_stack (allocatestack.c:588)
==14405==    by 0x555726E: pthread_create@@GLIBC_2.2.5 (pthread_create.c:539)
==14405==    by 0x6A788A: mono_gc_pthread_create (sgen-mono.c:2327)
==14405==    by 0x7119C2: mono_thread_platform_create_thread (mono-threads-posix.c:83)
==14405==    by 0x64A2C7: create_thread (threads.c:1311)
==14405==    by 0x64A81F: mono_thread_create_internal (threads.c:1398)
==14405==    by 0x6523C2: initialize (threadpool-io.c:585)
==14405==    by 0x6523C2: mono_lazy_initialize (mono-lazy-init.h:77)
==14405==    by 0x6523C2: ves_icall_System_IOSelector_Add (threadpool-io.c:618)
==14405==    by 0x171BC07D: ???
==14405==    by 0x66A043F: ???
==14405==    by 0x66A04F7: ???
==14405==    by 0x65097AF: ???
==14405==
==14405== 288 bytes in 1 blocks are possibly lost in loss record 74,209 of 80,324
==14405==    at 0x4C2FB55: calloc (in /usr/lib/valgrind/vgpreload_memcheck-amd64-linux.so)
==14405==    by 0x40138A4: allocate_dtv (dl-tls.c:322)
==14405==    by 0x40138A4: _dl_allocate_tls (dl-tls.c:539)
==14405==    by 0x555726E: allocate_stack (allocatestack.c:588)
==14405==    by 0x555726E: pthread_create@@GLIBC_2.2.5 (pthread_create.c:539)
==14405==    by 0x6A788A: mono_gc_pthread_create (sgen-mono.c:2327)
==14405==    by 0x7119C2: mono_thread_platform_create_thread (mono-threads-posix.c:83)
==14405==    by 0x64A2C7: create_thread (threads.c:1311)
==14405==    by 0x64AB3C: ves_icall_System_Threading_Thread_Thread_internal (threads.c:1624)
==14405==    by 0x5E2F05: ves_icall_System_Threading_Thread_Thread_internal_raw (icall-def.h:1067)
==14405==    by 0x171D6A73: ???
==14405==    by 0x42C7A0: mono_jit_runtime_invoke (mini-runtime.c:3189)
==14405==    by 0x620F7F: do_runtime_invoke (object.c:2978)
==14405==    by 0x627A93: mono_runtime_class_init_full (object.c:521)
==14405==
==14405== 288 bytes in 1 blocks are possibly lost in loss record 74,210 of 80,324
==14405==    at 0x4C2FB55: calloc (in /usr/lib/valgrind/vgpreload_memcheck-amd64-linux.so)
==14405==    by 0x40138A4: allocate_dtv (dl-tls.c:322)
==14405==    by 0x40138A4: _dl_allocate_tls (dl-tls.c:539)
==14405==    by 0x555726E: allocate_stack (allocatestack.c:588)
==14405==    by 0x555726E: pthread_create@@GLIBC_2.2.5 (pthread_create.c:539)
==14405==    by 0x6A788A: mono_gc_pthread_create (sgen-mono.c:2327)
==14405==    by 0x7119C2: mono_thread_platform_create_thread (mono-threads-posix.c:83)
==14405==    by 0x64A2C7: create_thread (threads.c:1311)
==14405==    by 0x64A81F: mono_thread_create_internal (threads.c:1398)
==14405==    by 0x6AF5D1: worker_try_create (threadpool-worker-default.c:561)
==14405==    by 0x6AFD97: monitor_thread (threadpool-worker-default.c:754)
==14405==    by 0x64C7D0: start_wrapper_internal (threads.c:1174)
==14405==    by 0x64C7D0: start_wrapper (threads.c:1234)
==14405==    by 0x55566B9: start_thread (pthread_create.c:333)
==14405==    by 0x5A8941C: clone (clone.S:109)
==14405==
==14405== 288 (256 direct, 32 indirect) bytes in 1 blocks are definitely lost in loss record 74,211 of 80,324
==14405==    at 0x4C2DB8F: malloc (in /usr/lib/valgrind/vgpreload_memcheck-amd64-linux.so)
==14405==    by 0x201930B9: ??? (in /usr/lib/x86_64-linux-gnu/libfontconfig.so.1.9.0)
==14405==    by 0x20193829: ??? (in /usr/lib/x86_64-linux-gnu/libfontconfig.so.1.9.0)
==14405==    by 0x20194D4A: ??? (in /usr/lib/x86_64-linux-gnu/libfontconfig.so.1.9.0)
==14405==    by 0x2019A19B: ??? (in /usr/lib/x86_64-linux-gnu/libfontconfig.so.1.9.0)
==14405==    by 0x21A8FA9B: ??? (in /lib/x86_64-linux-gnu/libexpat.so.1.6.0)
==14405==    by 0x21A903AB: ??? (in /lib/x86_64-linux-gnu/libexpat.so.1.6.0)
==14405==    by 0x21A91CCD: ??? (in /lib/x86_64-linux-gnu/libexpat.so.1.6.0)
==14405==    by 0x21A92424: ??? (in /lib/x86_64-linux-gnu/libexpat.so.1.6.0)
==14405==    by 0x21A9472A: XML_ParseBuffer (in /lib/x86_64-linux-gnu/libexpat.so.1.6.0)
==14405==    by 0x2019952A: FcConfigParseAndLoad (in /usr/lib/x86_64-linux-gnu/libfontconfig.so.1.9.0)
==14405==    by 0x20199836: FcConfigParseAndLoad (in /usr/lib/x86_64-linux-gnu/libfontconfig.so.1.9.0)
==14405==
==14405== 304 bytes in 1 blocks are possibly lost in loss record 74,287 of 80,324
==14405==    at 0x4C2FB55: calloc (in /usr/lib/valgrind/vgpreload_memcheck-amd64-linux.so)
==14405==    by 0x40138A4: allocate_dtv (dl-tls.c:322)
==14405==    by 0x40138A4: _dl_allocate_tls (dl-tls.c:539)
==14405==    by 0x555726E: allocate_stack (allocatestack.c:588)
==14405==    by 0x555726E: pthread_create@@GLIBC_2.2.5 (pthread_create.c:539)
==14405==    by 0x6A788A: mono_gc_pthread_create (sgen-mono.c:2327)
==14405==    by 0x7119C2: mono_thread_platform_create_thread (mono-threads-posix.c:83)
==14405==    by 0x64A2C7: create_thread (threads.c:1311)
==14405==    by 0x64A81F: mono_thread_create_internal (threads.c:1398)
==14405==    by 0x6AFA67: monitor_ensure_running (threadpool-worker-default.c:790)
==14405==    by 0x6AFA67: worker_request (threadpool-worker-default.c:597)
==14405==    by 0x6B03C4: mono_threadpool_worker_request (threadpool-worker-default.c:354)
==14405==    by 0x64FE9C: ves_icall_System_Threading_ThreadPool_RequestWorkerThread (threadpool.c:804)
==14405==    by 0x5E3727: ves_icall_System_Threading_ThreadPool_RequestWorkerThread_raw (icall-def.h:1109)
==14405==    by 0x171BDA62: ???
==14405==
==14405== 356 bytes in 3 blocks are definitely lost in loss record 74,733 of 80,324
==14405==    at 0x4C2DB8F: malloc (in /usr/lib/valgrind/vgpreload_memcheck-amd64-linux.so)
==14405==    by 0x5A9AA17: __vasprintf_chk (vasprintf_chk.c:80)
==14405==    by 0x71AC89: monoeg_g_strdup_printf (gstr.c:192)
==14405==    by 0x5B9CF4: mono_ppdb_load_file (debug-mono-ppdb.c:150)
==14405==    by 0x61AD97: mono_debug_open_image (mono-debug.c:283)
==14405==    by 0x61AECA: mono_debug_add_assembly (mono-debug.c:305)
==14405==    by 0x594271: mono_assembly_invoke_load_hook (assembly.c:1751)
==14405==    by 0x594E31: mono_assembly_request_load_from (assembly.c:2897)
==14405==    by 0x597063: mono_assembly_request_open (assembly.c:2372)
==14405==    by 0x5968A1: mono_assembly_load_from_gac (assembly.c:4094)
==14405==    by 0x5968A1: mono_assembly_load_full_gac_base_default (assembly.c:4328)
==14405==    by 0x5968A1: mono_assembly_request_byname_nosearch (assembly.c:4274)
==14405==    by 0x5968A1: mono_assembly_request_byname (assembly.c:4359)
==14405==    by 0x597AE1: mono_assembly_load (assembly.c:4419)
==14405==    by 0x4928A3: load_image (aot-runtime.c:305)
==14405==
==14405== 768 bytes in 2 blocks are possibly lost in loss record 76,498 of 80,324
==14405==    at 0x4C2FFC6: memalign (in /usr/lib/valgrind/vgpreload_memcheck-amd64-linux.so)
==14405==    by 0x4012FF7: allocate_and_init (dl-tls.c:603)
==14405==    by 0x4012FF7: tls_get_addr_tail (dl-tls.c:791)
==14405==    by 0x206795DE: ??? (in /usr/lib/x86_64-linux-gnu/libpixman-1.so.0.33.6)
==14405==    by 0x20633EA0: pixman_image_composite32 (in /usr/lib/x86_64-linux-gnu/libpixman-1.so.0.33.6)
==14405==    by 0x1F0A9A53: ??? (in /usr/lib/x86_64-linux-gnu/libcairo.so.2.11400.6)
==14405==    by 0x1F0E3AE9: ??? (in /usr/lib/x86_64-linux-gnu/libcairo.so.2.11400.6)
==14405==    by 0x1F0E40AD: ??? (in /usr/lib/x86_64-linux-gnu/libcairo.so.2.11400.6)
==14405==    by 0x1F0E43C8: ??? (in /usr/lib/x86_64-linux-gnu/libcairo.so.2.11400.6)
==14405==    by 0x1F09E778: ??? (in /usr/lib/x86_64-linux-gnu/libcairo.so.2.11400.6)
==14405==    by 0x1F0E72B0: ??? (in /usr/lib/x86_64-linux-gnu/libcairo.so.2.11400.6)
==14405==    by 0x1F0A70BE: ??? (in /usr/lib/x86_64-linux-gnu/libcairo.so.2.11400.6)
==14405==    by 0x1F0A0278: ??? (in /usr/lib/x86_64-linux-gnu/libcairo.so.2.11400.6)
==14405==
==14405== 864 bytes in 3 blocks are possibly lost in loss record 76,602 of 80,324
==14405==    at 0x4C2FB55: calloc (in /usr/lib/valgrind/vgpreload_memcheck-amd64-linux.so)
==14405==    by 0x40138A4: allocate_dtv (dl-tls.c:322)
==14405==    by 0x40138A4: _dl_allocate_tls (dl-tls.c:539)
==14405==    by 0x555726E: allocate_stack (allocatestack.c:588)
==14405==    by 0x555726E: pthread_create@@GLIBC_2.2.5 (pthread_create.c:539)
==14405==    by 0x6A788A: mono_gc_pthread_create (sgen-mono.c:2327)
==14405==    by 0x7119C2: mono_thread_platform_create_thread (mono-threads-posix.c:83)
==14405==    by 0x64A2C7: create_thread (threads.c:1311)
==14405==    by 0x64AB3C: ves_icall_System_Threading_Thread_Thread_internal (threads.c:1624)
==14405==    by 0x5E2F05: ves_icall_System_Threading_Thread_Thread_internal_raw (icall-def.h:1067)
==14405==    by 0x171D6A73: ???
==14405==    by 0xBBA36FC: Radarr_Host_NzbDroneServiceFactory_Start (in /home/leo/Radarr/_output_mono/Radarr.Host.dll.so)
==14405==    by 0xBBA4BAA: Radarr_Host_Router_Route_Radarr_Host_ApplicationModes (in /home/leo/Radarr/_output_mono/Radarr.Host.dll.so)
==14405==    by 0xBBA3BCA: Radarr_Host_Bootstrap_Start_Radarr_Host_ApplicationModes_NzbDrone_Common_EnvironmentInfo_StartupContext (in /home/leo/Radarr/_output_mono/Radarr.Host.dll.so)
==14405==
==14405== 936 bytes in 1 blocks are definitely lost in loss record 76,848 of 80,324
==14405==    at 0x4C2FFC6: memalign (in /usr/lib/valgrind/vgpreload_memcheck-amd64-linux.so)
==14405==    by 0x1DDB204E: ???
==14405==    by 0x6546C8F: ???
==14405==    by 0x877EFD6FF: ???
==14405==    by 0x878135FFF: ???
==14405==    by 0x87813A2FF: ???
==14405==    by 0x6546C8FFF: ???
==14405==    by 0x6546CBFFF: ???
==14405==
==14405== 1,362 bytes in 16 blocks are definitely lost in loss record 77,519 of 80,324
==14405==    at 0x4C2FD5F: realloc (in /usr/lib/valgrind/vgpreload_memcheck-amd64-linux.so)
==14405==    by 0x5A9A9EC: __vasprintf_chk (vasprintf_chk.c:88)
==14405==    by 0x71AC89: monoeg_g_strdup_printf (gstr.c:192)
==14405==    by 0x5B9CF4: mono_ppdb_load_file (debug-mono-ppdb.c:150)
==14405==    by 0x61AD97: mono_debug_open_image (mono-debug.c:283)
==14405==    by 0x61AECA: mono_debug_add_assembly (mono-debug.c:305)
==14405==    by 0x594271: mono_assembly_invoke_load_hook (assembly.c:1751)
==14405==    by 0x594E31: mono_assembly_request_load_from (assembly.c:2897)
==14405==    by 0x597063: mono_assembly_request_open (assembly.c:2372)
==14405==    by 0x5968A1: mono_assembly_load_from_gac (assembly.c:4094)
==14405==    by 0x5968A1: mono_assembly_load_full_gac_base_default (assembly.c:4328)
==14405==    by 0x5968A1: mono_assembly_request_byname_nosearch (assembly.c:4274)
==14405==    by 0x5968A1: mono_assembly_request_byname (assembly.c:4359)
==14405==    by 0x597AE1: mono_assembly_load (assembly.c:4419)
==14405==    by 0x4928A3: load_image (aot-runtime.c:305)
==14405==
==14405== 4,096 bytes in 14 blocks are possibly lost in loss record 78,341 of 80,324
==14405==    at 0x4C2FB55: calloc (in /usr/lib/valgrind/vgpreload_memcheck-amd64-linux.so)
==14405==    by 0x40138A4: allocate_dtv (dl-tls.c:322)
==14405==    by 0x40138A4: _dl_allocate_tls (dl-tls.c:539)
==14405==    by 0x555726E: allocate_stack (allocatestack.c:588)
==14405==    by 0x555726E: pthread_create@@GLIBC_2.2.5 (pthread_create.c:539)
==14405==    by 0x6A788A: mono_gc_pthread_create (sgen-mono.c:2327)
==14405==    by 0x7119C2: mono_thread_platform_create_thread (mono-threads-posix.c:83)
==14405==    by 0x64A2C7: create_thread (threads.c:1311)
==14405==    by 0x64A81F: mono_thread_create_internal (threads.c:1398)
==14405==    by 0x6AF5D1: worker_try_create (threadpool-worker-default.c:561)
==14405==    by 0x6AFA95: worker_request (threadpool-worker-default.c:605)
==14405==    by 0x6B03C4: mono_threadpool_worker_request (threadpool-worker-default.c:354)
==14405==    by 0x64FE9C: ves_icall_System_Threading_ThreadPool_RequestWorkerThread (threadpool.c:804)
==14405==    by 0x5E3727: ves_icall_System_Threading_ThreadPool_RequestWorkerThread_raw (icall-def.h:1109)
==14405==
==14405== 4,104 bytes in 1 blocks are possibly lost in loss record 78,344 of 80,324
==14405==    at 0x4C2DB8F: malloc (in /usr/lib/valgrind/vgpreload_memcheck-amd64-linux.so)
==14405==    by 0x15A36136: sqlite3MemMalloc (in /usr/lib/x86_64-linux-gnu/libsqlite3.so.0.8.6)
==14405==    by 0x15A1195B: sqlite3Malloc (in /usr/lib/x86_64-linux-gnu/libsqlite3.so.0.8.6)
==14405==    by 0x15A14EA6: pcache1Alloc (in /usr/lib/x86_64-linux-gnu/libsqlite3.so.0.8.6)
==14405==    by 0x15A346F2: sqlite3BtreeCursor (in /usr/lib/x86_64-linux-gnu/libsqlite3.so.0.8.6)
==14405==    by 0x15A6DA02: sqlite3VdbeExec (in /usr/lib/x86_64-linux-gnu/libsqlite3.so.0.8.6)
==14405==    by 0x15A771A6: sqlite3_step (in /usr/lib/x86_64-linux-gnu/libsqlite3.so.0.8.6)
==14405==    by 0x161EDF84: ???
==14405==    by 0x752F: ???
==14405==    by 0x313859: ???
==14405==
==14405== 4,104 bytes in 1 blocks are possibly lost in loss record 78,345 of 80,324
==14405==    at 0x4C2DB8F: malloc (in /usr/lib/valgrind/vgpreload_memcheck-amd64-linux.so)
==14405==    by 0x15A36136: sqlite3MemMalloc (in /usr/lib/x86_64-linux-gnu/libsqlite3.so.0.8.6)
==14405==    by 0x15A1195B: sqlite3Malloc (in /usr/lib/x86_64-linux-gnu/libsqlite3.so.0.8.6)
==14405==    by 0x15A14EA6: pcache1Alloc (in /usr/lib/x86_64-linux-gnu/libsqlite3.so.0.8.6)
==14405==    by 0x15A346F2: sqlite3BtreeCursor (in /usr/lib/x86_64-linux-gnu/libsqlite3.so.0.8.6)
==14405==    by 0x15A6DA02: sqlite3VdbeExec (in /usr/lib/x86_64-linux-gnu/libsqlite3.so.0.8.6)
==14405==    by 0x15A771A6: sqlite3_step (in /usr/lib/x86_64-linux-gnu/libsqlite3.so.0.8.6)
==14405==    by 0x161EDF84: ???
==14405==    by 0x752F: ???
==14405==    by 0x375A29: ???
==14405==
==14405== LEAK SUMMARY:
==14405==    definitely lost: 3,898 bytes in 92 blocks
==14405==    indirectly lost: 32 bytes in 1 blocks
==14405==      possibly lost: 15,680 bytes in 27 blocks
==14405==    still reachable: 51,041,742 bytes in 325,610 blocks
==14405==                       of which reachable via heuristic:
==14405==                         length64           : 1,444,496 bytes in 1,290 blocks
==14405==         suppressed: 0 bytes in 0 blocks
==14405== Reachable blocks (those to which a pointer was found) are not shown.
==14405== To see them, rerun with: --leak-check=full --show-leak-kinds=all
==14405==
==14405== Use --track-origins=yes to see where uninitialised values come from
==14405== ERROR SUMMARY: 1969 errors from 59 contexts (suppressed: 0 from 0)
==14405==
==14405== 1 errors in context 1 of 59:
==14405== Thread 32 Thread Pool Wor:
==14405== Invalid write of size 8
==14405==    at 0x70A7EE: mono_sigctx_to_monoctx (mono-context.c:212)
==14405==    by 0x5123A0: mono_arch_handle_altstack_exception (exceptions-amd64.c:908)
==14405==    by 0x42D483: mono_sigsegv_signal_handler_debug (mini-runtime.c:3546)
==14405==    by 0x556038F: ??? (in /lib/x86_64-linux-gnu/libpthread-2.23.so)
==14405==    by 0xBF82823: NzbDrone_Core_Instrumentation_DatabaseTarget_Handle_NzbDrone_Core_Lifecycle_ApplicationShutdownRequested (in /home/leo/Radarr/_output_mono/NzbDrone.Core.dll.so)
==14405==    by 0xBF783D0: NzbDrone_Core_Messaging_Events_EventAggregator_PublishEvent_TEvent_REF_TEvent_REF (in /home/leo/Radarr/_output_mono/NzbDrone.Core.dll.so)
==14405==    by 0xBF7F8F0: NzbDrone_Core_Lifecycle_LifecycleService_Shutdown (in /home/leo/Radarr/_output_mono/NzbDrone.Core.dll.so)
==14405==    by 0x12458736: NzbDrone_Api_System_SystemModule_Shutdown (in /home/leo/Radarr/_output_mono/NzbDrone.Api.dll.so)
==14405==    by 0x12458844: NzbDrone_Api_System_SystemModule___ctorb__6_2_object (in /home/leo/Radarr/_output_mono/NzbDrone.Api.dll.so)
==14405==    by 0x171AB391: ???
==14405==    by 0xF2F1F92: Nancy_Routing_Route_Invoke_Nancy_DynamicDictionary_System_Threading_CancellationToken (in /home/leo/Radarr/_output_mono/Nancy.dll.so)
==14405==    by 0xF2F1577: Nancy_Routing_DefaultRouteInvoker_Invoke_Nancy_Routing_Route_System_Threading_CancellationToken_Nancy_DynamicDictionary_Nancy_NancyContext (in /home/leo/Radarr/_output_mono/Nancy.dll.so)
==14405==  Address 0x1d3ff818 is on thread 32's stack
==14405==
==14405==
==14405== 1 errors in context 2 of 59:
==14405== Invalid write of size 8
==14405==    at 0x70A7E7: mono_sigctx_to_monoctx (mono-context.c:212)
==14405==    by 0x5123A0: mono_arch_handle_altstack_exception (exceptions-amd64.c:908)
==14405==    by 0x42D483: mono_sigsegv_signal_handler_debug (mini-runtime.c:3546)
==14405==    by 0x556038F: ??? (in /lib/x86_64-linux-gnu/libpthread-2.23.so)
==14405==    by 0xBF82823: NzbDrone_Core_Instrumentation_DatabaseTarget_Handle_NzbDrone_Core_Lifecycle_ApplicationShutdownRequested (in /home/leo/Radarr/_output_mono/NzbDrone.Core.dll.so)
==14405==    by 0xBF783D0: NzbDrone_Core_Messaging_Events_EventAggregator_PublishEvent_TEvent_REF_TEvent_REF (in /home/leo/Radarr/_output_mono/NzbDrone.Core.dll.so)
==14405==    by 0xBF7F8F0: NzbDrone_Core_Lifecycle_LifecycleService_Shutdown (in /home/leo/Radarr/_output_mono/NzbDrone.Core.dll.so)
==14405==    by 0x12458736: NzbDrone_Api_System_SystemModule_Shutdown (in /home/leo/Radarr/_output_mono/NzbDrone.Api.dll.so)
==14405==    by 0x12458844: NzbDrone_Api_System_SystemModule___ctorb__6_2_object (in /home/leo/Radarr/_output_mono/NzbDrone.Api.dll.so)
==14405==    by 0x171AB391: ???
==14405==    by 0xF2F1F92: Nancy_Routing_Route_Invoke_Nancy_DynamicDictionary_System_Threading_CancellationToken (in /home/leo/Radarr/_output_mono/Nancy.dll.so)
==14405==    by 0xF2F1577: Nancy_Routing_DefaultRouteInvoker_Invoke_Nancy_Routing_Route_System_Threading_CancellationToken_Nancy_DynamicDictionary_Nancy_NancyContext (in /home/leo/Radarr/_output_mono/Nancy.dll.so)
==14405==  Address 0x1d3ff820 is on thread 32's stack
==14405==
==14405==
==14405== 1 errors in context 3 of 59:
==14405== Invalid write of size 8
==14405==    at 0x70A7CB: mono_sigctx_to_monoctx (mono-context.c:211)
==14405==    by 0x5123A0: mono_arch_handle_altstack_exception (exceptions-amd64.c:908)
==14405==    by 0x42D483: mono_sigsegv_signal_handler_debug (mini-runtime.c:3546)
==14405==    by 0x556038F: ??? (in /lib/x86_64-linux-gnu/libpthread-2.23.so)
==14405==    by 0xBF82823: NzbDrone_Core_Instrumentation_DatabaseTarget_Handle_NzbDrone_Core_Lifecycle_ApplicationShutdownRequested (in /home/leo/Radarr/_output_mono/NzbDrone.Core.dll.so)
==14405==    by 0xBF783D0: NzbDrone_Core_Messaging_Events_EventAggregator_PublishEvent_TEvent_REF_TEvent_REF (in /home/leo/Radarr/_output_mono/NzbDrone.Core.dll.so)
==14405==    by 0xBF7F8F0: NzbDrone_Core_Lifecycle_LifecycleService_Shutdown (in /home/leo/Radarr/_output_mono/NzbDrone.Core.dll.so)
==14405==    by 0x12458736: NzbDrone_Api_System_SystemModule_Shutdown (in /home/leo/Radarr/_output_mono/NzbDrone.Api.dll.so)
==14405==    by 0x12458844: NzbDrone_Api_System_SystemModule___ctorb__6_2_object (in /home/leo/Radarr/_output_mono/NzbDrone.Api.dll.so)
==14405==    by 0x171AB391: ???
==14405==    by 0xF2F1F92: Nancy_Routing_Route_Invoke_Nancy_DynamicDictionary_System_Threading_CancellationToken (in /home/leo/Radarr/_output_mono/Nancy.dll.so)
==14405==    by 0xF2F1577: Nancy_Routing_DefaultRouteInvoker_Invoke_Nancy_Routing_Route_System_Threading_CancellationToken_Nancy_DynamicDictionary_Nancy_NancyContext (in /home/leo/Radarr/_output_mono/Nancy.dll.so)
==14405==  Address 0x1d3ff808 is on thread 32's stack
==14405==
==14405==
==14405== 1 errors in context 4 of 59:
==14405== Invalid write of size 8
==14405==    at 0x70A7C4: mono_sigctx_to_monoctx (mono-context.c:211)
==14405==    by 0x5123A0: mono_arch_handle_altstack_exception (exceptions-amd64.c:908)
==14405==    by 0x42D483: mono_sigsegv_signal_handler_debug (mini-runtime.c:3546)
==14405==    by 0x556038F: ??? (in /lib/x86_64-linux-gnu/libpthread-2.23.so)
==14405==    by 0xBF82823: NzbDrone_Core_Instrumentation_DatabaseTarget_Handle_NzbDrone_Core_Lifecycle_ApplicationShutdownRequested (in /home/leo/Radarr/_output_mono/NzbDrone.Core.dll.so)
==14405==    by 0xBF783D0: NzbDrone_Core_Messaging_Events_EventAggregator_PublishEvent_TEvent_REF_TEvent_REF (in /home/leo/Radarr/_output_mono/NzbDrone.Core.dll.so)
==14405==    by 0xBF7F8F0: NzbDrone_Core_Lifecycle_LifecycleService_Shutdown (in /home/leo/Radarr/_output_mono/NzbDrone.Core.dll.so)
==14405==    by 0x12458736: NzbDrone_Api_System_SystemModule_Shutdown (in /home/leo/Radarr/_output_mono/NzbDrone.Api.dll.so)
==14405==    by 0x12458844: NzbDrone_Api_System_SystemModule___ctorb__6_2_object (in /home/leo/Radarr/_output_mono/NzbDrone.Api.dll.so)
==14405==    by 0x171AB391: ???
==14405==    by 0xF2F1F92: Nancy_Routing_Route_Invoke_Nancy_DynamicDictionary_System_Threading_CancellationToken (in /home/leo/Radarr/_output_mono/Nancy.dll.so)
==14405==    by 0xF2F1577: Nancy_Routing_DefaultRouteInvoker_Invoke_Nancy_Routing_Route_System_Threading_CancellationToken_Nancy_DynamicDictionary_Nancy_NancyContext (in /home/leo/Radarr/_output_mono/Nancy.dll.so)
==14405==  Address 0x1d3ff810 is on thread 32's stack
==14405==
==14405==
==14405== 1 errors in context 5 of 59:
==14405== Invalid write of size 8
==14405==    at 0x70A7A8: mono_sigctx_to_monoctx (mono-context.c:210)
==14405==    by 0x5123A0: mono_arch_handle_altstack_exception (exceptions-amd64.c:908)
==14405==    by 0x42D483: mono_sigsegv_signal_handler_debug (mini-runtime.c:3546)
==14405==    by 0x556038F: ??? (in /lib/x86_64-linux-gnu/libpthread-2.23.so)
==14405==    by 0xBF82823: NzbDrone_Core_Instrumentation_DatabaseTarget_Handle_NzbDrone_Core_Lifecycle_ApplicationShutdownRequested (in /home/leo/Radarr/_output_mono/NzbDrone.Core.dll.so)
==14405==    by 0xBF783D0: NzbDrone_Core_Messaging_Events_EventAggregator_PublishEvent_TEvent_REF_TEvent_REF (in /home/leo/Radarr/_output_mono/NzbDrone.Core.dll.so)
==14405==    by 0xBF7F8F0: NzbDrone_Core_Lifecycle_LifecycleService_Shutdown (in /home/leo/Radarr/_output_mono/NzbDrone.Core.dll.so)
==14405==    by 0x12458736: NzbDrone_Api_System_SystemModule_Shutdown (in /home/leo/Radarr/_output_mono/NzbDrone.Api.dll.so)
==14405==    by 0x12458844: NzbDrone_Api_System_SystemModule___ctorb__6_2_object (in /home/leo/Radarr/_output_mono/NzbDrone.Api.dll.so)
==14405==    by 0x171AB391: ???
==14405==    by 0xF2F1F92: Nancy_Routing_Route_Invoke_Nancy_DynamicDictionary_System_Threading_CancellationToken (in /home/leo/Radarr/_output_mono/Nancy.dll.so)
==14405==    by 0xF2F1577: Nancy_Routing_DefaultRouteInvoker_Invoke_Nancy_Routing_Route_System_Threading_CancellationToken_Nancy_DynamicDictionary_Nancy_NancyContext (in /home/leo/Radarr/_output_mono/Nancy.dll.so)
==14405==  Address 0x1d3ff7f8 is on thread 32's stack
==14405==
==14405==
==14405== 1 errors in context 6 of 59:
==14405== Invalid write of size 8
==14405==    at 0x70A7A1: mono_sigctx_to_monoctx (mono-context.c:210)
==14405==    by 0x5123A0: mono_arch_handle_altstack_exception (exceptions-amd64.c:908)
==14405==    by 0x42D483: mono_sigsegv_signal_handler_debug (mini-runtime.c:3546)
==14405==    by 0x556038F: ??? (in /lib/x86_64-linux-gnu/libpthread-2.23.so)
==14405==    by 0xBF82823: NzbDrone_Core_Instrumentation_DatabaseTarget_Handle_NzbDrone_Core_Lifecycle_ApplicationShutdownRequested (in /home/leo/Radarr/_output_mono/NzbDrone.Core.dll.so)
==14405==    by 0xBF783D0: NzbDrone_Core_Messaging_Events_EventAggregator_PublishEvent_TEvent_REF_TEvent_REF (in /home/leo/Radarr/_output_mono/NzbDrone.Core.dll.so)
==14405==    by 0xBF7F8F0: NzbDrone_Core_Lifecycle_LifecycleService_Shutdown (in /home/leo/Radarr/_output_mono/NzbDrone.Core.dll.so)
==14405==    by 0x12458736: NzbDrone_Api_System_SystemModule_Shutdown (in /home/leo/Radarr/_output_mono/NzbDrone.Api.dll.so)
==14405==    by 0x12458844: NzbDrone_Api_System_SystemModule___ctorb__6_2_object (in /home/leo/Radarr/_output_mono/NzbDrone.Api.dll.so)
==14405==    by 0x171AB391: ???
==14405==    by 0xF2F1F92: Nancy_Routing_Route_Invoke_Nancy_DynamicDictionary_System_Threading_CancellationToken (in /home/leo/Radarr/_output_mono/Nancy.dll.so)
==14405==    by 0xF2F1577: Nancy_Routing_DefaultRouteInvoker_Invoke_Nancy_Routing_Route_System_Threading_CancellationToken_Nancy_DynamicDictionary_Nancy_NancyContext (in /home/leo/Radarr/_output_mono/Nancy.dll.so)
==14405==  Address 0x1d3ff800 is on thread 32's stack
==14405==
==14405==
==14405== 1 errors in context 7 of 59:
==14405== Invalid write of size 8
==14405==    at 0x70A785: mono_sigctx_to_monoctx (mono-context.c:209)
==14405==    by 0x5123A0: mono_arch_handle_altstack_exception (exceptions-amd64.c:908)
==14405==    by 0x42D483: mono_sigsegv_signal_handler_debug (mini-runtime.c:3546)
==14405==    by 0x556038F: ??? (in /lib/x86_64-linux-gnu/libpthread-2.23.so)
==14405==    by 0xBF82823: NzbDrone_Core_Instrumentation_DatabaseTarget_Handle_NzbDrone_Core_Lifecycle_ApplicationShutdownRequested (in /home/leo/Radarr/_output_mono/NzbDrone.Core.dll.so)
==14405==    by 0xBF783D0: NzbDrone_Core_Messaging_Events_EventAggregator_PublishEvent_TEvent_REF_TEvent_REF (in /home/leo/Radarr/_output_mono/NzbDrone.Core.dll.so)
==14405==    by 0xBF7F8F0: NzbDrone_Core_Lifecycle_LifecycleService_Shutdown (in /home/leo/Radarr/_output_mono/NzbDrone.Core.dll.so)
==14405==    by 0x12458736: NzbDrone_Api_System_SystemModule_Shutdown (in /home/leo/Radarr/_output_mono/NzbDrone.Api.dll.so)
==14405==    by 0x12458844: NzbDrone_Api_System_SystemModule___ctorb__6_2_object (in /home/leo/Radarr/_output_mono/NzbDrone.Api.dll.so)
==14405==    by 0x171AB391: ???
==14405==    by 0xF2F1F92: Nancy_Routing_Route_Invoke_Nancy_DynamicDictionary_System_Threading_CancellationToken (in /home/leo/Radarr/_output_mono/Nancy.dll.so)
==14405==    by 0xF2F1577: Nancy_Routing_DefaultRouteInvoker_Invoke_Nancy_Routing_Route_System_Threading_CancellationToken_Nancy_DynamicDictionary_Nancy_NancyContext (in /home/leo/Radarr/_output_mono/Nancy.dll.so)
==14405==  Address 0x1d3ff7e8 is on thread 32's stack
==14405==
==14405==
==14405== 1 errors in context 8 of 59:
==14405== Invalid write of size 8
==14405==    at 0x70A77E: mono_sigctx_to_monoctx (mono-context.c:209)
==14405==    by 0x5123A0: mono_arch_handle_altstack_exception (exceptions-amd64.c:908)
==14405==    by 0x42D483: mono_sigsegv_signal_handler_debug (mini-runtime.c:3546)
==14405==    by 0x556038F: ??? (in /lib/x86_64-linux-gnu/libpthread-2.23.so)
==14405==    by 0xBF82823: NzbDrone_Core_Instrumentation_DatabaseTarget_Handle_NzbDrone_Core_Lifecycle_ApplicationShutdownRequested (in /home/leo/Radarr/_output_mono/NzbDrone.Core.dll.so)
==14405==    by 0xBF783D0: NzbDrone_Core_Messaging_Events_EventAggregator_PublishEvent_TEvent_REF_TEvent_REF (in /home/leo/Radarr/_output_mono/NzbDrone.Core.dll.so)
==14405==    by 0xBF7F8F0: NzbDrone_Core_Lifecycle_LifecycleService_Shutdown (in /home/leo/Radarr/_output_mono/NzbDrone.Core.dll.so)
==14405==    by 0x12458736: NzbDrone_Api_System_SystemModule_Shutdown (in /home/leo/Radarr/_output_mono/NzbDrone.Api.dll.so)
==14405==    by 0x12458844: NzbDrone_Api_System_SystemModule___ctorb__6_2_object (in /home/leo/Radarr/_output_mono/NzbDrone.Api.dll.so)
==14405==    by 0x171AB391: ???
==14405==    by 0xF2F1F92: Nancy_Routing_Route_Invoke_Nancy_DynamicDictionary_System_Threading_CancellationToken (in /home/leo/Radarr/_output_mono/Nancy.dll.so)
==14405==    by 0xF2F1577: Nancy_Routing_DefaultRouteInvoker_Invoke_Nancy_Routing_Route_System_Threading_CancellationToken_Nancy_DynamicDictionary_Nancy_NancyContext (in /home/leo/Radarr/_output_mono/Nancy.dll.so)
==14405==  Address 0x1d3ff7f0 is on thread 32's stack
==14405==
==14405==
==14405== 1 errors in context 9 of 59:
==14405== Invalid write of size 8
==14405==    at 0x70A762: mono_sigctx_to_monoctx (mono-context.c:208)
==14405==    by 0x5123A0: mono_arch_handle_altstack_exception (exceptions-amd64.c:908)
==14405==    by 0x42D483: mono_sigsegv_signal_handler_debug (mini-runtime.c:3546)
==14405==    by 0x556038F: ??? (in /lib/x86_64-linux-gnu/libpthread-2.23.so)
==14405==    by 0xBF82823: NzbDrone_Core_Instrumentation_DatabaseTarget_Handle_NzbDrone_Core_Lifecycle_ApplicationShutdownRequested (in /home/leo/Radarr/_output_mono/NzbDrone.Core.dll.so)
==14405==    by 0xBF783D0: NzbDrone_Core_Messaging_Events_EventAggregator_PublishEvent_TEvent_REF_TEvent_REF (in /home/leo/Radarr/_output_mono/NzbDrone.Core.dll.so)
==14405==    by 0xBF7F8F0: NzbDrone_Core_Lifecycle_LifecycleService_Shutdown (in /home/leo/Radarr/_output_mono/NzbDrone.Core.dll.so)
==14405==    by 0x12458736: NzbDrone_Api_System_SystemModule_Shutdown (in /home/leo/Radarr/_output_mono/NzbDrone.Api.dll.so)
==14405==    by 0x12458844: NzbDrone_Api_System_SystemModule___ctorb__6_2_object (in /home/leo/Radarr/_output_mono/NzbDrone.Api.dll.so)
==14405==    by 0x171AB391: ???
==14405==    by 0xF2F1F92: Nancy_Routing_Route_Invoke_Nancy_DynamicDictionary_System_Threading_CancellationToken (in /home/leo/Radarr/_output_mono/Nancy.dll.so)
==14405==    by 0xF2F1577: Nancy_Routing_DefaultRouteInvoker_Invoke_Nancy_Routing_Route_System_Threading_CancellationToken_Nancy_DynamicDictionary_Nancy_NancyContext (in /home/leo/Radarr/_output_mono/Nancy.dll.so)
==14405==  Address 0x1d3ff7d8 is on thread 32's stack
==14405==
==14405==
==14405== 1 errors in context 10 of 59:
==14405== Invalid write of size 8
==14405==    at 0x70A75B: mono_sigctx_to_monoctx (mono-context.c:208)
==14405==    by 0x5123A0: mono_arch_handle_altstack_exception (exceptions-amd64.c:908)
==14405==    by 0x42D483: mono_sigsegv_signal_handler_debug (mini-runtime.c:3546)
==14405==    by 0x556038F: ??? (in /lib/x86_64-linux-gnu/libpthread-2.23.so)
==14405==    by 0xBF82823: NzbDrone_Core_Instrumentation_DatabaseTarget_Handle_NzbDrone_Core_Lifecycle_ApplicationShutdownRequested (in /home/leo/Radarr/_output_mono/NzbDrone.Core.dll.so)
==14405==    by 0xBF783D0: NzbDrone_Core_Messaging_Events_EventAggregator_PublishEvent_TEvent_REF_TEvent_REF (in /home/leo/Radarr/_output_mono/NzbDrone.Core.dll.so)
==14405==    by 0xBF7F8F0: NzbDrone_Core_Lifecycle_LifecycleService_Shutdown (in /home/leo/Radarr/_output_mono/NzbDrone.Core.dll.so)
==14405==    by 0x12458736: NzbDrone_Api_System_SystemModule_Shutdown (in /home/leo/Radarr/_output_mono/NzbDrone.Api.dll.so)
==14405==    by 0x12458844: NzbDrone_Api_System_SystemModule___ctorb__6_2_object (in /home/leo/Radarr/_output_mono/NzbDrone.Api.dll.so)
==14405==    by 0x171AB391: ???
==14405==    by 0xF2F1F92: Nancy_Routing_Route_Invoke_Nancy_DynamicDictionary_System_Threading_CancellationToken (in /home/leo/Radarr/_output_mono/Nancy.dll.so)
==14405==    by 0xF2F1577: Nancy_Routing_DefaultRouteInvoker_Invoke_Nancy_Routing_Route_System_Threading_CancellationToken_Nancy_DynamicDictionary_Nancy_NancyContext (in /home/leo/Radarr/_output_mono/Nancy.dll.so)
==14405==  Address 0x1d3ff7e0 is on thread 32's stack
==14405==
==14405==
==14405== 1 errors in context 11 of 59:
==14405== Invalid write of size 8
==14405==    at 0x70A73F: mono_sigctx_to_monoctx (mono-context.c:207)
==14405==    by 0x5123A0: mono_arch_handle_altstack_exception (exceptions-amd64.c:908)
==14405==    by 0x42D483: mono_sigsegv_signal_handler_debug (mini-runtime.c:3546)
==14405==    by 0x556038F: ??? (in /lib/x86_64-linux-gnu/libpthread-2.23.so)
==14405==    by 0xBF82823: NzbDrone_Core_Instrumentation_DatabaseTarget_Handle_NzbDrone_Core_Lifecycle_ApplicationShutdownRequested (in /home/leo/Radarr/_output_mono/NzbDrone.Core.dll.so)
==14405==    by 0xBF783D0: NzbDrone_Core_Messaging_Events_EventAggregator_PublishEvent_TEvent_REF_TEvent_REF (in /home/leo/Radarr/_output_mono/NzbDrone.Core.dll.so)
==14405==    by 0xBF7F8F0: NzbDrone_Core_Lifecycle_LifecycleService_Shutdown (in /home/leo/Radarr/_output_mono/NzbDrone.Core.dll.so)
==14405==    by 0x12458736: NzbDrone_Api_System_SystemModule_Shutdown (in /home/leo/Radarr/_output_mono/NzbDrone.Api.dll.so)
==14405==    by 0x12458844: NzbDrone_Api_System_SystemModule___ctorb__6_2_object (in /home/leo/Radarr/_output_mono/NzbDrone.Api.dll.so)
==14405==    by 0x171AB391: ???
==14405==    by 0xF2F1F92: Nancy_Routing_Route_Invoke_Nancy_DynamicDictionary_System_Threading_CancellationToken (in /home/leo/Radarr/_output_mono/Nancy.dll.so)
==14405==    by 0xF2F1577: Nancy_Routing_DefaultRouteInvoker_Invoke_Nancy_Routing_Route_System_Threading_CancellationToken_Nancy_DynamicDictionary_Nancy_NancyContext (in /home/leo/Radarr/_output_mono/Nancy.dll.so)
==14405==  Address 0x1d3ff7c8 is on thread 32's stack
==14405==
==14405==
==14405== 1 errors in context 12 of 59:
==14405== Invalid write of size 8
==14405==    at 0x70A738: mono_sigctx_to_monoctx (mono-context.c:207)
==14405==    by 0x5123A0: mono_arch_handle_altstack_exception (exceptions-amd64.c:908)
==14405==    by 0x42D483: mono_sigsegv_signal_handler_debug (mini-runtime.c:3546)
==14405==    by 0x556038F: ??? (in /lib/x86_64-linux-gnu/libpthread-2.23.so)
==14405==    by 0xBF82823: NzbDrone_Core_Instrumentation_DatabaseTarget_Handle_NzbDrone_Core_Lifecycle_ApplicationShutdownRequested (in /home/leo/Radarr/_output_mono/NzbDrone.Core.dll.so)
==14405==    by 0xBF783D0: NzbDrone_Core_Messaging_Events_EventAggregator_PublishEvent_TEvent_REF_TEvent_REF (in /home/leo/Radarr/_output_mono/NzbDrone.Core.dll.so)
==14405==    by 0xBF7F8F0: NzbDrone_Core_Lifecycle_LifecycleService_Shutdown (in /home/leo/Radarr/_output_mono/NzbDrone.Core.dll.so)
==14405==    by 0x12458736: NzbDrone_Api_System_SystemModule_Shutdown (in /home/leo/Radarr/_output_mono/NzbDrone.Api.dll.so)
==14405==    by 0x12458844: NzbDrone_Api_System_SystemModule___ctorb__6_2_object (in /home/leo/Radarr/_output_mono/NzbDrone.Api.dll.so)
==14405==    by 0x171AB391: ???
==14405==    by 0xF2F1F92: Nancy_Routing_Route_Invoke_Nancy_DynamicDictionary_System_Threading_CancellationToken (in /home/leo/Radarr/_output_mono/Nancy.dll.so)
==14405==    by 0xF2F1577: Nancy_Routing_DefaultRouteInvoker_Invoke_Nancy_Routing_Route_System_Threading_CancellationToken_Nancy_DynamicDictionary_Nancy_NancyContext (in /home/leo/Radarr/_output_mono/Nancy.dll.so)
==14405==  Address 0x1d3ff7d0 is on thread 32's stack
==14405==
==14405==
==14405== 1 errors in context 13 of 59:
==14405== Invalid write of size 8
==14405==    at 0x70A71C: mono_sigctx_to_monoctx (mono-context.c:206)
==14405==    by 0x5123A0: mono_arch_handle_altstack_exception (exceptions-amd64.c:908)
==14405==    by 0x42D483: mono_sigsegv_signal_handler_debug (mini-runtime.c:3546)
==14405==    by 0x556038F: ??? (in /lib/x86_64-linux-gnu/libpthread-2.23.so)
==14405==    by 0xBF82823: NzbDrone_Core_Instrumentation_DatabaseTarget_Handle_NzbDrone_Core_Lifecycle_ApplicationShutdownRequested (in /home/leo/Radarr/_output_mono/NzbDrone.Core.dll.so)
==14405==    by 0xBF783D0: NzbDrone_Core_Messaging_Events_EventAggregator_PublishEvent_TEvent_REF_TEvent_REF (in /home/leo/Radarr/_output_mono/NzbDrone.Core.dll.so)
==14405==    by 0xBF7F8F0: NzbDrone_Core_Lifecycle_LifecycleService_Shutdown (in /home/leo/Radarr/_output_mono/NzbDrone.Core.dll.so)
==14405==    by 0x12458736: NzbDrone_Api_System_SystemModule_Shutdown (in /home/leo/Radarr/_output_mono/NzbDrone.Api.dll.so)
==14405==    by 0x12458844: NzbDrone_Api_System_SystemModule___ctorb__6_2_object (in /home/leo/Radarr/_output_mono/NzbDrone.Api.dll.so)
==14405==    by 0x171AB391: ???
==14405==    by 0xF2F1F92: Nancy_Routing_Route_Invoke_Nancy_DynamicDictionary_System_Threading_CancellationToken (in /home/leo/Radarr/_output_mono/Nancy.dll.so)
==14405==    by 0xF2F1577: Nancy_Routing_DefaultRouteInvoker_Invoke_Nancy_Routing_Route_System_Threading_CancellationToken_Nancy_DynamicDictionary_Nancy_NancyContext (in /home/leo/Radarr/_output_mono/Nancy.dll.so)
==14405==  Address 0x1d3ff7b8 is on thread 32's stack
==14405==
==14405==
==14405== 1 errors in context 14 of 59:
==14405== Invalid write of size 8
==14405==    at 0x70A715: mono_sigctx_to_monoctx (mono-context.c:206)
==14405==    by 0x5123A0: mono_arch_handle_altstack_exception (exceptions-amd64.c:908)
==14405==    by 0x42D483: mono_sigsegv_signal_handler_debug (mini-runtime.c:3546)
==14405==    by 0x556038F: ??? (in /lib/x86_64-linux-gnu/libpthread-2.23.so)
==14405==    by 0xBF82823: NzbDrone_Core_Instrumentation_DatabaseTarget_Handle_NzbDrone_Core_Lifecycle_ApplicationShutdownRequested (in /home/leo/Radarr/_output_mono/NzbDrone.Core.dll.so)
==14405==    by 0xBF783D0: NzbDrone_Core_Messaging_Events_EventAggregator_PublishEvent_TEvent_REF_TEvent_REF (in /home/leo/Radarr/_output_mono/NzbDrone.Core.dll.so)
==14405==    by 0xBF7F8F0: NzbDrone_Core_Lifecycle_LifecycleService_Shutdown (in /home/leo/Radarr/_output_mono/NzbDrone.Core.dll.so)
==14405==    by 0x12458736: NzbDrone_Api_System_SystemModule_Shutdown (in /home/leo/Radarr/_output_mono/NzbDrone.Api.dll.so)
==14405==    by 0x12458844: NzbDrone_Api_System_SystemModule___ctorb__6_2_object (in /home/leo/Radarr/_output_mono/NzbDrone.Api.dll.so)
==14405==    by 0x171AB391: ???
==14405==    by 0xF2F1F92: Nancy_Routing_Route_Invoke_Nancy_DynamicDictionary_System_Threading_CancellationToken (in /home/leo/Radarr/_output_mono/Nancy.dll.so)
==14405==    by 0xF2F1577: Nancy_Routing_DefaultRouteInvoker_Invoke_Nancy_Routing_Route_System_Threading_CancellationToken_Nancy_DynamicDictionary_Nancy_NancyContext (in /home/leo/Radarr/_output_mono/Nancy.dll.so)
==14405==  Address 0x1d3ff7c0 is on thread 32's stack
==14405==
==14405==
==14405== 1 errors in context 15 of 59:
==14405== Invalid write of size 8
==14405==    at 0x70A6F9: mono_sigctx_to_monoctx (mono-context.c:205)
==14405==    by 0x5123A0: mono_arch_handle_altstack_exception (exceptions-amd64.c:908)
==14405==    by 0x42D483: mono_sigsegv_signal_handler_debug (mini-runtime.c:3546)
==14405==    by 0x556038F: ??? (in /lib/x86_64-linux-gnu/libpthread-2.23.so)
==14405==    by 0xBF82823: NzbDrone_Core_Instrumentation_DatabaseTarget_Handle_NzbDrone_Core_Lifecycle_ApplicationShutdownRequested (in /home/leo/Radarr/_output_mono/NzbDrone.Core.dll.so)
==14405==    by 0xBF783D0: NzbDrone_Core_Messaging_Events_EventAggregator_PublishEvent_TEvent_REF_TEvent_REF (in /home/leo/Radarr/_output_mono/NzbDrone.Core.dll.so)
==14405==    by 0xBF7F8F0: NzbDrone_Core_Lifecycle_LifecycleService_Shutdown (in /home/leo/Radarr/_output_mono/NzbDrone.Core.dll.so)
==14405==    by 0x12458736: NzbDrone_Api_System_SystemModule_Shutdown (in /home/leo/Radarr/_output_mono/NzbDrone.Api.dll.so)
==14405==    by 0x12458844: NzbDrone_Api_System_SystemModule___ctorb__6_2_object (in /home/leo/Radarr/_output_mono/NzbDrone.Api.dll.so)
==14405==    by 0x171AB391: ???
==14405==    by 0xF2F1F92: Nancy_Routing_Route_Invoke_Nancy_DynamicDictionary_System_Threading_CancellationToken (in /home/leo/Radarr/_output_mono/Nancy.dll.so)
==14405==    by 0xF2F1577: Nancy_Routing_DefaultRouteInvoker_Invoke_Nancy_Routing_Route_System_Threading_CancellationToken_Nancy_DynamicDictionary_Nancy_NancyContext (in /home/leo/Radarr/_output_mono/Nancy.dll.so)
==14405==  Address 0x1d3ff7a8 is on thread 32's stack
==14405==
==14405==
==14405== 1 errors in context 16 of 59:
==14405== Invalid write of size 8
==14405==    at 0x70A6F2: mono_sigctx_to_monoctx (mono-context.c:205)
==14405==    by 0x5123A0: mono_arch_handle_altstack_exception (exceptions-amd64.c:908)
==14405==    by 0x42D483: mono_sigsegv_signal_handler_debug (mini-runtime.c:3546)
==14405==    by 0x556038F: ??? (in /lib/x86_64-linux-gnu/libpthread-2.23.so)
==14405==    by 0xBF82823: NzbDrone_Core_Instrumentation_DatabaseTarget_Handle_NzbDrone_Core_Lifecycle_ApplicationShutdownRequested (in /home/leo/Radarr/_output_mono/NzbDrone.Core.dll.so)
==14405==    by 0xBF783D0: NzbDrone_Core_Messaging_Events_EventAggregator_PublishEvent_TEvent_REF_TEvent_REF (in /home/leo/Radarr/_output_mono/NzbDrone.Core.dll.so)
==14405==    by 0xBF7F8F0: NzbDrone_Core_Lifecycle_LifecycleService_Shutdown (in /home/leo/Radarr/_output_mono/NzbDrone.Core.dll.so)
==14405==    by 0x12458736: NzbDrone_Api_System_SystemModule_Shutdown (in /home/leo/Radarr/_output_mono/NzbDrone.Api.dll.so)
==14405==    by 0x12458844: NzbDrone_Api_System_SystemModule___ctorb__6_2_object (in /home/leo/Radarr/_output_mono/NzbDrone.Api.dll.so)
==14405==    by 0x171AB391: ???
==14405==    by 0xF2F1F92: Nancy_Routing_Route_Invoke_Nancy_DynamicDictionary_System_Threading_CancellationToken (in /home/leo/Radarr/_output_mono/Nancy.dll.so)
==14405==    by 0xF2F1577: Nancy_Routing_DefaultRouteInvoker_Invoke_Nancy_Routing_Route_System_Threading_CancellationToken_Nancy_DynamicDictionary_Nancy_NancyContext (in /home/leo/Radarr/_output_mono/Nancy.dll.so)
==14405==  Address 0x1d3ff7b0 is on thread 32's stack
==14405==
==14405==
==14405== 1 errors in context 17 of 59:
==14405== Invalid read of size 4
==14405==    at 0xBF82824: NzbDrone_Core_Instrumentation_DatabaseTarget_Handle_NzbDrone_Core_Lifecycle_ApplicationShutdownRequested (in /home/leo/Radarr/_output_mono/NzbDrone.Core.dll.so)
==14405==    by 0xBF783D0: NzbDrone_Core_Messaging_Events_EventAggregator_PublishEvent_TEvent_REF_TEvent_REF (in /home/leo/Radarr/_output_mono/NzbDrone.Core.dll.so)
==14405==    by 0xBF7F8F0: NzbDrone_Core_Lifecycle_LifecycleService_Shutdown (in /home/leo/Radarr/_output_mono/NzbDrone.Core.dll.so)
==14405==    by 0x12458736: NzbDrone_Api_System_SystemModule_Shutdown (in /home/leo/Radarr/_output_mono/NzbDrone.Api.dll.so)
==14405==    by 0x12458844: NzbDrone_Api_System_SystemModule___ctorb__6_2_object (in /home/leo/Radarr/_output_mono/NzbDrone.Api.dll.so)
==14405==    by 0x171AB391: ???
==14405==    by 0xF2F1F92: Nancy_Routing_Route_Invoke_Nancy_DynamicDictionary_System_Threading_CancellationToken (in /home/leo/Radarr/_output_mono/Nancy.dll.so)
==14405==    by 0xF2F1577: Nancy_Routing_DefaultRouteInvoker_Invoke_Nancy_Routing_Route_System_Threading_CancellationToken_Nancy_DynamicDictionary_Nancy_NancyContext (in /home/leo/Radarr/_output_mono/Nancy.dll.so)
==14405==    by 0xF360E1D: Nancy_Routing_DefaultRequestDispatcher__c__DisplayClass2__Dispatchb__0_System_Threading_Tasks_Task_1_Nancy_Response (in /home/leo/Radarr/_output_mono/Nancy.dll.so)
==14405==    by 0xF2DC397: Nancy_Helpers_TaskHelpers_WhenCompleted_T_REF_System_Threading_Tasks_Task_1_T_REF_System_Action_1_System_Threading_Tasks_Task_1_T_REF_System_Action_1_System_Threading_Tasks_Task_1_T_REF_bool (in /home/leo/Radarr/_output_mono/Nancy.dll.so)
==14405==    by 0xF2F010E: Nancy_Routing_DefaultRequestDispatcher_Dispatch_Nancy_NancyContext_System_Threading_CancellationToken (in /home/leo/Radarr/_output_mono/Nancy.dll.so)
==14405==    by 0xF369138: Nancy_NancyEngine__c__DisplayClasse__InvokeRequestLifeCycleb__c_System_Threading_Tasks_Task_1_Nancy_Response (in /home/leo/Radarr/_output_mono/Nancy.dll.so)
==14405==  Address 0x0 is not stack'd, malloc'd or (recently) free'd
==14405==
==14405==
==14405== 1 errors in context 18 of 59:
==14405== Thread 3 Finalizer:
==14405== Conditional jump or move depends on uninitialised value(s)
==14405==    at 0x5A71A2: mono_class_setup_vtable_general (class-init.c:2956)
==14405==    by 0x5A88E0: mono_class_setup_vtable_full (class-init.c:2540)
==14405==    by 0x59EA07: mono_class_get_finalizer (class.c:4001)
==14405==    by 0x698DF4: mono_gc_run_finalize (gc.c:274)
==14405==    by 0x6CAD52: sgen_gc_invoke_finalizers (sgen-gc.c:2765)
==14405==    by 0x6996F0: mono_runtime_do_background_work (gc.c:883)
==14405==    by 0x6996F0: finalizer_thread (gc.c:926)
==14405==    by 0x64C7D0: start_wrapper_internal (threads.c:1174)
==14405==    by 0x64C7D0: start_wrapper (threads.c:1234)
==14405==    by 0x55566B9: start_thread (pthread_create.c:333)
==14405==    by 0x5A8941C: clone (clone.S:109)
==14405==
==14405==
==14405== 1 errors in context 19 of 59:
==14405== Thread 1:
==14405== Conditional jump or move depends on uninitialised value(s)
==14405==    at 0x5A71A2: mono_class_setup_vtable_general (class-init.c:2956)
==14405==    by 0x5A88E0: mono_class_setup_vtable_full (class-init.c:2540)
==14405==    by 0x45DDFB: mono_method_to_ir (method-to-ir.c:7288)
==14405==    by 0x51E27F: mini_method_compile (mini.c:3488)
==14405==    by 0x51FFB3: mono_jit_compile_method_inner (mini.c:4076)
==14405==    by 0x42A75E: mono_jit_compile_method_with_opt (mini-runtime.c:2450)
==14405==    by 0x4AC824: common_call_trampoline (mini-trampolines.c:751)
==14405==    by 0x4AD1C2: mono_magic_trampoline (mini-trampolines.c:891)
==14405==    by 0x41D1386: ???
==14405==    by 0x93CD55A: NLog_Config_ConfigurationItemFactory_GetNLogExtensionFiles_string (in /home/leo/Radarr/_output_mono/NLog.dll.so)
==14405==    by 0x93CCACC: NLog_Config_ConfigurationItemFactory_BuildDefaultFactory (in /home/leo/Radarr/_output_mono/NLog.dll.so)
==14405==    by 0x93CBA42: NLog_Config_ConfigurationItemFactory_get_Default (in /home/leo/Radarr/_output_mono/NLog.dll.so)
==14405==
==14405==
==14405== 7 errors in context 20 of 59:
==14405== Conditional jump or move depends on uninitialised value(s)
==14405==    at 0x5A71A2: mono_class_setup_vtable_general (class-init.c:2956)
==14405==    by 0x5A88E0: mono_class_setup_vtable_full (class-init.c:2540)
==14405==    by 0x5EA504: get_method_constrained.isra.13 (loader.c:1901)
==14405==    by 0x457167: mono_method_to_ir (method-to-ir.c:7024)
==14405==    by 0x51E27F: mini_method_compile (mini.c:3488)
==14405==    by 0x51FFB3: mono_jit_compile_method_inner (mini.c:4076)
==14405==    by 0x42A75E: mono_jit_compile_method_with_opt (mini-runtime.c:2450)
==14405==    by 0x4AC824: common_call_trampoline (mini-trampolines.c:751)
==14405==    by 0x4AD1C2: mono_magic_trampoline (mini-trampolines.c:891)
==14405==    by 0x41D1386: ???
==14405==    by 0x17065FAA: ???
==14405==    by 0x17065D92: ???
==14405==
==14405==
==14405== 7 errors in context 21 of 59:
==14405== Conditional jump or move depends on uninitialised value(s)
==14405==    at 0x578F23: mono_w32process_module_get_information (w32process-unix.c:1353)
==14405==    by 0x634574: process_add_module (w32process.c:495)
==14405==    by 0x634574: ves_icall_System_Diagnostics_Process_GetModules_internal (w32process.c:595)
==14405==    by 0x141182D6: ???
==14405==    by 0x14118057: ???
==14405==    by 0x14117F73: ???
==14405==    by 0xA778B8C: NzbDrone_Common_Processes_ProcessProvider_GetCurrentProcess (in /home/leo/Radarr/_output_mono/NzbDrone.Common.dll.so)
==14405==    by 0xBBA500F: Radarr_Host_SingleInstancePolicy_GetOtherNzbDroneProcessIds (in /home/leo/Radarr/_output_mono/Radarr.Host.dll.so)
==14405==    by 0xBBA4FA4: Radarr_Host_SingleInstancePolicy_IsAlreadyRunning (in /home/leo/Radarr/_output_mono/Radarr.Host.dll.so)
==14405==    by 0xBBA4D94: Radarr_Host_SingleInstancePolicy_PreventStartIfAlreadyRunning (in /home/leo/Radarr/_output_mono/Radarr.Host.dll.so)
==14405==    by 0xBBA3D49: Radarr_Host_Bootstrap_EnsureSingleInstance_bool_NzbDrone_Common_EnvironmentInfo_IStartupContext (in /home/leo/Radarr/_output_mono/Radarr.Host.dll.so)
==14405==    by 0xBBA3B99: Radarr_Host_Bootstrap_Start_Radarr_Host_ApplicationModes_NzbDrone_Common_EnvironmentInfo_StartupContext (in /home/leo/Radarr/_output_mono/Radarr.Host.dll.so)
==14405==    by 0xBBA3A08: Radarr_Host_Bootstrap_Start_NzbDrone_Common_EnvironmentInfo_StartupContext_Radarr_Host_IUserAlert_System_Action_1_NzbDrone_Common_Composition_IContainer (in /home/leo/Radarr/_output_mono/Radarr.Host.dll.so)
==14405==
==14405==
==14405== 7 errors in context 22 of 59:
==14405== Conditional jump or move depends on uninitialised value(s)
==14405==    at 0x578B34: mono_w32process_module_get_name (w32process-unix.c:1241)
==14405==    by 0x63446F: ves_icall_System_Diagnostics_Process_GetModules_internal (w32process.c:592)
==14405==    by 0x141182D6: ???
==14405==    by 0x14118057: ???
==14405==    by 0x14117F73: ???
==14405==    by 0xA778B8C: NzbDrone_Common_Processes_ProcessProvider_GetCurrentProcess (in /home/leo/Radarr/_output_mono/NzbDrone.Common.dll.so)
==14405==    by 0xBBA500F: Radarr_Host_SingleInstancePolicy_GetOtherNzbDroneProcessIds (in /home/leo/Radarr/_output_mono/Radarr.Host.dll.so)
==14405==    by 0xBBA4FA4: Radarr_Host_SingleInstancePolicy_IsAlreadyRunning (in /home/leo/Radarr/_output_mono/Radarr.Host.dll.so)
==14405==    by 0xBBA4D94: Radarr_Host_SingleInstancePolicy_PreventStartIfAlreadyRunning (in /home/leo/Radarr/_output_mono/Radarr.Host.dll.so)
==14405==    by 0xBBA3D49: Radarr_Host_Bootstrap_EnsureSingleInstance_bool_NzbDrone_Common_EnvironmentInfo_IStartupContext (in /home/leo/Radarr/_output_mono/Radarr.Host.dll.so)
==14405==    by 0xBBA3B99: Radarr_Host_Bootstrap_Start_Radarr_Host_ApplicationModes_NzbDrone_Common_EnvironmentInfo_StartupContext (in /home/leo/Radarr/_output_mono/Radarr.Host.dll.so)
==14405==    by 0xBBA3A08: Radarr_Host_Bootstrap_Start_NzbDrone_Common_EnvironmentInfo_StartupContext_Radarr_Host_IUserAlert_System_Action_1_NzbDrone_Common_Composition_IContainer (in /home/leo/Radarr/_output_mono/Radarr.Host.dll.so)
==14405==
==14405==
==14405== 38 errors in context 23 of 59:
==14405== Conditional jump or move depends on uninitialised value(s)
==14405==    at 0x5A71A2: mono_class_setup_vtable_general (class-init.c:2956)
==14405==    by 0x5A88E0: mono_class_setup_vtable_full (class-init.c:2540)
==14405==    by 0x5EA407: get_method_constrained.isra.13 (loader.c:1907)
==14405==    by 0x457167: mono_method_to_ir (method-to-ir.c:7024)
==14405==    by 0x51E27F: mini_method_compile (mini.c:3488)
==14405==    by 0x51FFB3: mono_jit_compile_method_inner (mini.c:4076)
==14405==    by 0x42A75E: mono_jit_compile_method_with_opt (mini-runtime.c:2450)
==14405==    by 0x4AC824: common_call_trampoline (mini-trampolines.c:751)
==14405==    by 0x4AD4B6: mono_vcall_trampoline (mini-trampolines.c:974)
==14405==    by 0x41D2506: ???
==14405==    by 0x140FFB24: ???
==14405==    by 0x650E25F: ???
==14405==
==14405==
==14405== 53 errors in context 24 of 59:
==14405== Conditional jump or move depends on uninitialised value(s)
==14405==    at 0x5BFAFB: mono_icall_get_machine_name (icall.c:6741)
==14405==    by 0x5D4EA7: ves_icall_System_Environment_get_MachineName (icall.c:6762)
==14405==    by 0x5D4EA7: ves_icall_System_Environment_get_MachineName_raw (icall-def.h:318)
==14405==    by 0x170DA782: ???
==14405==    by 0x42C7A0: mono_jit_runtime_invoke (mini-runtime.c:3189)
==14405==    by 0x620F7F: do_runtime_invoke (object.c:2978)
==14405==    by 0x627A93: mono_runtime_class_init_full (object.c:521)
==14405==    by 0x4299E6: mono_resolve_patch_target (mini-runtime.c:1520)
==14405==    by 0x49BA4D: init_method (aot-runtime.c:4515)
==14405==    by 0x49C083: load_method.part.20 (aot-runtime.c:4184)
==14405==    by 0x49D7F4: load_method (aot-runtime.c:4091)
==14405==    by 0x49D7F4: mono_aot_get_method_from_token (aot-runtime.c:4951)
==14405==    by 0x4AD2A4: mono_aot_trampoline (mini-trampolines.c:1057)
==14405==    by 0x41D1B06: ???
==14405==
==14405==
==14405== 331 errors in context 25 of 59:
==14405== Conditional jump or move depends on uninitialised value(s)
==14405==    at 0x5A71A2: mono_class_setup_vtable_general (class-init.c:2956)
==14405==    by 0x5A88E0: mono_class_setup_vtable_full (class-init.c:2540)
==14405==    by 0x5A7146: mono_class_setup_vtable_general (class-init.c:2935)
==14405==    by 0x5A88E0: mono_class_setup_vtable_full (class-init.c:2540)
==14405==    by 0x62731F: mono_class_create_runtime_vtable (object.c:2010)
==14405==    by 0x62731F: mono_class_vtable_checked (object.c:1899)
==14405==    by 0x42945A: mono_resolve_patch_target (mini-runtime.c:1488)
==14405==    by 0x49BA4D: init_method (aot-runtime.c:4515)
==14405==    by 0x49C083: load_method.part.20 (aot-runtime.c:4184)
==14405==    by 0x49CD1F: load_method (aot-runtime.c:4091)
==14405==    by 0x49CD1F: mono_aot_get_method (aot-runtime.c:4922)
==14405==    by 0x42A43E: mono_jit_compile_method_with_opt (mini-runtime.c:2389)
==14405==    by 0x4AC824: common_call_trampoline (mini-trampolines.c:751)
==14405==    by 0x4AD1C2: mono_magic_trampoline (mini-trampolines.c:891)
==14405==
==14405==
==14405== 386 errors in context 26 of 59:
==14405== Conditional jump or move depends on uninitialised value(s)
==14405==    at 0x5A71A2: mono_class_setup_vtable_general (class-init.c:2956)
==14405==    by 0x5A88E0: mono_class_setup_vtable_full (class-init.c:2540)
==14405==    by 0x5C86B5: mono_class_get_methods_by_name (icall.c:4035)
==14405==    by 0x5DF415: ves_icall_RuntimeType_GetMethodsByName_native_raw (icall-def.h:883)
==14405==    by 0x11B0B026: ???
==14405==    by 0x861BED1: System_RuntimeType_GetMethodCandidates_string_int_System_Reflection_BindingFlags_System_Reflection_CallingConventions_System_Type___bool (RtType.cs:64)
==14405==    by 0x861BBCF: System_RuntimeType_GetMethodImplCommon_string_int_System_Reflection_BindingFlags_System_Reflection_Binder_System_Reflection_CallingConventions_System_Type___System_Reflection_ParameterModifier__ (RtType.cs:27)
==14405==    by 0x861BAD7: System_RuntimeType_GetMethodImpl_string_System_Reflection_BindingFlags_System_Reflection_Binder_System_Reflection_CallingConventions_System_Type___System_Reflection_ParameterModifier__ (RtType.cs:13)
==14405==    by 0x85D55E2: System_Type_GetMethod_string_System_Reflection_BindingFlags (Type.cs:174)
==14405==    by 0x11CF7BEA: ???
==14405==
==14405==
==14405== 1089 errors in context 27 of 59:
==14405== Thread 34 Thread Pool Wor:
==14405== Invalid read of size 8
==14405==    at 0x6C9C18: sgen_conservatively_pin_objects_from (sgen-gc.c:827)
==14405==    by 0x6A767C: sgen_client_scan_thread_data (sgen-mono.c:2235)
==14405==    by 0x6C9D3A: pin_from_roots (sgen-gc.c:864)
==14405==    by 0x6CB603: collect_nursery.constprop.44 (sgen-gc.c:1753)
==14405==    by 0x6CE720: sgen_perform_collection_inner (sgen-gc.c:2543)
==14405==    by 0x6BED5D: sgen_alloc_obj_nolock (sgen-alloc.c:256)
==14405==    by 0x6A334B: mono_gc_alloc_vector (sgen-mono.c:1324)
==14405==    by 0x41EBB41: ???
==14405==    by 0x850AAFD: Mono_Math_BigInteger_Kernel_multiByteDivide_Mono_Math_BigInteger_Mono_Math_BigInteger (BigInteger.cs:1994)
==14405==    by 0x850C2AB: Mono_Math_BigInteger_Kernel_modInverse_Mono_Math_BigInteger_Mono_Math_BigInteger (BigInteger.cs:2353)
==14405==    by 0x85082CE: Mono_Math_BigInteger_ModInverse_Mono_Math_BigInteger (BigInteger.cs:892)
==14405==    by 0x84FF1F2: Mono_Security_Cryptography_RSAManaged_DecryptValue_byte__ (RSAManaged.cs:226)
==14405==  Address 0x1abe93b0 is on thread 22's stack
==14405==  2304 bytes below stack pointer
==14405==
==14405== ERROR SUMMARY: 1969 errors from 59 contexts (suppressed: 0 from 0)
@galli-leo
From the top:
- There are some DataMapper instances not disposed explicitly.
But does the garbage collector pick them up eventually? Afaik it does, meaning it should not be causing a memory leak.
(i'll see which of the usings can be ported back to sonarr, coz it's good practice anyway) - CacheSize.
You're correct, it should be -20000. This error has been there for over 6 years. However, the consequence is that sqlite would cache all pages in memory, but not more than that. My sonarr db is just 32 MB. It wouldn't be causing such a big memory leak.
(i'll port the fix to sonarr) - Memory Profile.
Yes, I think I've inspected one of those before and came to the same conclusion about unmanaged memory leakage, but it's still possible that the unmanaged memory is kept alive by a managed object.
In that case you should focus in object instance count, not object memory size.
I took a peak and notice DeflateStreamNative, 44 instances. +14 between snapshots. It might be worth investigating that further since it keeps a handle to zlib so likely to have unmanaged memory. I checked Snapshot 7 to 8. - Strings.
Yeah, the Gen0 GC eats those for snacks. I wouldn't worry till they pile up. At worst all the allocations could cause a performance issue, at which point you'd use a string pool or something. nothing to consider now. - Valgrind.
I recall mono docs having some suggestions about configuring valgrind. I have no experience. - Valgrind found leaks.
I wouldn't investigate reports of a couple of bytes. Nor 'leaks on shutdown'. If I create a static Listand stuff it with every string I have. It'll still be cleaned up during shutdown, but it's definitely a leak.
What you want to find is an inverse callstack that's responsible for +100MB of allocations.
Taloth
on 1 Dec 2018
@Taloth Thank you for your quick response!
I found some more IDisposable leaking here: https://github.com/Radarr/Radarr/blob/77950645af066181d562b614f84c6694b90df4d7/src/NzbDrone.Core/Instrumentation/DatabaseTarget.cs#L87-L96
Also this here leads to a NullReferenceException when you try to close Radarr: https://github.com/Sonarr/Sonarr/blob/537e4d7c39e839e75e7a7ad84e95cd582ec1d20e/src/NzbDrone.Core/Instrumentation/DatabaseTarget.cs#L105-L111
From what I understand, while the GC would collect the DataMapper fine, it wouldn't call Dispose and hence the Connection / Command might not get cleaned up.
So valgrind only reports around 50MB in use before exit (got it working as per above). Seems like it wouldn't detect a leak because it's not present under valgrind? Could this mean that the memory leak is due to some threading stuff? Valgrind runs the whole application on a single thread.
galli-leo
on 1 Dec 2018
From what I understand, while the GC would collect the DataMapper fine, it wouldn't call Dispose and hence the Connection / Command might not get cleaned up.
And why wouldn't SqliteConnection/Command be cleaned up by the GC too? Unless the profiler indicates lingering (and growing) instances, don't worry about it.
_FYI, in your snapshot there are 0 SqliteCommand instances and only 2 SqliteConnection instances._
Seems like it wouldn't detect a leak because it's not present under valgrind? Could this mean that the memory leak is due to some threading stuff?
Impossible to say for sure, but unlikely to be threading related imo.
Might I suggest you add try {} finally {} to ManagedHttpDispatcher.GetResponse.
Move HttpWebRequest webRequest and HttpWebResponse httpWebResponse to before the try, null initialized.
The return at the end of the try. Then in the finally check if httpWebResponse is not null, if not call Dispose on it.
I'm not entirely sure but there might be a situation in mono where, through a convoluted chain it keeps itself alive.
Then, redo your tests with the log profiler to see what happens with the lingering DeflateStreamNative instances.
Two chains:
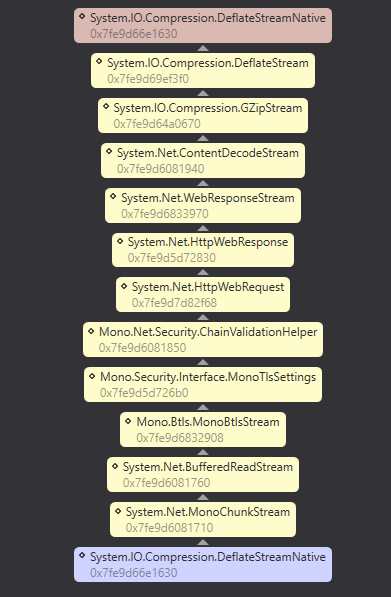
The Dispose in finally might remedy this one.
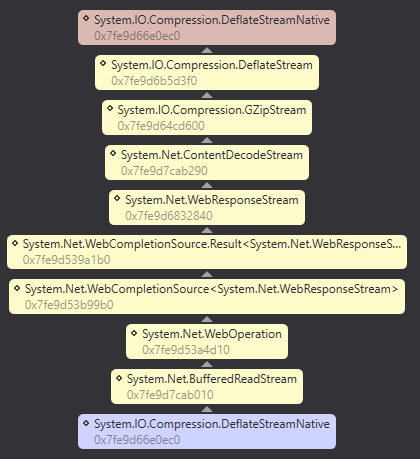
I don't know how we can clean this one up.
Taloth
on 1 Dec 2018
@Taloth Seems like your change did not help at all with memory usage :/.
However, I found that by not calling EnsureMediaCovers here: https://github.com/Radarr/Radarr/blob/77950645af066181d562b614f84c6694b90df4d7/src/NzbDrone.Core/MediaCover/MediaCoverService.cs#L185-L195
There was no leak when updating the library! I don't have any time today unfortunately, but could this be due to the gdiinterop check?
galli-leo
on 1 Dec 2018
Ok, those DeflateStreamNative is still lingering references, but we can sort that out later. (You checked in the profiler if the instances are now cleaned up properly?)
The GdiInterop check occurs only once, so cannot be responsible for the growth.
EnsureCovers calls CoverAlreadyExistsSpecification, which is one of the few locations using a http Head request.
I couldn't find any ImageBuilder or ImageJob instances in the profile, so it's unlikely that the resizer code has been called yet.
Sonarr doesn't have this, but the code behind it looks benign.
It should be straight forward to find out which part of it is the culprit.
Nice work so far galli!
Taloth
on 1 Dec 2018
@Taloth No I haven't had time yet to look, but should be good. Also, _httpClient.DownloadFile has another leaked IDiposable.
Anyways, these lines are causing the leak: https://github.com/Radarr/Radarr/blob/77950645af066181d562b614f84c6694b90df4d7/src/NzbDrone.Common/Disk/DiskProviderBase.cs#L135-L137
As soon as they are commented out, no leak happens. I tried using the normal dispose pattern (i.e. bmp.Dispose() instead of the using block, but still leaks memory.
So seems like the linux implementation of libgdiplus has the leak? Should we just remove that call, or try to find alternatives?
This might be relevant as well: https://bugzilla.xamarin.com/show_bug.cgi?id=54149
galli-leo
on 1 Dec 2018
@galli-leo assume the was the _diskProvider.IsValidGDIPlusImage function added just for corrupt image validation? As @Taloth mentioned this isn’t in Sonarr or Lidarr.
 Qstick
on 1 Dec 2018
Qstick
on 1 Dec 2018
@Qstick Huh, seems like you are correct. Wonder why Sonarr still has the memory leak then?
galli-leo
on 1 Dec 2018
I've never experienced this memory leak in sonarr. It's just radarr, at
least for me.
Em sáb, 1 de dez de 2018 17:06, Leonardo Galli <[email protected]
escreveu:
@Qstick https://github.com/Qstick Huh, seems like you are correct.
Wonder why Sonarr still has the memory leak then?—
You are receiving this because you were mentioned.
Reply to this email directly, view it on GitHub
https://github.com/Radarr/Radarr/issues/1580#issuecomment-443449963, or mute
the thread
https://github.com/notifications/unsubscribe-auth/AAhRBtA6IGmqQD52P_iCYp_2nCmajdqcks5u0tNIgaJpZM4NoXml
.
drwyrm
on 1 Dec 2018
I can also confirm that I only experience the memory leak in Radarr, doesn't happen in Sonarr or Lidarr.
MrTopCat
on 1 Dec 2018
Looks like you narrowed down the issue @galli-leo great work!
 onedr0p
on 1 Dec 2018
onedr0p
on 1 Dec 2018
@galli-leo You said you were done for the day :smile: Pick it up another time, I just wanted to reply on what you found so far.
There are like 42 instances created and disposed in the snapshot you provided earlier. A little bit of administrative data can't account for megabytes of leak, so it has to be leaking the actual bitmap data or original stream.
I'd suggest you log which files get checked, how big the file is in raw size and how much each file leaks.
I threw together this: https://gist.github.com/Taloth/326e8571705b31f3d23429c8e1ea7b2d
It creates and disposes Bitmap 100x for each file in the specified dir. If i run it on my Sonarr MediaCover folder I see about 16 MB disappearing tops... for 1200 files, so 120000 allocations that means 149 bytes on average. And that's based on private bytes, not hard numbers. That's not a significant leak.
You could try it on your own dataset, see if you get different results. But it appears to me that the problem cannot be reproduced in isolation.
PS: Edit to add: 'The' memory leakage has always been far more pronounced on Radarr. And Sonarr used to push out application updates far more frequently and thus restart before any leakage became pronounced.
This is also why it's not good to just point at one memory leak and declare it the culprit. The DeflateStreamNative is quite possible one of the causes for the leak in Sonarr, but the GDIImage check is simply eclipsing that.
Taloth
on 1 Dec 2018
@Taloth I just won't bother fixing this, since you guys don't use that either.
Also really weird that it's not easily reproducible. I also tried a small console app, but it didn't leak anything. Radarr on the other hand probably leaked the whole Bitmap, since the memory usage would go up from 100MB to 900MB after a movie refresh on a library with 10 movies.
PS: Edit to add: 'The' memory leakage has always been far more pronounced on Radarr. And Sonarr used to push out application updates far more frequently and thus restart before any leakage became pronounced.
This is also why it's not good to just point at one memory leak and declare it the culprit. The DeflateStreamNative is quite possible one of the causes for the leak in Sonarr, but the GDIImage check is simply eclipsing that.
Of course, hence I won't be closing this issue until it is confirmed that, that leakage is gone as well. In the linked PR, I cleaned up the commits as best as I could and tried to keep them all separate. Should be relatively easy to cherry pick the ones you want for Sonarr / Lidarr.
Do you know of any way to keep track of all IDisposables at runtime? There are probably a lot more we are not correctly disposing of still.
Also, from my understanding and reading online, the DB* classes need to be explicitly disposed, else they will actually leak the memory. So those DataMappers and SQLiteConnections could also likely be one of the culprits. As someone above found out, the Housekeeping task seemed to leak memory as well. Could be that this is fixed as well now.
galli-leo
on 2 Dec 2018
@Taloth Just found this stackoverflow page:
https://stackoverflow.com/a/42241479
This might be the reason for keeping around the DeflateNativeStream?
EDIT: Just saw that we are leaking not only the DeflateStream, but also the Response stream in the CurlHttpDispatcher: https://github.com/Radarr/Radarr/pull/3227/commits/899bd086ecca441feb3c150e3c0340edbbdd8c94
So this is probably related to that :)
EDIT 2: Seems like CurlHttpDispatcher is only used as a fallback and in the logs, it doesn't appear to be used. However, I have looked at the mono source code, and found this bit here interesting: https://github.com/mono/mono/blob/c5b88ec4f323f2bdb7c7d0a595ece28dae66579c/mcs/class/System/System.Net/ContentDecodeStream.cs#L79-L88
This would leak the GZipStream, right? GZipStream is not a WebReadStream and nothing else get's called on the OriginalInnerStream. So we don't call Dispose on the GZipStream and hence the underlying DeflateStream is kept alive as well?
galli-leo
on 2 Dec 2018
Also really weird that it's not easily reproducible. I also tried a small console app, but it didn't leak anything.
I'm wondering if it happens because we run these things on a background thread. But I can't reproduce it on a background thread either. At least not on my ubuntu system.
Do you know of any way to keep track of all IDisposables at runtime?
No, and I'd caution against going down that path. not disposing IDisposables is NOT a leak except in a few very specific scenarios. The memory profiler is your friend here because it shows what objects are still alive.
It also cannot (or should not) cause an unmanaged memory leak, coz any object that has unmanaged memory should implement a finalizer, which is called by the garbage collector to cleanup those resources.
The primary reason for IDisposable is to allow you to free resources and locks as soon as possible. Open file streams can be disposed because it releases the filelock and it's good practice to do so in light of that. But the GC will still clean it up fine if you don't explicitly Dispose and you won't have a leak.
Take for example the MemoryStream, calling Dispose on MemoryStream does nothing except marking it as disposed so it can throw if you still read. No memory is released until the MemoryStream gets out of scope and is garbage collected..
Your memory snapshot only has 8 such streams alive (out of 900+). 6 of em are used in NLog and intentionally kept around for reuse, the 2 remaining are for HttpConnections and could very well be related to the open signalr connection.
Same goes for the DB* classes, show me that stuff is being kept alive. I'm not saying there can't be leaks there, I'm just saying that the presence of IDisposable does not mean that it _will_ leak.
This would leak the GZipStream, right? GZipStream is not a WebReadStream and nothing else get's called on the OriginalInnerStream. So we don't call Dispose on the GZipStream and hence the underlying DeflateStream is kept alive as well?
No it wouldn't, for several reasons. Mainly because once ContentDecodeStream gets garbage collected, so will GZipStream and DeflateStream, regardless of what ContentDecodeStream does, simply because all references to Gzip/DeflateStream go out of scope.
It's important to note here that the DeflateStreamNative is being kept alive by the GCHandle that it uses. It's literally keeping itself alive until some conditions are satisfied.
Such patterns are usually done when something is waiting for native code to call back into managed code, or similar. And they're usually kept 'internal' and designed in such a way that it still cleans up properly.
The reason why the DeflateStreamNative 'leaks' is because it's inadvertently keeping objects alive that are supposed to ensure that DeflateStreamNative is disposed properly. It's an edge-case that the writers of that particular code didn't expect.
Taloth
on 2 Dec 2018
@Taloth
No, and I'd caution against going down that path. not disposing IDisposables is NOT a leak except in a few very specific scenarios. The memory profiler is your friend here because it shows what objects are still alive.
It also cannot (or should not) cause an unmanaged memory leak, coz any object that has unmanaged memory should implement a finalizer, which is called by the garbage collector to cleanup those resources.
The primary reason for IDisposable is to allow you to free resources and locks as soon as possible. Open file streams can be disposed because it releases the filelock and it's good practice to do so in light of that. But the GC will still clean it up fine if you don't explicitly Dispose and you won't have a leak.
Yes I completely agree with that. I have misread the ContentDecodeStream and thought it was setting the OriginalInnerStream to the GZipStream 😅 . However, when looking at the WebResponseStream code, this line seems interesting: https://github.com/mono/mono/blob/c99d2de68eff1c67a53ba10007cfdd540cdbca66/mcs/class/System/System.Net/WebResponseStream.cs#L178-L184
From my understanding of the code, this would only dispose innerStream if the request was aborted, right? Which would mean that the DeflateStreamNative would never be disposed, correct? Or is there something that disposes the innerStream, I don't see?
galli-leo
on 3 Dec 2018
@Taloth Hmm, I made a special build that removes the resizing logic from MediaCovers and that seems to stop leaking when adding movies: https://github.com/Radarr/Radarr/issues/3157#issuecomment-443630016 Could be that libgdiplus is leaking anyways, so we probably have to investigate this still.
galli-leo
on 3 Dec 2018
Can you provide the version of mono AND libgdiplus that it occurs with?
As for the remaining leak, does it occur consistently? Is it possible to repro without adding a movie? Like by a new command that does nothing except does the resize on some files. I'm hoping for something that we can start tearing out more and more code to get a simple repro test app.
Finally, WebResponseStream. I think Close_internal might be called in some cases, but I don't know if that leads to some inner stream to be cleared up via via. It's also possible that once the decompression finishes reading all expected bytes that it normally cleans up too.
From what I can see in the sourcecode you can compile mono with the MONO_WEB_DEBUG conditional, which exposes an env var also named MONO_WEB_DEBUG that basically logs a lot of stuff to stderr.
Taloth
on 3 Dec 2018
@Taloth I can reproduce the issue with media cover resizing on OSX btw. (also the deflate native stream).
Mono version:
Mono JIT compiler version 5.16.0.221 (2018-06/b63e5378e38 Mon Nov 19 18:08:09 EST 2018)
Copyright (C) 2002-2014 Novell, Inc, Xamarin Inc and Contributors. www.mono-project.com
        TLS:           normal
        SIGSEGV:       altstack
        Notification:  kqueue
        Architecture:  amd64
        Disabled:      none
        Misc:          softdebug
        Interpreter:   yes
        LLVM:          yes(3.6.0svn-mono-release_60/0b3cb8ac12c)
        GC:            sgen (concurrent by default)
libgdiplus is on version 5.6, I presume (the latest since 2017). otool just returns version 1.0.0 on the dylib :/.
As soon as I comment these lines, the leak stops happening:
I have attached two mlpd files, one with the leak one without it.
For both, I open Radarr add around 5-6 movies and then stop the profiling. As you can see memory stays under 150MB for one, the other goes up to 450 MB and stays there.
galli-leo
on 4 Dec 2018
@Taloth So I added a command for just testing the resizing: https://github.com/Radarr/Radarr/commit/15ac4ad60c518eab49c627df2d671320a3ed0766#diff-58f96ad531234ea312dcf022c422107a
It seems like the memory increase only happens on the first call of that command. But at that a quite significant one (+150MB). Also from the profiler, I see that 10 Image Encoders are allocated in that time, that are never disposed.
EDIT: For anyone wondering, as seen above, mono does seem to have a memory leak for the WebResponseStream. So keep an eye out for a mono update, regarding that. While I don't know whether this will make a difference for Radarr, it will certainly not harm the memory usage :P
galli-leo
on 4 Dec 2018
I'm still in mono 5.10 and gdiplus 4.2, hence the question. I'll see if I can repro in a docker container since I don't want to update my production rig to a later mono version.
It's unfortunate that the command doesn't repeatedly eat memory. But more on that once I can run it.
Btw. excellent issue report to the mono team.
Taloth
on 4 Dec 2018
If I can help test let me know. I'm on 5.18.0.216.
seitzbg
on 4 Dec 2018
In docker container with 5.16.0.179 and libgdiplus 5.6 and a custom build based on your latest branch. Couldn't repro a leak. Adding a couple of movies tops out at like 350 MB resident. Manually triggering ResizeTest movieid=1 a few dozen times had practically no effect.
Installed 0.2.0.1265-djfexllc instead (test build of 2 days ago), same behavior when adding movies and running the cmd.
Moved to an ubuntu vm (created with vagrant to do some sonarr update tests). Mono 5.14.0.177, also libgdiplus 5.6. Again 0.2.0.1265-djfexllc test build.
Added a dozen series, and it peaked at 360 MB resident after a few.
Do we have a script (bash or otherwise) that we can simply invoke that'll do all the required api calls to actually reproduce the scenario?
I'm going to stop for today, worked for 11 hours and I need some relaxation. :smile:
Taloth
on 4 Dec 2018
Thank you both for this effort! :)
seitzbg
on 4 Dec 2018
@Taloth
Btw. excellent issue report to the mono team.
Thanks! Let's hope they fix it quickly :P
In docker container with 5.16.0.179 and libgdiplus 5.6 and a custom build based on your latest branch. Couldn't repro a leak. Adding a couple of movies tops out at like 350 MB resident. Manually triggering ResizeTest movieid=1 a few dozen times had practically no effect.
Installed 0.2.0.1265-djfexllc instead (test build of 2 days ago), same behavior when adding movies and running the cmd.
Hmm, that's interesting, because I moved resizing to its own command for that. i.e. DownloadCovers will push a ResizeTestCommand.
I tried some reproducing as well and I think this is just random. Sometimes the RES usage goes up by about 50-100MB per movie added, sometimes it goes down by about that much :/
However, I noticed, that the chances of getting a memory bump seem to increase, if you reload the page while executing the command. Though maybe that was also just coincidence. When I made python do a request in an infinite loop to the media cover and execute the command, memory usage stays the same.
Installed 0.2.0.1265-djfexllc instead (test build of 2 days ago), same behavior when adding movies and running the cmd.
Do you mean 0.2.0.1264? 0.2.0.1265 had the resizing removed, so it makes sense to not have increased memory.
Do we have a script (bash or otherwise) that we can simply invoke that'll do all the required api calls to actually reproduce the scenario?
That's probably a good idea.
I'm going to stop for today, worked for 11 hours and I need some relaxation. 😄
Isn't adding random movies relaxing ;)?
Anyways, thanks a lot for helping out here!
galli-leo
on 4 Dec 2018
@galli-leo I saw it yesterday too on 1265, but with 0.2.1264 I'm seeing these kind of exceptions:
[Info] RefreshMovieService: Unable to communicate with Mappings Server.

[v0.2.0.1264] System.Net.WebException: Value cannot be null.
Parameter name: src ---> System.ArgumentNullException: Value cannot be null.
Parameter name: src
  at System.Buffer.BlockCopy (System.Array src, System.Int32 srcOffset, System.Array dst, System.Int32 dstOffset, System.Int32 count) [0x00003] in <2943701620b54f86b436d3ffad010412>:0
  at System.Net.WebResponseStream+<ProcessRead>d__49.MoveNext () [0x00082] in <b3d41b23de534128a4f18a6e1312f79c>:0
   --- End of inner exception stack trace ---
  at System.Net.HttpWebRequest+<RunWithTimeoutWorker>d__244`1[T].MoveNext () [0x000c5] in <b3d41b23de534128a4f18a6e1312f79c>:0
--- End of stack trace from previous location where exception was thrown ---
  at System.Net.WebConnectionStream.Read (System.Byte[] buffer, System.Int32 offset, System.Int32 count) [0x00077] in <b3d41b23de534128a4f18a6e1312f79c>:0
  at System.IO.Compression.DeflateStreamNative.UnmanagedRead (System.IntPtr buffer, System.Int32 length) [0x00027] in <b3d41b23de534128a4f18a6e1312f79c>:0
  at System.IO.Compression.DeflateStreamNative.UnmanagedRead (System.IntPtr buffer, System.Int32 length, System.IntPtr data) [0x00019] in <b3d41b23de534128a4f18a6e1312f79c>:0
  at (wrapper native-to-managed) System.IO.Compression.DeflateStreamNative.UnmanagedRead(intptr,int,intptr)
  at (wrapper managed-to-native) System.IO.Compression.DeflateStreamNative.ReadZStream(System.IO.Compression.DeflateStreamNative/SafeDeflateStreamHandle,intptr,int)
  at System.IO.Compression.DeflateStreamNative.ReadZStream (System.IntPtr buffer, System.Int32 length) [0x00000] in <b3d41b23de534128a4f18a6e1312f79c>:0
  at System.IO.Compression.DeflateStream.ReadInternal (System.Byte[] array, System.Int32 offset, System.Int32 count) [0x00027] in <b3d41b23de534128a4f18a6e1312f79c>:0
  at System.IO.Compression.DeflateStream.Read (System.Byte[] array, System.Int32 offset, System.Int32 count) [0x00071] in <b3d41b23de534128a4f18a6e1312f79c>:0
  at System.IO.Compression.GZipStream.Read (System.Byte[] array, System.Int32 offset, System.Int32 count) [0x00006] in <b3d41b23de534128a4f18a6e1312f79c>:0
  at NzbDrone.Common.Extensions.StreamExtensions.ToBytes (System.IO.Stream input) [0x0001c] in <7d3d218e60314c008c8d0dc83cdf042b>:0
  at NzbDrone.Common.Http.Dispatchers.ManagedHttpDispatcher.GetResponse (NzbDrone.Common.Http.HttpRequest request, System.Net.CookieContainer cookies) [0x00141] in <7d3d218e60314c008c8d0dc83cdf042b>:0
  at NzbDrone.Common.Http.Dispatchers.FallbackHttpDispatcher.GetResponse (NzbDrone.Common.Http.HttpRequest request, System.Net.CookieContainer cookies) [0x0009d] in <7d3d218e60314c008c8d0dc83cdf042b>:0
  at NzbDrone.Common.Http.HttpClient.ExecuteRequest (NzbDrone.Common.Http.HttpRequest request, System.Net.CookieContainer cookieContainer) [0x0007e] in <7d3d218e60314c008c8d0dc83cdf042b>:0
  at NzbDrone.Common.Http.HttpClient.Execute (NzbDrone.Common.Http.HttpRequest request) [0x00008] in <7d3d218e60314c008c8d0dc83cdf042b>:0
  at NzbDrone.Common.Http.HttpClient.Get (NzbDrone.Common.Http.HttpRequest request) [0x00007] in <7d3d218e60314c008c8d0dc83cdf042b>:0
  at NzbDrone.Core.MetadataSource.RadarrAPI.RadarrAPIClient.Execute (NzbDrone.Common.Http.HttpRequest request) [0x00008] in <8aff0e336d1a49a9bc9c2977dfc3953f>:0
  at NzbDrone.Core.MetadataSource.RadarrAPI.RadarrAPIClient.Execute[T] (NzbDrone.Common.Http.HttpRequest request) [0x00023] in <8aff0e336d1a49a9bc9c2977dfc3953f>:0
  at NzbDrone.Core.MetadataSource.RadarrAPI.RadarrAPIClient.AlternativeTitlesAndYearForMovie (System.Int32 tmdbId) [0x00042] in <8aff0e336d1a49a9bc9c2977dfc3953f>:0
  at NzbDrone.Core.Movies.RefreshMovieService.RefreshMovieInfo (NzbDrone.Core.Movies.Movie movie) [0x00399] in <8aff0e336d1a49a9bc9c2977dfc3953f>:0
With that version I did manage to get it to 550mb resident, but it seems to level out too.
Adding like 20 series after reaching 550MB didn't do anything significant.
Even if the different versions have different behavior, that does mean that it's not a 'leak'. I was hoping to see something that grows continuously.
Is this in line with your tests? I recall reports of gigabytes of resident memory usage.
I tried some reproducing as well and I think this is just random. Sometimes the RES usage goes up by about 50-100MB per movie added, sometimes it goes down by about that much :/
Taloth
on 5 Dec 2018
@Taloth I think those exceptions are unrelated.
With that version I did manage to get it to 550mb resident, but it seems to level out too.
Adding like 20 series after reaching 550MB didn't do anything significant.
Even if the different versions have different behavior, that does mean that it's not a 'leak'. I was hoping to see something that grows continuously.
Is this in line with your tests? I recall reports of gigabytes of resident memory usage.
I can somewhat replicate that high memory usage on 1264. I got up to 1.723g RSS before stopping.
What definitely keeps increasing the memory usage by a lot, is the bulk importer. Have you tried bulk importing a lot of movies? Also, it seems like it evened out at 500MB, but then I removed all movies from the library and it started to rise again when adding movies. Maybe worth a try (using discovery can speed up adding movies a lot btw. :P).
However, I saw something else interesting just now in the logs:
[Warn] HttpClient: Failed to get response from: http://image.tmdb.org/t/p/original/3P52oz9HPQWxcwHOwxtyrVV1LKi.jpg An exception occurred during a WebClient request.
[Warn] MediaCoverService: Couldn't download media cover for [Deadpool 2 (2018)][tt5463162, 383498]. An exception occurred during a WebClient request.

[v0.1.0.38618] System.Net.WebException: An exception occurred during a WebClient request. ---> System.IO.IOException: Sharing violation onpath /root/.config/Radarr/MediaCover/139/fanart.jpg
  at System.IO.FileStream..ctor (System.String path, System.IO.FileMode mode, System.IO.FileAccess access, System.IO.FileShare share, System.Int32 bufferSize, System.Boolean anonymous, System.IO.FileOptions options) [0x0019e] in <0f8aeac9d63d4b8aa575761bb4e65b79>:0
  at System.IO.FileStream..ctor (System.String path, System.IO.FileMode mode, System.IO.FileAccess access, System.IO.FileShare share, System.Int32 bufferSize, System.Boolean isAsync, System.Boolean anonymous) [0x00000] in <0f8aeac9d63d4b8aa575761bb4e65b79>:0
  at System.IO.FileStream..ctor (System.String path, System.IO.FileMode mode, System.IO.FileAccess access) [0x00000] in <0f8aeac9d63d4b8aa575761bb4e65b79>:0
  at (wrapper remoting-invoke-with-check) System.IO.FileStream..ctor(string,System.IO.FileMode,System.IO.FileAccess)
  at System.Net.WebClient.DownloadFile (System.Uri address, System.String fileName) [0x00022] in <c0e40d34c25e4827874530676d4126b9>:0
   --- End of inner exception stack trace ---
  at System.Net.WebClient.DownloadFile (System.Uri address, System.String fileName) [0x00096] in <c0e40d34c25e4827874530676d4126b9>:0
  at System.Net.WebClient.DownloadFile (System.String address, System.String fileName) [0x00008] in <c0e40d34c25e4827874530676d4126b9>:0
  at (wrapper remoting-invoke-with-check) System.Net.WebClient.DownloadFile(string,string)
  at NzbDrone.Common.Http.HttpClient.DownloadFile (System.String url, System.String fileName) [0x000c4] in <eb8022a0312640a0907ac646d9cf1287>:0
  at NzbDrone.Core.MediaCover.MediaCoverService.DownloadCover (NzbDrone.Core.Movies.Movie movie, NzbDrone.Core.MediaCover.MediaCover cover) [0x00047] in <b20ee398228541d8b97282eda8b55765>:0
  at NzbDrone.Core.MediaCover.MediaCoverService.EnsureCovers (NzbDrone.Core.Movies.Movie movie, System.Int32 retried) [0x0005a] in <b20ee398228541d8b97282eda8b55765>:0

[Warn] MediaCoverService: Retrying for the 1. time in ten seconds.
Could it be that there is a race condition? (or could the race condition be the reason for memory leakage. Seems really likely that there is a race condition there). Due to the fact that we download / resize media covers when adding and updating a movie? This could maybe cause the resizing job to be confused and leak memory?
Which would explain why I have trouble replicating it on the latest builds, where I moved the resizing to a command. That shouldn't get called twice.
galli-leo
on 5 Dec 2018
What definitely keeps increasing the memory usage by a lot, is the bulk importer. Have you tried bulk importing a lot of movies? Also, it seems like it evened out at 500MB, but then I removed all movies from the library and it started to rise again when adding movies. Maybe worth a try (using discovery can speed up adding movies a lot btw. :P).
I just search for a keyword and add everything in the list. :smile:
I'll check the bulk importer tonight.
Could it be that there is a race condition? (or could the race condition be the reason for memory leakage. Seems really likely that there is a race condition there). Due to the fact that we download / resize media covers when adding and updating a movie? This could maybe cause the resizing job to be confused and leak memory?
I don't think so because you're not adding the same series twice so any potential parallel operation would be doing different series.
Taloth
on 6 Dec 2018
I don't think so because you're not adding the same series twice so any potential parallel operation would be doing different series.
I wasn't thinking the series get's added twice, but that first the SeriesAddedEvent is broadcasted and then immediately afterwards the SeriesUpdatedEvent:
This would lead to DownloadMediaCovers being called twice for the same movie, in a short timespan, right?
galli-leo
on 6 Dec 2018
Euhm... MediaCoverService handles those MovieAdded/Updated/DeletedEvent events async.
Async events are handled completely concurrent on the thread pool, not on the command threads.
So the execution pipeline becomes:
- MovieService.AddMovie publishes MovieAddedEvent
- synchronous MediaAddHandler handles event and queues RefreshMovieCommand
- async MediaCoverService handles AddedEvent, calls EnsureCovers and publishes MediaCoversUpdatedEvent
- async RefreshMovieService executes RefreshMovieCommand and publishes MovieUpdatedEvent
- async MediaCoverService handles UpdatedEvent, calls EnsureCovers and publishes MediaCoversUpdatedEvent
So yes, it's not just in short timespan, theoretically it's even concurrent. Whether that affects the behavior remains to be seen.
Taloth
on 6 Dec 2018
@Taloth So it seems like moving the MediaCover resizing to its own command fixes the memory leak for bulk import (and also normally adding movies). Memory usage at 500MB still seems a bit high, but I can live with that if it doesn't increase beyond that.
What do you think the reason for that could be? Timing issue that causes resources not to be freed correctly?
galli-leo
on 14 Dec 2018
@galli-leo Can i apply this fix to my install too? Or do i have to wait for a new release? I'm running the docker container from linuxserver
 coenboomkamp
on 14 Dec 2018
coenboomkamp
on 14 Dec 2018
@coenboomkamp I would strongly recommend you to wait. There should be a release in a week containing this fix. If you cannot wait however, you can use the following link with hotio's suitarr container:
https://ci.appveyor.com/api/buildjobs/i9ukc72jh0pxu6uh/artifacts/_artifacts%2FRadarr.develop.0.2.0.1283-wortgkkw.linux.tar.gz
Please make enough backups, I am not responsible for anything that goes wrong with your db :)
galli-leo
on 14 Dec 2018
@galli-leo The command queue can only be serviced on 3 threads in Sonarr (2 in Radarr iirc). Which means the chance of concurrency is much lower vs async tasks on the threadpool. So in theory, throwing a lock in the download+resize logic would have the same outcome as turning it into a command.
(Architecturally it shouldn't be a command though, imho)
One difference with Sonarr is that we don't do MediaCovers on SeriesAddedEvent, we only do it on SeriesUpdatedEvent. So for us there is little to no concurrency there.
As for the reason, I really don't know. Being able to reproduce it in a Console app might tell us more, but otherwise it's just wild guesses.
Taloth
on 14 Dec 2018
@coenboomkamp I would strongly recommend you to wait. There should be a release in a week containing this fix. If you cannot wait however, you can use the following link with hotio's suitarr container:
https://ci.appveyor.com/api/buildjobs/i9ukc72jh0pxu6uh/artifacts/_artifacts%2FRadarr.develop.0.2.0.1283-wortgkkw.linux.tar.gzPlease make enough backups, I am not responsible for anything that goes wrong with your db :)
Okay no worries, i'll wait thnx! Is there a changelog i can find somewhere?
Saw that the latest release came out last night, can't find what was updated though.
coenboomkamp
on 15 Dec 2018
Still getting this, crashed my dedi today :)
ssolidus
on 17 Dec 2018
Still getting this, crashed my dedi today :)
Thnx for the update, i won't try it yet haha
coenboomkamp
on 17 Dec 2018
@ssolidus Was that with the new build linked above? Or just the normal develop release?
galli-leo
on 17 Dec 2018
@Taloth Shouldn‘t the command queue be „locked“ by itself? Since it will not push a duplicate command? Or have I misread that part of the code?
May I ask why it shouldn‘t be a command, architecturally? Should be easy to change.
Interesting that you do not do that for Sonarr, might be another reason why the „memory leak“ is more noticeable on Radarr.
Honestly, I don‘t really care about reproducing it at this point 😅. Since it seems to be good on the latest build, I am fine with that, even if we don‘t really know what‘s going on.
galli-leo
on 17 Dec 2018
@galli-leo Afaik the commandqueue refuses to queue a duplicate command with the same properties yes.
The question you have to ask yourself is whether it's an integral part of the Refresh Movie process, instead of some standalone process that you're queuing.
All our commands are something that the user/scheduler initiates. Whereas by contrast the EnsureMediaCoversCommand is exclusively queued by, let's face it, itself.
I wouldn't call it wrong, but it's a concern.
Why was it even an AsyncEvent instead of a synchronous one? I suspect we made it async because it involves potentially downloading multi-megabytes of images and we didn't want to block the refresh process. Especially since updating the show metadata is 1 remote http call to skyhook, whereas the covers are several. Potentially introducing several timeouts and slowing down the process of adding shows or refreshing them. (Adding shows is one of the first functional experiences the user gets, so we like that fast)
We only do it on SeriesUpdated because SeriesAdded inevitably leads to a SeriesUpdated event anyway, so doing it twice is kinda redundant. But it should not have been a problem to do it twice in a short time span.
Taloth
on 17 Dec 2018
Somehow my Radarr won't even load anymore, anyone familiar with this error?
NzbDrone.Common.Http.HttpException: HTTP request failed: [404:NotFound] [GET] at [http://radarr.aeonlucid.com/v1/update/master?version=0.2.0.1217&os=linux]
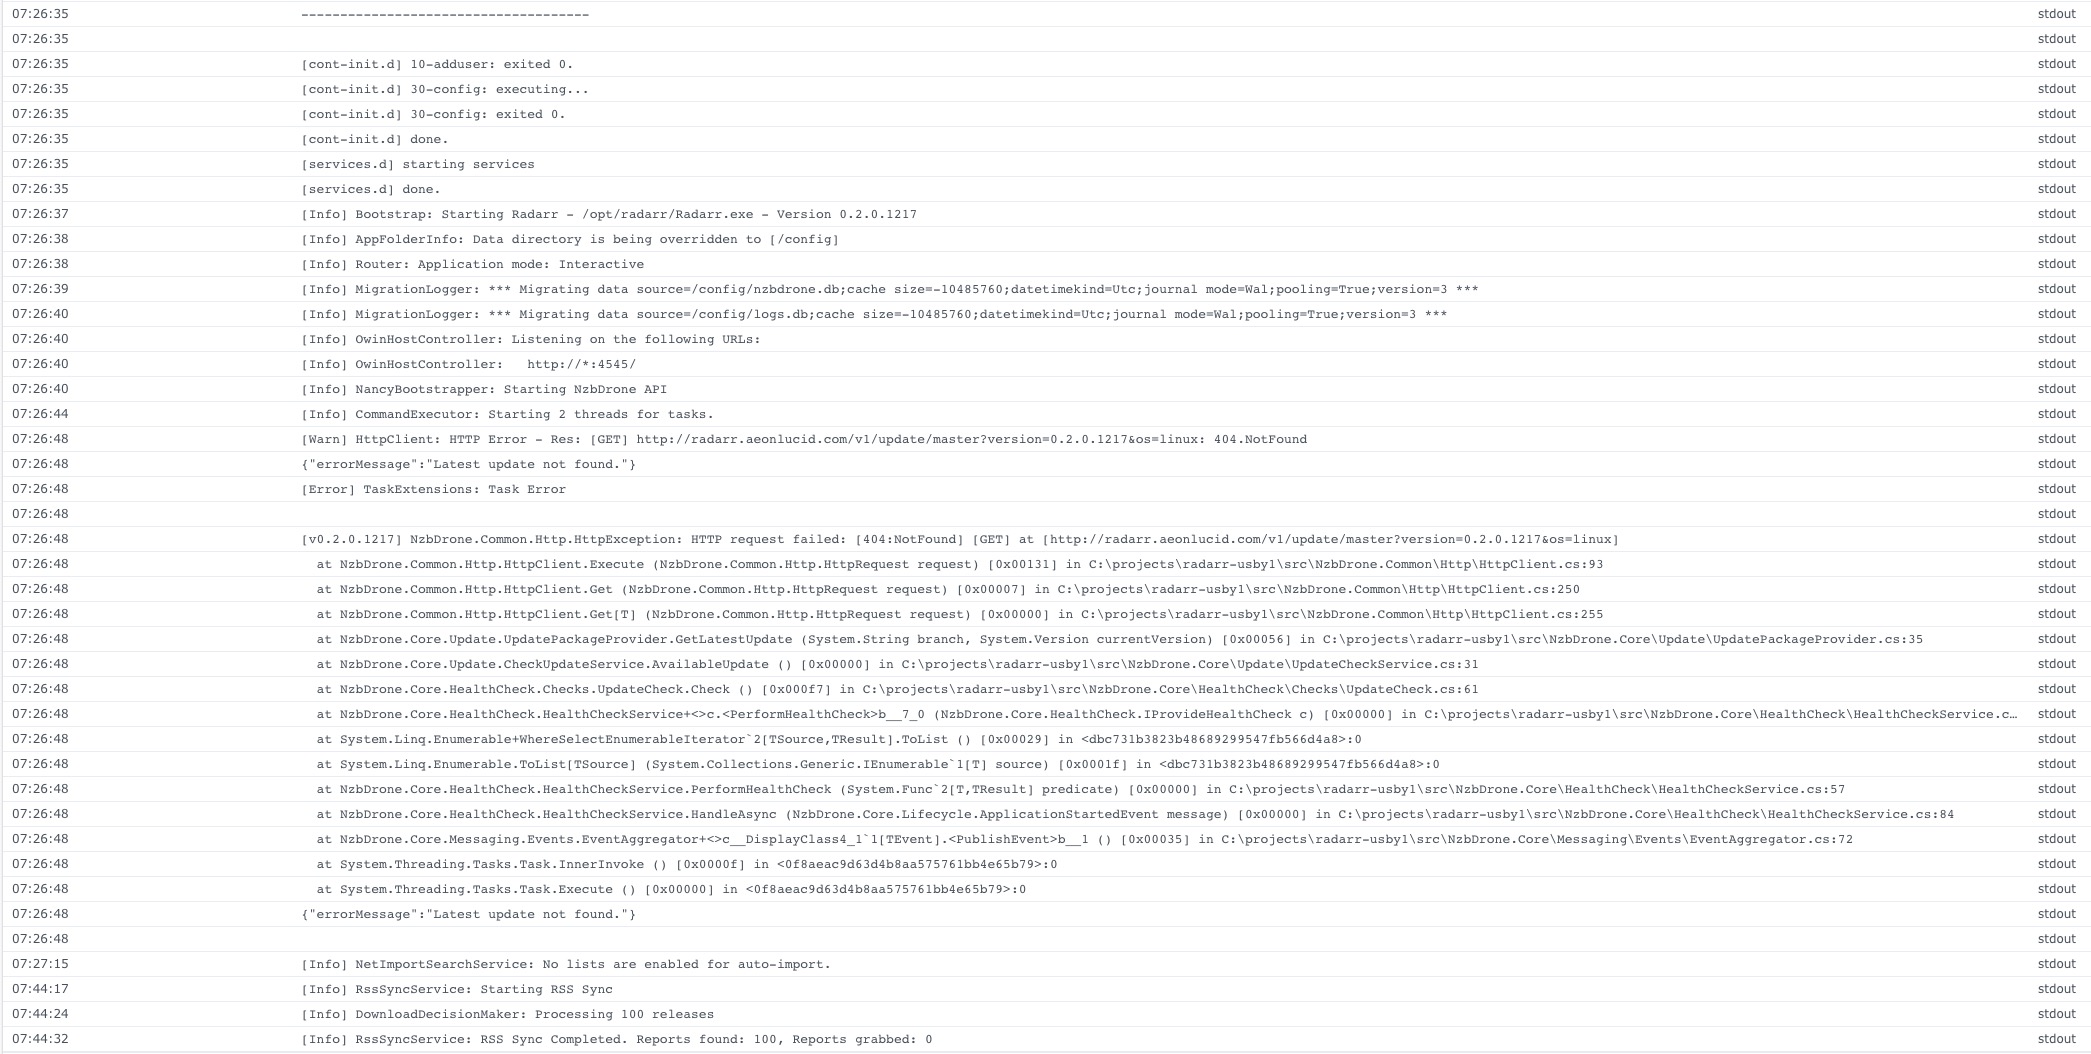
coenboomkamp
on 18 Dec 2018
Somehow my Radarr won't even load anymore, anyone familiar with this error?
@coenboomkamp This is because your update channel is set to master. There is no branch with that name. You should switch it to either develop or nightly under:
Settings > Enable Advanced Settings in top right > General > change the value labelled Branch under section Updates

You can check that these values work by replacing the master value in that URL. With develop I get false (no update), and withnightly` I get this:
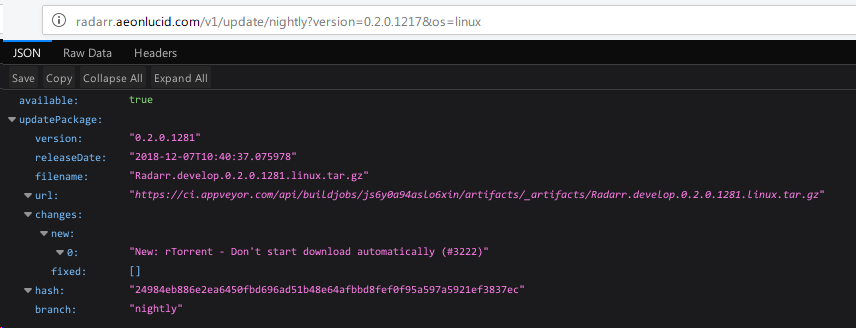
@ssolidus Was that with the new build linked above? Or just the normal develop release?
@galli-leo It is the nightly channel. I refrain from deploying non-update channel versions of software with release channels because it can create update problems later and defeats the point of update channels. For issues like this they should make a separate branch for possible changes/fixes. Ideally:
- Release a stable version to update channel called
stable - Rename
developchannel tobeta, (also helps clear up confusion) - Rename
nightlytorollingorunstable - Change this new experimental branch to
nightly,devexperimentalso you can see if certain fixes work for users
Also, this repository is in dire need of a branch cleanup. There shouldn't be this many feature/fix branches already merged into a main channel/deployment branch once it makes it to stable release.
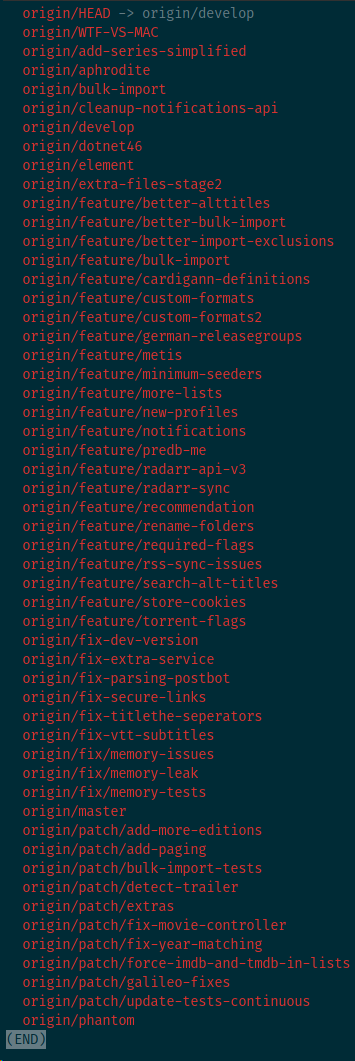
ssolidus
on 18 Dec 2018
Thank you @ssolidus reason why is was master is because it advices not to use develop or nightly:

But it is on develop now, and Radarr is up again. It is on version 0.2.0.1217. Is the memory leak supposed to be fixed in this version? Then i will try to import more movies :)
Thnx for all the help 👍
coenboomkamp
on 18 Dec 2018
@coenboomkamp If you are using docker, please do not use develop or nightly branches. In fact, - for most apps, never upgrade the app in the docker container. This will lead to data corruption. Instead pull an updated docker image.
galli-leo
on 18 Dec 2018
@ssolidus > @galli-leo It is the nightly channel. I refrain from deploying non-update channel versions of software with release channels because it can create update problems later and defeats the point of update channels.
That is fine. I was asking to see if the new build causes other issues.
For issues like this they should make a separate branch for possible changes/fixes.
This is not really possible, due to the nature of our database migrations. If you were to switch between two different feature branches, your database would be corrupted. However, for those eager to try out, we do provide automated builds for all branches on the repo. Therefore, using hotio's suitarr and enough backups, one can test out these builds / use them if they deem the fixes worth it.
Ideally:
Release a stable version to update channel called stable
Rename develop channel to beta, (also helps clear up confusion)
Rename nightly to rolling or unstable
Change this new experimental branch to nightly, dev experimental so you can see if certain fixes work for users
This is already the case, just with different names. Well, we do not have a "stable" channel yet, but that's basically develop right now. Once we get v1.0 out, we plan on switching to a more consistent release scheme.
Also, this repository is in dire need of a branch cleanup. There shouldn't be this many feature/fix branches already merged into a main channel/deployment branch once it makes it to stable release.
While I agree, not sure what this has to do with anything. No one except developers will see those.
This has really gone off topic, so please continue any discussion not directly related to the memory leaks in question to either Discord or the Subreddit.
galli-leo
on 18 Dec 2018
@coenboomkamp If you are using docker, please do not use develop or nightly branches. In fact, - for most apps, never upgrade the app in the docker container. This will lead to data corruption. Instead pull an updated docker image.
Thanks for the reply @galli-leo! Sorry to go a bit off topic here.
So should what should i set as my branche for my docker containers? I'm using Radarr, Sonarr, Plex and sabNZBD. Should i leave it as master? Or latest?
So with new updates i should export my settings, backup my docker/appnamefolder. And then reinstall the updated image, import settings, and copy over my app folder?
I'm fairly new to docker so i'm just double checking 👍
coenboomkamp
on 18 Dec 2018
@coenboomkamp you were literally just asked to take further OT discussions out of this ticket. The short answer is: use docker to upgrade, don't try and upgrade things inside containers, because containers are ephemeral. Now, please take it elsewhere so we can stop spamming all the subscribers on this issue.
 pdf
on 18 Dec 2018
pdf
on 18 Dec 2018
If you are using docker, please do not use develop or nightly branches. In fact, - for most apps, never upgrade the app in the docker container. This will lead to data corruption. Instead pull an updated docker image.
@galli-leo
Sorry if I mislead him with the solution, I didn't realise he was in Docker. Thanks for all the clarification btw. I just tried updating to the latest nightly but at this point I am getting memory leaks so fast I cannot update the app. I tried deleting all old log files and old db files.
ssolidus
on 19 Dec 2018
@galli-leo I did some more tests, the DeflateStreamNative leak is easily reproducible by a Console app that does nothing but requests of /index.js, but not actually reading the ResponseStream. I simply did it 10000x in a loop and voila. However, the leak only eats like 150MB for 10000 requests. Profiles of other users indicate a far smaller number of DeflateStreamNative instances live but gigabytes of mem usage. So while there is a leak there, it's not as big as we hoped (ironically).
Disabling AutomaticDecompression in the console app prevents the DeflateStream from being used, so no leak then.
I was using sonarr as webserver during the tests and I noticed suddenly a 1.5 GB+ mem usage, despite the sonarr instance doing little but serve static content.
Disabling AutomaticDecompression in the console app _also_ prevented the memory leak in Sonarr. Since not having Accept-Encoding: gzip prevents the GzipPipeline from creating the gzip stream.
So there's something wrong there, and it's quite easily reproducible.
Most concerning there is that a profiling session did not reveal any significant instances, despite being called 10000x. Which means that the way we do gzip there causes a true unmanaged leak in mono.
And one user, experiencing a huge leak, coincidently uses Bazarr which does an unholy amount of api calls every 5 minutes. So I'm definitely considering this a good candidate for _the_ major leak we've been seeing.
I'm going to try a few variations of GzipPipeline.
Taloth
on 24 Dec 2018
@Taloth That's interesting. Seems like both "sides" compressing and decompressing could be causing issues.
However, the leak only eats like 150MB for 10000 requests. Profiles of other users indicate a far smaller number of DeflateStreamNative instances live but gigabytes of mem usage. So while there is a leak there, it's not as big as we hoped (ironically).
Could this be, due to the request not returning a large amount of data? Have you tried what happens if you request a 50MB file instead?
I'm going to try a few variations of GzipPipeline.
Sounds good. Could you send me the console app as well? Want to have a go at finding the issue as well :)
Could you also try compiling this fork of mono: https://github.com/galli-leo/mono/tree/fix/inner-stream-leaking? It should fix the DeflateNativeStream leaking for Decompression in the WebResponseStream.
galli-leo
on 24 Dec 2018
Repo, obviously adjust the hardcoded url to test with: https://gist.github.com/Taloth/26d9dba5cbfc7b5498e7c9aac05e46b0
Taloth
on 24 Dec 2018
@galli-leo holy crap... DeflateStream leaks like a sieve if you throw an exception in the underlying stream Write. So in the GzipPipeline, if the remote connection is terminated, an IO exception will be thrown and voila.
I've written some code that works around it, locally it appears to work, but i'm gonna deploy that version to a user first, see if his 5GB after 9h changes. I won't be able to report back till tomorrow.
Taloth
on 24 Dec 2018
@Taloth Oh yeah. I just looked at the native c code and they do nothing about exceptions there. So this will leak a lot of stuff. Will try to dig some more around the mono end. Did you do something specific to get an exception thrown in the GzipPipeline?
galli-leo
on 24 Dec 2018
For testing I used a separate console app that used GzipStream wrapped around a ThrowingStream that simply throws after 10000 bytes. I change GzipPipeline to catch the exception and throw it elsewhere instead. Workaround, but it fixed the leak I could repro.
Unfortunately on the user install a leak is still there... again gotta be something else. I haven't been able to copy&analyze the new profile log yet.
Taloth
on 24 Dec 2018
@Taloth I cannot really seem to reproduce your memory leak for ThrowingStream on macOS. Might be a linux specific issue with regards to how the transition managed -> native is handled with exceptions?
Anyways, that should be fixed though. Are you gonna open an issue on mono's repo or should I open one?
However, if I just leave it like it is and request a 20 MB file in the loop through Radarr that leaks a lot. (Like 1GB in a minute easily). So I will dig some more there.
Unfortunately on the user install a leak is still there... again gotta be something else. I haven't been able to copy the new profile log.
:( Have you had time to try the mono without the DeflateStream leak inside WebResponseStream? If Bazarr does a lot of API calls, I think decompression when receiving might be the bigger culprit, compared to Bazarr compressing when sending.
galli-leo
on 25 Dec 2018
@Taloth I have uploaded a memory profile of running Radarr and constantly accessing a 20MB file via it's web server (it's being gzipped). I haven't found anything that interesting except DeflateNativeStream.UnmanagedReadWrite.
https://galli.me/crazy_leak.mlpd
galli-leo
on 25 Dec 2018
this is the full test code I was using. But there well might be a difference between mac and linux. So output from mono --debug MonoDeflateStream.exe on 5.16 in ubuntu vm:
Starting test
Cycle 0...  45449216 bytes working set
Cycle 1...  80171008 bytes working set
Cycle 2...  107417600 bytes working set
Cycle 3...  134664192 bytes working set
Cycle 4...  161792000 bytes working set
Cycle 5...  188928000 bytes working set
Cycle 6...  216018944 bytes working set
Cycle 7...  242479104 bytes working set
Cycle 8...  269938688 bytes working set
Cycle 9...  297492480 bytes working set
For the UnmanagedReadOrWrite (which iirc is a delegate that gets pinned so that the c code can call back to the managed base stream), there are only 7 instances live at snapshot 5. I don't notice anything weird either. I wonder what valgrind says.
It's also interesting to see what happens if we tear out the entire business layer and only include the StaticResourceModule, but that's a bit too much work for now.
And no, I didn't want to recompile mono yet. I simply stopped using AutomaticDecompression. No DeflateStreamNative in memory, yet 3 GB RSS (5 GB Virt) in 30 minutes.
PS I've been using --profile=log:nodefaults,counters,gcroot,gcmove,heapshot=1800000ms,output=... it doesn't collect allocation stacktraces and as such can run for a few hours before becoming unmanageable. You can do heapshots more frequently for Radarr, but 30 min is a sweetspot for the system (with 1500+ series) I'm testing with now.
Taloth
on 25 Dec 2018
@Taloth Interesting I will try the program as well.
Yeah the UnmanagedReadWrite is the callback that could be the memory leak if the base stream throws in there.
Regarding valgrind, last time I tried it, it didn’t really help. I did try Instruments yesterday and that did have some interesting stuff. Namely, it seems that the native part of DeflateNativeStream leaks, eventhough that was a mono version with the fix for WebResponseStream (Also there were a lot of leaks from there, so it shouldn’t be the leak we already found). Unfortunately, I neither grabbed a screenshot nor did it resolve tge backtrace further than CreateZStream. I will see if I can get a better backtrace.
galli-leo
on 25 Dec 2018
@Taloth Also btw. I played around a bit yesterday with refresh movie, i.e. pushed a new command for every movie instead of just calling the function and I had a bunch of database locked errors. I remember seeing something somewhere about that, but the consensus seemed to be it was due to other apps accessing it. However, when I merged in my changes from the memory issues branch fix (i.e. disposing of the data mapper correctly) they did not occur anymore. So seems like not disposing correctly can lead to concurrency issues. Might be worth investigating some more.
galli-leo
on 25 Dec 2018
@Taloth I can reproduce the memory leak with ThrowingStream with your program on OSX.
I also found the memory leak for when the stream throws an error:
- You call
Writeon the DeflateNativeStream. DeflateNativeStreamcalls the native methodWriteZStreampassing along aSafeDeflateStreamHandle.- Because this is a native call, the reference count of
SafeDeflateStreamHandleis increased. - The native part calls
UnmanagedWrite. - If there is an exception there, mono will unwind the stack and NOT decrease the reference count of
SafeDeflateStreamHandle. Therefore, when we try to dispose of that, it will not do that, since the reference count is 2.
This should be fixed in mono and I can open an issue on their end. (Also relatively easy to fix).
I haven't yet had time to find out why the leak also occurs without the throwing stream, your Program does not have the leak when I try without the throwing stream.
Edit: So the "crazy" leak from above seems to be due to the same reason. If you don't read a webResponse stream, the connection is apparently closed and hence an exception thrown.
After adjusting your first test program, I cannot get the memory usage to grow. Did you get 3GB RSS by just continuously requesting stuff from Sonarr?
galli-leo
on 25 Dec 2018
I throw the exception to emuate a terminated network connection (NetworkStream), but you already drew that conclusion in your Edit.
I'm surprised the reference count isn't decreased after an exception. To me that seems to be a bigger issue because that would indicate that SafeHandle doesn't behave as it's supposed to.
The 3GB RSS is in a production environment with 1500+ shows and Bazarr nagging continuously at the api. So the 'leak' there is likely a combination of causes, including sqlite coz it has like a dozen db reads per second on that system.
Afaik I've excluded DeflateStream as possible cause, because on my branch I replaced the AutomaticDecompression with first loading the entire stream into a buffer, and then running GZip over that. In GZipPipeline I ensured exceptions never make it into the zlib native layer.
It's difficult to measure if the changes so far have reduced the leakage. It no longer has DeflateStreamNative instances in memory, but I don't think that has a huge impact.
_PS: To explain, 1500+ shows, and like a thousand TrackedDownloads, each having a RemoteEpisode, Series and Episode list in memory... totalling 3000 Episodes and related models. But all that makes for a total 83 MB managed memory. It just doesn't explain the unmanaged memory usage, and I hate that._
Taloth
on 25 Dec 2018
@Taloth > I throw the exception to emuate a terminated network connection (NetworkStream), but you already drew that conclusion in your Edit.
Just to make sure: You also don't see memory growing if you don't throw an exception inside your Sonarr GZipPipeline?
I'm surprised the reference count isn't decreased after an exception. To me that seems to be a bigger issue because that would indicate that SafeHandle doesn't behave as it's supposed to.
The problem is, mono unwinds the stack until it finds a catch or finally block whenever an exception occurs. So the native code has no way to react to that. It simply stops executing anything from there. Well the SafeHandle function does have a few "Dangerous" functions there. I think it works correctly, maybe you are not supposed to use a SafeHandle for such things?
The 3GB RSS is in a production environment with 1500+ shows and Bazarr nagging continuously at the api. So the 'leak' there is likely a combination of causes, including sqlite coz it has like a dozen db reads per second on that system.
Agreed. I think the two mono leaks should help already though (I hope).
Afaik I've excluded DeflateStream as possible cause, because on my branch I replaced the AutomaticDecompression with first loading the entire stream into a buffer, and then running GZip over that. In GZipPipeline I ensured exceptions never make it into the zlib native layer.
It's difficult to measure if the changes so far have reduced the leakage. It no longer has DeflateStreamNative instances in memory, but I don't think that has a huge impact.
Just to make sure: You have tried disabling GZip in Sonarr entirely right? If so, that means something else is going on.
I tried reproducing your scenario (albeit with far less models going on), but after 1 hour or so (with 3 clients making calls as fast as possible) the memory usage did not increase beyond 150MB at any time (both on OSX and Linux). With a database of 40k movies I do see the RAM usage going occasionally up to 1.2 GB (Radarr also concurrently did a list import, so even more movies loaded), but IMO that's understandable. The json output of so many movies alone is 80MB (not encoded) and I am hitting it with 3 clients again. So loading these all into memory must take at least twice that much RAM, if not more. Furthermore, it seems to drop down to 700-800MB again and again. However, this has only been running for 5+ minutes and has all the memory leak fixes integrated. So maybe those do help?
galli-leo
on 25 Dec 2018
Just to make sure: You also don't see memory growing if you don't throw an exception inside your Sonarr GZipPipeline?
No. Inside my VM. Sonarr leaks if I call the api using the test app without reading the response stream. With the GZipPipeline patched with the ExceptionSafeGZipStream, then I don't get that particular leak anymore inside my VM.
The problem is, mono unwinds the stack until it finds a catch or finally block whenever an exception occurs. So the native code has no way to react to that. It simply stops executing anything from there. Well the SafeHandle function does have a few "Dangerous" functions there. I think it works correctly, maybe you are not supposed to use a SafeHandle for such things?
Are you sure the mono runtime actually increases the refcount? All the code I could find simply holds on to the reference.
Edit: Hm, yes in marshal-ilgen.c emit_marshal_safehandle...
Next question is whether PInvoke has a try-catch of it's own.
Just to make sure: You have tried disabling GZip in Sonarr entirely right? If so, that means something else is going on.
No, I haven't. Given that running GZipStream in an isolated test doesn't leak at all, I assumed that disabling gzip entirely wasn't necessary. I'll do a test without, for good measure.
However, this has only been running for 5+ minutes and has all the memory leak fixes integrated. So maybe those do help?
So far I only have 3 fixes active: GZipPipeline patched, AutomaticDecompression disabled and a fix in Marr.DataMapper that kept thousands of sqlite connections alive for all LazyLoaded instances.
Taloth
on 25 Dec 2018
@Taloth
Edit: Hm, yes in marshal-ilgen.c emit_marshal_safehandle...
Next question is whether PInvoke has a try-catch of it's own.
From what I have read not. There is a way to handle exceptions (even c# ones), but only in C++ and IIRC using MSVC. Most stuff I have read, just recommends dealing with all exceptions inside the native code and hoping you don't get a ThreadAbortException on the return statement. Also from what I have seen all other places PInvoke is used in the mono class libraries, that pattern is followed.
After about an hour of hammering the 40k Radarr instance memory usage is still hovering at around 700-800MB.
A fix in Marr.DataMapper that kept thousands of sqlite connections alive for all LazyLoaded instances.
Could you point me to that commit? I don't think I have found that one yet :P
galli-leo
on 26 Dec 2018
You don't have to handle the exception in C, during PInvoke a lot of stuff is emitted to marshal parameters including AddRef and Release, that's all just IL code that can have it's own try catch. That's why it's useful to get input from the mono devs first about how SafeHandle should behave in case of exceptions. My concern is that adding try catch to each PInvoke might have a performance impact.
emit_native_wrapper_ilgen does all the magic for emitting a PInvoke call. Tweaking that doesn't seem trivial.
A feasible alternative might be to do the try catch in the UnmanagedWrite/Read, but that only fixes this specific situation.
LazyLoaded incorrect usage of a closure keeps the parent Mapper alive: https://github.com/Sonarr/Sonarr/commit/17d0af983a10a5a763730635d5e1a9c66fc61762
Taloth
on 26 Dec 2018
@Taloth Ah I see what you mean now, yeah that could potentially work, but it’s going to be messy as well.
Yeah the try catch in UnmanagedRead was what I was suggesting as a solution, sorry if that was unclear. Other PInvoke calls do exactly that for managed callbacks. I do wonder now, whether .NET also increases the ref count before a native call / how they handle exceptions.
Thanks for the commit (and all other help!) will include that in the PR as well.
galli-leo
on 26 Dec 2018
.NET doesn't use a callback, it uses a pull method where it writes the input to the native layer and then reads the output from the native layer. And that in a loop till everything is processed. https://referencesource.microsoft.com/#System/sys/System/IO/compression/DeflateStream.cs,508
Taloth
on 26 Dec 2018
@galli-leo I have a confession to make. That -10.Megabytes bug that I predicted shouldn't have an impact greater than the db size? I was soooo wrong. The user had a 450 MB main db, so on housekeeping+vacuum the RSS+Virt grew by big chunks of memory till hit started hitting the physical ram limit. And albeit more slowly, during normal db operations such as with tons of api calls by Bazarr.
I currently have gzip disabled and 10 mb cache instead of 10 gb, it seems stable for the last few hours (RSS 400MB Virt 2300MB). If it remains table I'll undo the gzip stuff, coz that ought to be fixed upstream in mono, and I rather not have a workaround unless it has a big impact.
Taloth
on 27 Dec 2018
@Taloth No worries :) Thanks for all your help! Out of curiosity, do you have an idea why the RAM usage grows beyond the db size? After reading the documentation, it seems like it only caches pages, so those shouldn‘t be bigger than the actual file, or am I missing something?
So it looks like the memory issues are finally „fixed“. I will try to get the pr merged tomorrow and see if anything else pops up before doing a release.
galli-leo
on 28 Dec 2018
I have the problem that currently radarr is eating 200 - 300% cpu (Linux) but without doing anything as it seems.
it has 8 cores (it runs on docker in a VM) and was running fine a few weeks ago.
This just started like a week ago.
I already disabled rss sync, this fixxed it for a while, but now its at 200% cpu again.
Is there something i can do?
Reinstalling radarr / reseting radarr would be the last solution for me, as my movie database is a bit big and i really dont want to import everything again...
 RaymondSchnyder
on 29 Dec 2018
RaymondSchnyder
on 29 Dec 2018
File a new issue please @RaymondSchnyder
pdf
on 29 Dec 2018
I have the problem that currently radarr is eating 200 - 300% cpu (Linux) but without doing anything as it seems.
it has 8 cores (it runs on docker in a VM) and was running fine a few weeks ago.
This just started like a week ago.
I already disabled rss sync, this fixxed it for a while, but now its at 200% cpu again.
Is there something i can do?
Reinstalling radarr / reseting radarr would be the last solution for me, as my movie database is a bit big and i really dont want to import everything again...
File a new issue please @RaymondSchnyder
i do that, thank you
RaymondSchnyder
on 30 Dec 2018
I closed this for now, but please keep me updated with the latest Radarr nightly. However, keep in mind that we found two memory leaks inside mono itself, so until those are fixed, you will probably still see some leakage. (However, it shouldn't be that extreme anymore).
galli-leo
on 10 Jan 2019
Hopefully this gets merged quickly into the development branch. And @galli-leo can you mention your pr ? Thanks I can try and manually apply it for now. Since my Nas with 2 GB ram is killing it self with Sonarr and Radarr eating around 2gb both 😂 (with only 9 shows in the Sonarr DB and around 15 movies in the Radarr DB. )
Edit:
Is it this one ?
https://github.com/Radarr/Radarr/pull/3214
 bruvv
on 10 Jan 2019
bruvv
on 10 Jan 2019
Tested on latest commit, still leaking like crazy. This is after about 1 minute. I stopped it before it froze me out.
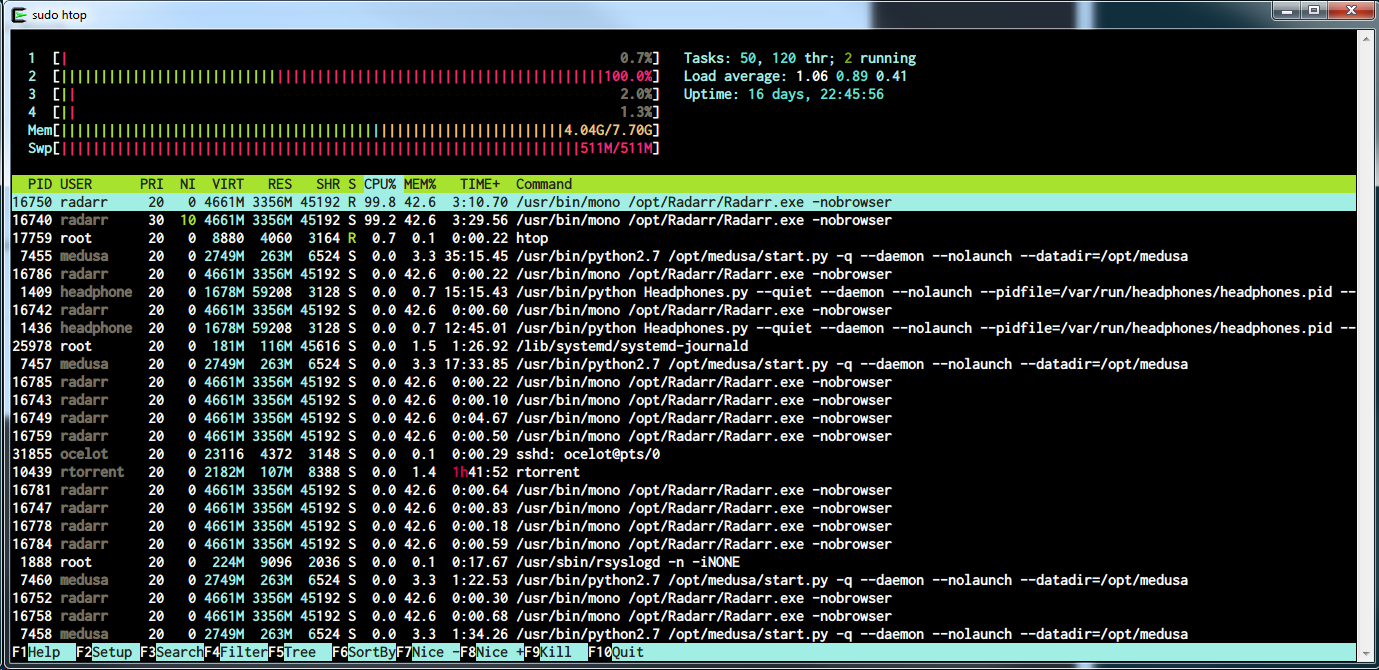
ssolidus
on 10 Jan 2019
@ssolidus Can you verify what version you are using? The latest nightly had some database issues. How many movies do you have? What version of mono are you using?
galli-leo
on 11 Jan 2019
@d1slact0r #3227 Would be the pr. It is already merged into develop, but nightly is the name of the branch you have to select in Radarr to get the latest builds from development.
galli-leo
on 11 Jan 2019
@ssolidus Can you verify what version you are using? The latest nightly had some database issues. How many movies do you have? What version of mono are you using?
@galli-leo
Radarr Version: 0.2.0.1293
Mono Version: 5.18.0.225 (tarball Wed Jan 2 21:21:16 UTC 2019)
Total records: 86
I'm just going to wipe my movie database and see if that helps. Do you mind me asking why Radarr uses Mono when it is just a webapp?
ssolidus
on 11 Jan 2019
@galli-leo
Update: after wiping my logs, all movie records, and restarting, I still get a significant memory leak just as before.
ssolidus
on 11 Jan 2019
@ssolidus Can you try running Radarr with the following command line for a few minutes (5 or so) then sending me the resulting output.mlpd file?: mono --profile=log:nocalls,alloc,heapshot=30000ms Radarr.exe Also you might wanna try an earlier mono version, something like 5.8, if you can easily get that. Furthermore, are you interfacing with Radarr in anyway when the memory usage increases?
Do you mind me asking why Radarr uses Mono when it is just a webapp?
Because it's written in C# with the .NET Framework, so the only way to run it on Linux is using mono. Also a lot of code is running on the server, it's not just serving the UI.
galli-leo
on 11 Jan 2019
@ssolidus Can you try running Radarr with the following command line for a few minutes (5 or so) then sending me the resulting output.mlpd file?: mono --profile=log:nocalls,alloc,heapshot=30000ms Radarr.exe Also you might wanna try an earlier mono version, something like 5.8, if you can easily get that. Furthermore, are you interfacing with Radarr in anyway when the memory usage increases?
@galli-leo Doing that now. Regarding earlier mono version, I could try it, but I'd like to find out if it's a Mono thing or Radarr thing.
After ~5min I will update this post with a Gist of the .mlpd.
ssolidus
on 11 Jan 2019
@ssolidus I would not recommend a gist, it will probably be far to large and don’t know whether the gist will destroy the binary data.
galli-leo
on 11 Jan 2019
@galli-leo oh sorry, I just assumed it was a log file or something.
I think you forgot the output var in the command, as it didn't produce a .mlpd file. I'm trying this instead
mono --profile=log:nocalls,alloc,heapshot=30000ms,output=/home/Radarr/output.mlpd
Edit: nevermind, that isn't producing it either... and I read that if you don't specify output location it just puts it in the current directory. Any idea why it isn't producing it?
ssolidus
on 11 Jan 2019
@ssolidus Are you launching Radarr correctly? i.e. does the console produce output with that? You need to execute that in the Radarr directory containing the Radarr.exe file and make sure your other instance isn't running as well.
galli-leo
on 11 Jan 2019
@galli-leo yes to all of those.
ssolidus
on 11 Jan 2019
@ssolidus Ah you might need to install the mono profiling tools. I don't remember exactly how you can do that. But IIRC it's something like apt install mono-profiler.
galli-leo
on 11 Jan 2019
@galli-leo Yep, I already tracked down the package group I needed. Here is the output.mlpd:
ssolidus
on 11 Jan 2019
@ssolidus What is the output of mono --version? The only thing I see that is abnormal from your file, is the large amounts of FileSystemEnumerableIterators being live. Can you try a lower mono version as well? That could help determine whether the leak is in mono.
galli-leo
on 11 Jan 2019
The only thing I see that is abnormal from your file, is the large amounts of FileSystemEnumerableIterators being live.
You mean the 3.3 GB in Strings?
@ssolidus Check the log file, TorrentBlackhole watchfolder is pointing at a directory with a metric fuckton of files and directories.
Taloth
on 11 Jan 2019
Not sure if already discussed (there's a lot of discussion going on here lol), but sonarr have applied some memory leak fixes lately: https://github.com/Sonarr/Sonarr/issues/2296#issuecomment-453223665
 dalgibbard
on 12 Jan 2019
dalgibbard
on 12 Jan 2019
please release a new build so my docker gets updated automaticly 👍
bruvv
on 13 Jan 2019
Just a long shot with this how many of you are running the LSIO Docker container as I see --debug flag and think that could be contributing.
 Fish2
on 17 Jan 2019
Fish2
on 17 Jan 2019
Where do you see that @Fish2 ?
https://github.com/linuxserver/docker-radarr/blob/master/Dockerfile
I do not see that.
bruvv
on 17 Jan 2019
onedr0p
on 17 Jan 2019
Will do a PR.
edit:
PR done: https://github.com/linuxserver/docker-radarr/pull/31 waiting for merge.
bruvv
on 17 Jan 2019
The --debug flag is intentionally added so Stack Traces on Exceptions have value, if it's legitimately causing issues then it'd make sense to remove, with the caveat that exceptions are going to be less useful or useless, but it'd be valuable to know before changing the container.
 markus101
on 17 Jan 2019
markus101
on 17 Jan 2019
The
--debugflag is intentionally added so Stack Traces on Exceptions have value, if it's legitimately causing issues then it'd make sense to remove, with the caveat that exceptions are going to be less useful or useless, but it'd be valuable to know before changing the container.
Not sure what you mean since my english is not that good. But why have a debug statement in a production docker?
bruvv
on 17 Jan 2019
It allows mono to log line numbers in stack traces, which are invaluable to determining where/why something failed, I'm not sure the reasoning why mono hides that behind the --debug flag as they're present under .net without.
markus101
on 17 Jan 2019
@d1slact0r need to be test to see if it fixes any of the issues as this might not be the problem
Fish2
on 17 Jan 2019
@d1slact0r need to be test to see if it fixes any of the issues as this might not be the problem
Feel free to test it :) I can not test it at this moment since I am working.
bruvv
on 17 Jan 2019
Ok for any one wanting to test this I have made a docker container fish2/docker-radarr only for test purposes will be removed in a week or so. The only edit is removing --debug other wise its a stander LSIO container
Fish2
on 17 Jan 2019
People should first test the new version that galli-leo provided. The only report on that version seems to be related to a configuration issue and no-one else reported back on whether the changes galli made improved the situation.
PS: For Sonarr memory usage is practically the same regardless of --debug. The only reason to disable it is for low powered devices like rpi, where every cpu cycle counts.
Taloth
on 17 Jan 2019
If this helps I might be better to have LSIO have at :latest and the a :debug so that when issues arise people can switch to the debug that way you will get the best of both
Fish2
on 19 Jan 2019
@d1slact0r galli did, over a week ago.
Taloth
on 19 Jan 2019
He said the nightly/develop release channel in https://github.com/Radarr/Radarr/issues/1580#issuecomment-453425920 according to appveyor that's build 0.2.0.1292.
PS: Read the first line in the last release on https://github.com/Radarr/Radarr/releases.
Taloth
on 19 Jan 2019
There's a docker tag for nightly.
Edit: And after update be sure to check the version number. Same goes for sonarr btw.
Taloth
on 19 Jan 2019
still some huge spikes/leaks in the latest nightly:
A leak is memory being used and never freed again, so that's no leak :smile:
You also want to log the various metrics such as RSS, VIRT etc. "RAM Usage" is a meaningless term because it both inaccurate and lacks context.
If you want to be of assistance to galli you'll have to check the (debug/trace) logs to see what was happening during those 800 MB spikes. (Which tbh isn't that huge, however they are lasting for like 4 hours.)
But I _am_ happy to see that Sonarr hovers at round 150 MB. (which also means "RAM Usage" is likely the RSS, coz Sonarr's virt usage is higher than 150 MB)
Taloth
on 6 Feb 2019
What mono version are you using? I found my memory issues went away after updating to the latest 5.18 mono and updating to latest dev build, in case that helps?
dalgibbard
on 6 Feb 2019
4h? that's not even enough time for the memory usage to stabilize since there's plenty of stuff that runs once every 6h, 12h, 24h.
(PS: Look into netdata, or telegraf+grafana.)
As for the log, find out what happens during those 800 mb spikes that doesn't on the others. Yes, it's tedious work. But there has to be a correlation somewhere.
Taloth
on 6 Feb 2019
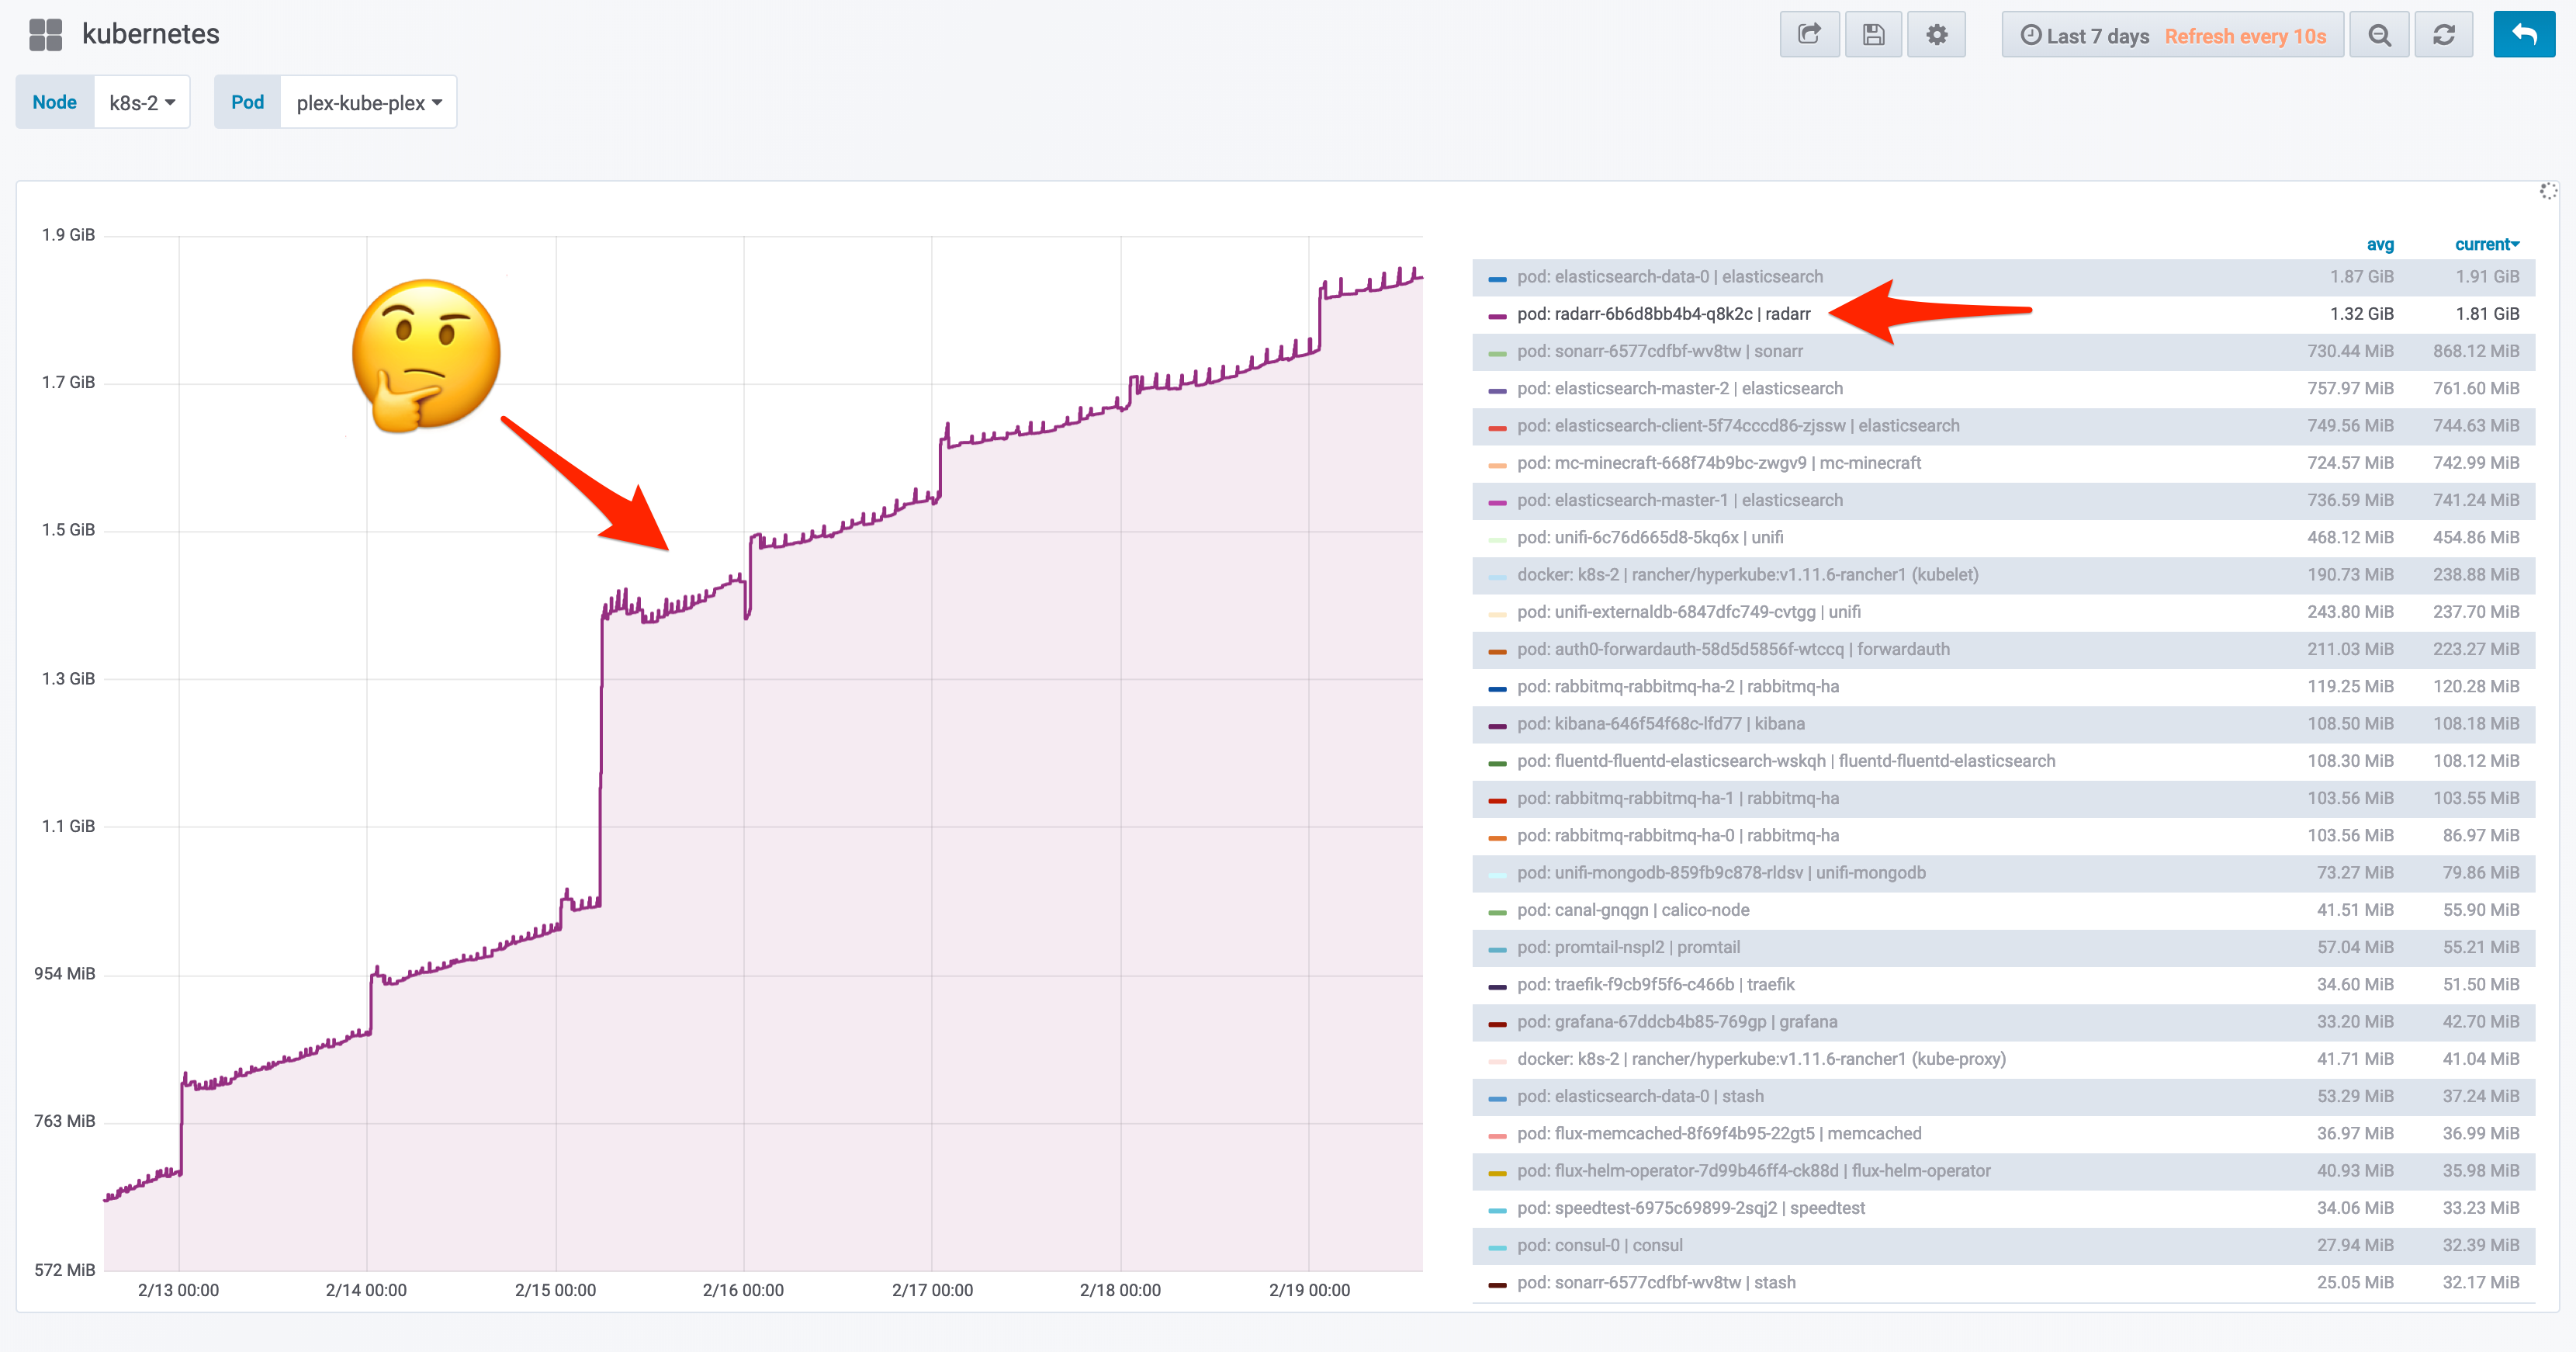
This is running the linuxserver/radarr docker image
 billimek
on 19 Feb 2019
billimek
on 19 Feb 2019
@billimek Latest version? How many movies? Can you please attach some debug logs?
galli-leo
on 19 Feb 2019
Hi @galli-leo,
- Version: 0.2.0.1217
- Mono Version: 5.18.0.225 (tarball Wed Jan 2 21:25:21 UTC 2019)
- 420 movies
- latest radarr.txt logfile
For what it's worth, during the past several days (encompassing the memory usage graph I showed), there hasn't been any activity in radarr other than normal background/scheduled tasks. In other words, I haven't done any movie adding/deleting/changing via the UI.
billimek
on 20 Feb 2019
@billimek Please use the newest version. Only that version contains all the fixes.
galli-leo
on 20 Feb 2019
@galli-leo this is the result after switching to:
- Version: 0.2.0.1293
- Mono Version: 5.18.0.240 (tarball Wed Jan 16 09:13:03 UTC 2019)
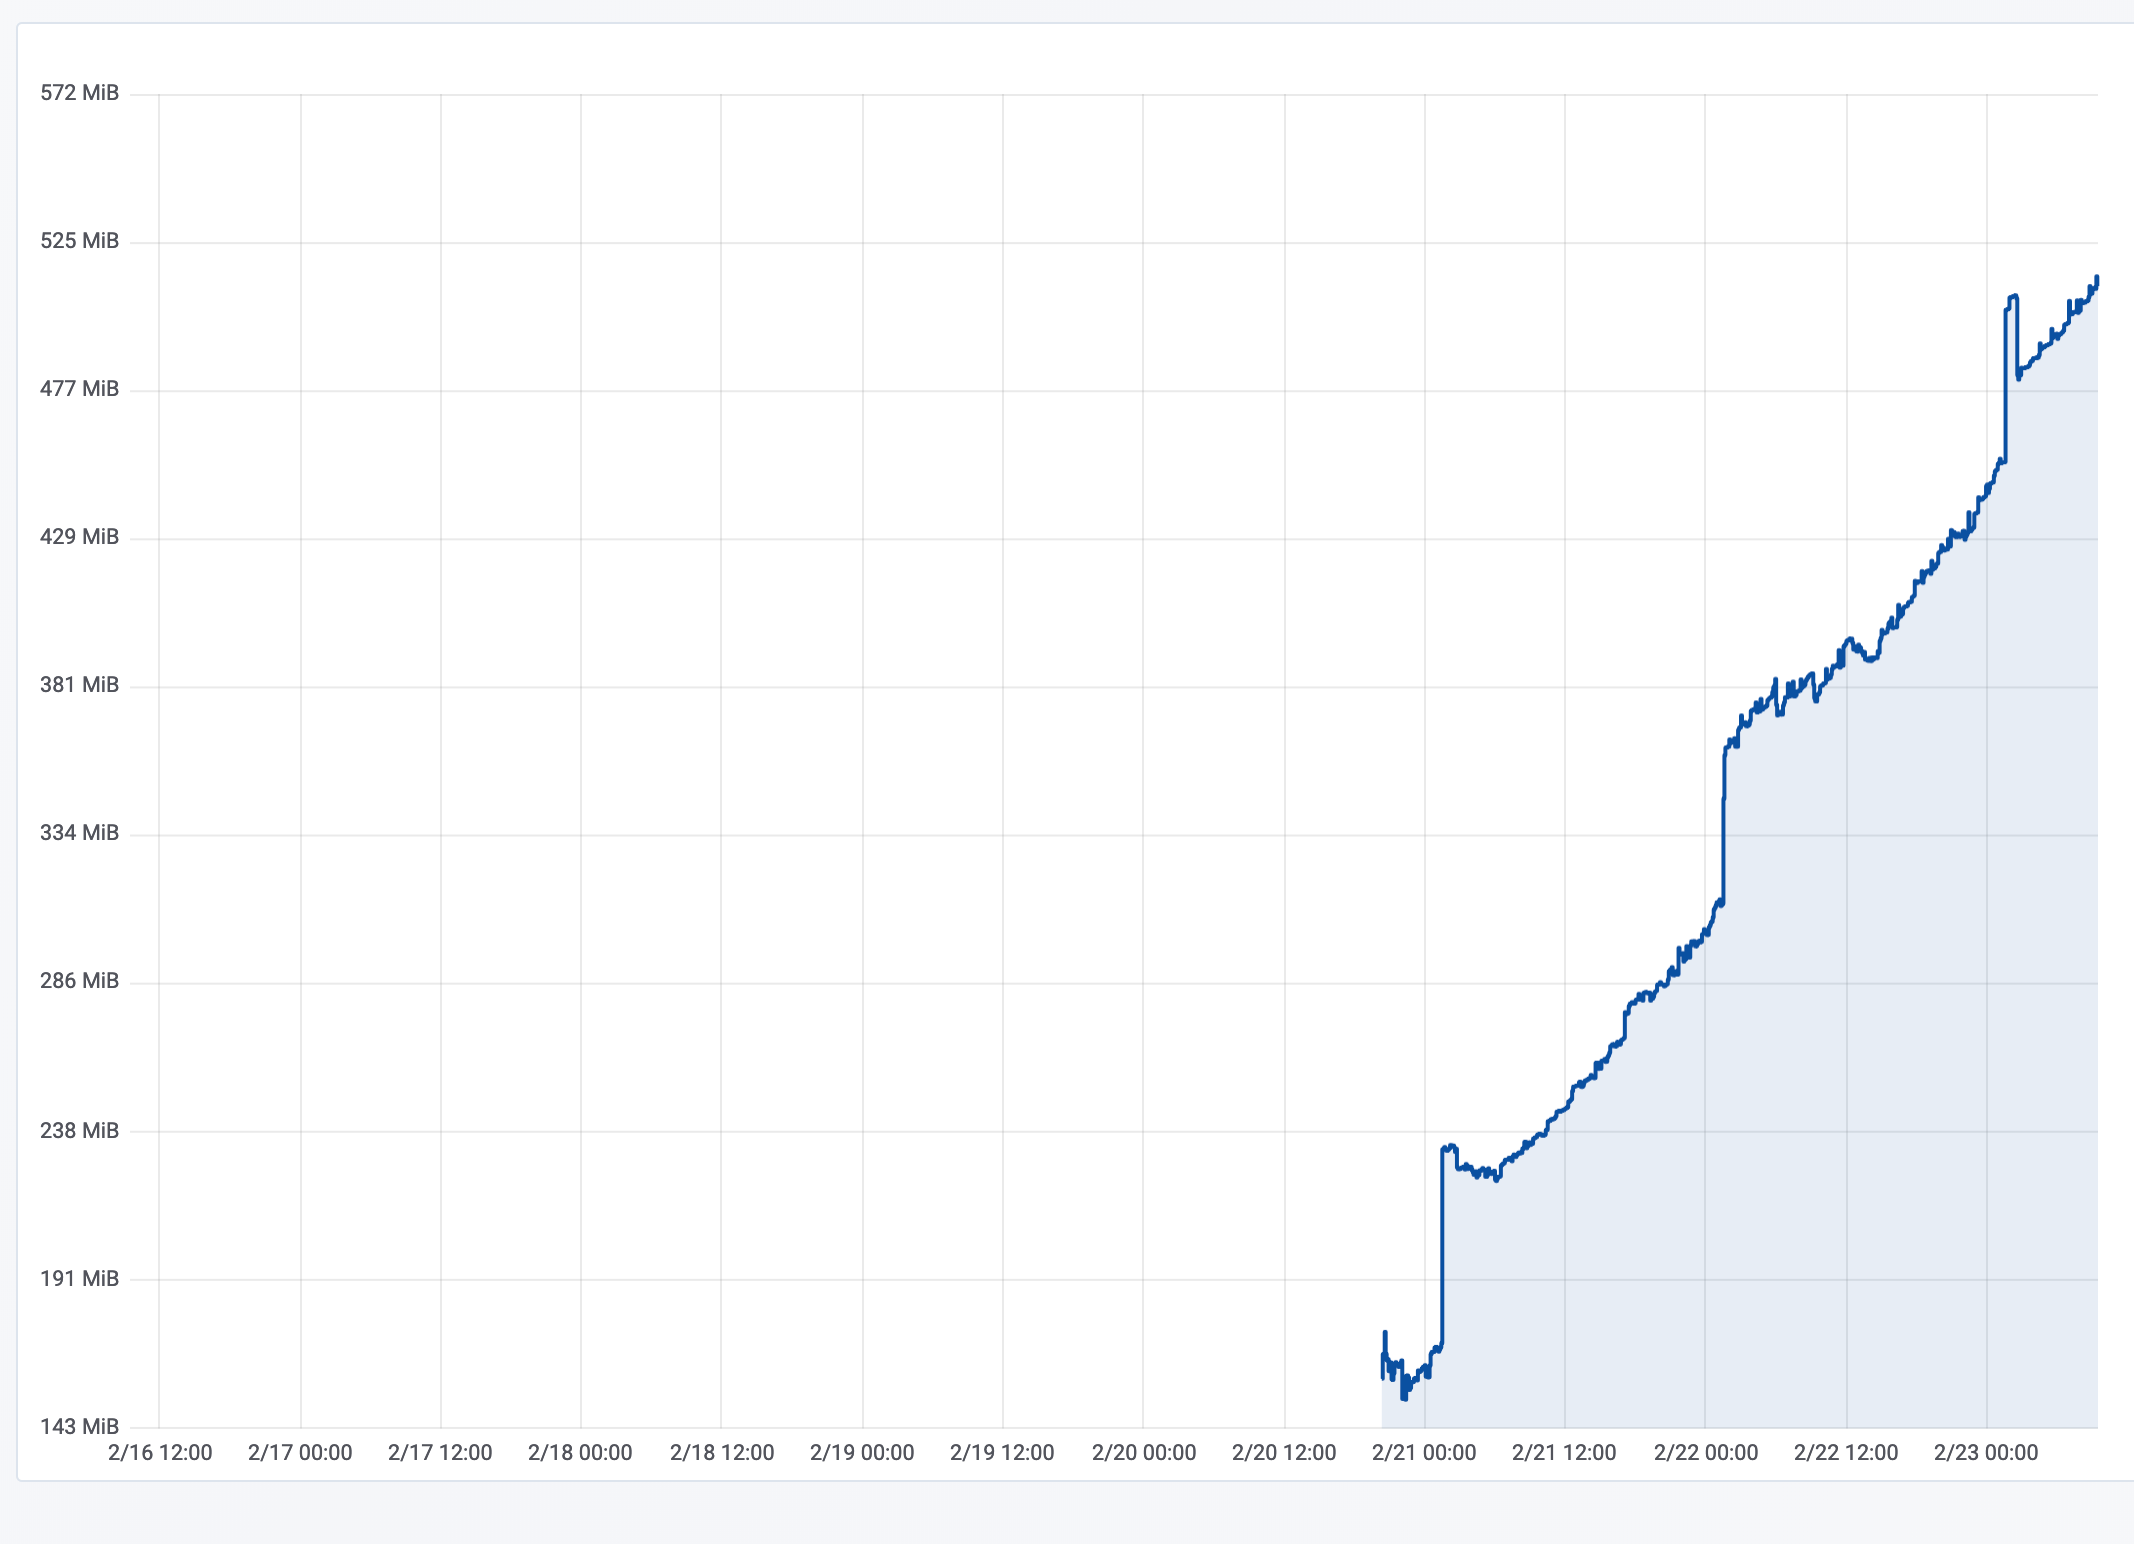
billimek
on 23 Feb 2019
galli, did you also pull in the gzip fixes? Mono fixed it upstream, and I think it's included in 5.20, but for 5.18 you'd need that commit.
Taloth
on 24 Feb 2019
@Taloth No i missed that one, thanks! Will merge in today and hopefully make a new release
galli-leo
on 24 Feb 2019
Any news on this, I'm running on a Pi and until recently (an update) it was perfect. Now it crashes due to an increase in RAM use over time.
 Rustymage
on 28 Apr 2019
Rustymage
on 28 Apr 2019
I seem to have the same problem as reported by @billimek although I don't have fancy graphs like he does :) Radarr is hogging more and more RAM over time. In a couple of days it goes from using ~10% of the RAM to ~40%. Like Jeff, it's also barely used, just regular syncs.
Comparatively Sonarr stays pretty steady even though it's a lot more active.
- Radarr version: 0.2.0.1293
- Mono version: 5.20.1.19
- System: Raspbian GNU/Linux 9 (stretch)
 sguillope
on 29 Apr 2019
sguillope
on 29 Apr 2019
Downgrading to Mono 5.12.0.309 completely fixed this problem for me.
Despite the memory leak fixes in Radarr 0.2.0.1293, running it on macOS 10.11.6 and Mono 5.18 continued to yield crazy memory usage, to the point where I had to quit+relaunch Radarr every 36-48 hours to prevent the entire system from screeching to a halt. The memory leak fixes in Sonarr, on the other hand, seemed to prevent this runaway RAM usage, even on Mono 5.18. But the only way I was able to mitigate this for Radarr was to downgrade to Mono 5.12.0.309.
 justinmayer
on 29 Apr 2019
justinmayer
on 29 Apr 2019
Any chance you can give a brief summary of how to downgrade without screwing the system please?
Shown below is the Sonarr/Jackett/Radarr htop report from my pi right now. I know Radarr is running as root.
I do wonder if Jackett is to blame too...
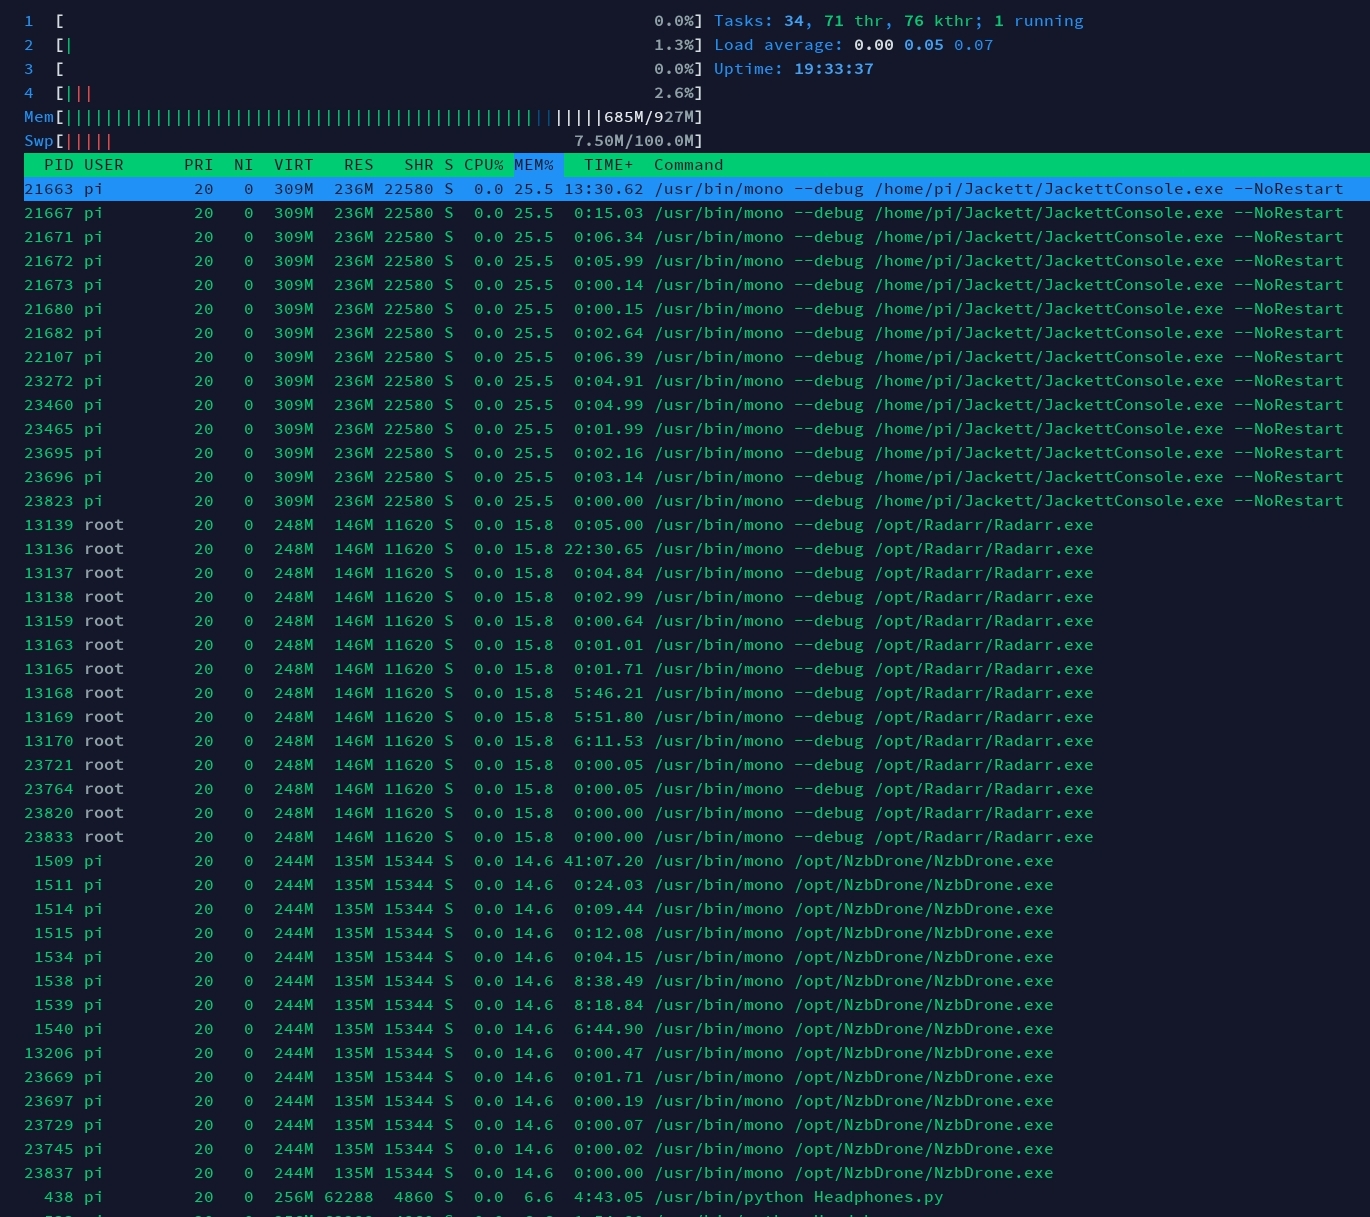
Rustymage
on 29 Apr 2019
I don't know about other platforms, but I removed Mono on macOS via the following:
(BE CAREFUL! Anything involving sudo rm -rf can hose your entire system if you make a mistake.)
sudo rm -rf /Library/Frameworks/Mono.framework
sudo pkgutil --forget com.xamarin.mono-MDK.pkg
sudo rm /etc/paths.d/mono-commands
With the previous version of Mono gone, I installed Mono 5.12.0.309 by downloading it and then double-tapping the downloaded MonoFramework-MDK-5.12.0.309.macos10.xamarin.universal.pkg installer package.
justinmayer
on 29 Apr 2019
I had this issue on my Ubuntu server and was waiting for a resolution. Then I checked my mono version and it was a super old version! I forgot to note the exact version though. Now I upgraded to the newest version, 5.20.1.19, and it has fixed the bug for me! So in my case, I did not need to use version 5.12 as recommended above for macOS. I'm putting this here as a positive note :)
tl;dr: Radarr 0.2.0.1358 (latest) with Mono 5.20.1.19 (latest) running bug-free on Ubuntu 16.04
 philon123
on 5 Jul 2019
philon123
on 5 Jul 2019
I think this is resolved now in v3
 ta264
on 15 Feb 2020
ta264
on 15 Feb 2020
Related issues
 scope999
·
3Comments
scope999
·
3Comments
 plexecutor
·
3Comments
plexecutor
·
3Comments
 mattman86
·
3Comments
mattman86
·
3Comments
 Rouzax
·
3Comments
Rouzax
·
3Comments
 Silent-Remux
·
4Comments
Silent-Remux
·
4Comments
Most helpful comment
@coenboomkamp you were literally just asked to take further OT discussions out of this ticket. The short answer is: use docker to upgrade, don't try and upgrade things inside containers, because containers are ephemeral. Now, please take it elsewhere so we can stop spamming all the subscribers on this issue.