Python-language-server: Long analysis on changes with large file in dependency graph
Every time a change to a file in the project I'm working is detected it triggers a Analysis in background with a small number of items, around ~120. This sometimes finish quickly but other times it takes a long time to finish and seems to get stuck until I reload the window completely.
The trigger seems to happen regardless if the changes are saved or not in the file, just inserting a new line without any text is enough to trigger the analysis. This is a bit annoying since makes constantly burst a cpu usage that sometimes goes away but sometimes it gets stuck. Also I've noticed that most of the times when this quick analysis is running it affects the results of the language server in other parts of the file, sometimes they return but pretty slowly, other times they don't return at all.
I've enabled trace when this happens but I can't see any exception that hangs the analysis. Is there a configuration option to prevent the analysis to happen that often? Maybe so it gets triggered when a file is saved?
 CMLL
CMLL
All 37 comments
With trace logging enabled, do you see "reloading modules" in the language server logs? If you do, then the file watching may be the cause.
If not, then if the file you're editing is a dependency of other modules, then those will need to be reanalayzed, and would show in the bottom bar. It shouldn't get stuck, in any case.
I'm not aware of any mechanism we could use in the language server protocol that would let us only operate after a save. The editor feeds us file changes so that we always have the current document (otherwise we can't provide completion/hover/etc, because we won't have the correct view on the file, nor the analysis for that file that gives us the info to serve those requests).
 jakebailey
on 4 Sep 2019
jakebailey
on 4 Sep 2019
I don't see "reloading modules" in the logs with trace. After reload and letting the analysis complete it ends in this...
...
Analysis of models.core.maintenance_period (User) on depth 0 completed in 38.9106 ms.
Analysis of models.core.api_calls_counter (User) on depth 0 completed in 3.9136 ms.
Analysis of models.core.cloud_gcp (User) on depth 0 completed in 4.8119 ms.
Analysis of models.core.maintenance (User) on depth 0 completed in 36.3584 ms.
Analysis of models.core.cloud_aws (User) on depth 0 completed in 100.3609 ms.
Analysis complete: 4327 modules in 19862.5127 ms.
Analysis version 6575 of 5417 entries has been completed in 9767.1398 ms.
Forcing full garbage collection and heap compaction.
Adding an empty line triggers this...
Analysis of tasks.cloud(User) queued
Analysis version 6576 of 128 entries has started.
Analysis of models.core.contact_event (User) on depth 0 completed in 4.7921 ms.
Analysis of models.masterdb (User) on depth 0 completed in 1317.5093 ms.
Analysis of models.monitoring_policy.exceptions (User) on depth 0 completed in 4.907 ms.
Analysis of models.monitoring_policy.actions (User) on depth 0 completed in 5.4286 ms.
...
It continues for a long time but never gets to the completed message and the garbage collection one.
The times I see the burst analysis complete it reaches this log line...
Analysis complete: 64 modules in 3946.3452 ms.
Analysis version 5739 of 128 entries has been completed in 3939.2703 ms.
From your explanation I think is being triggered by the python extension sending a request for analysis on every change rather than a more spread out approach of sending file changes when the changes are saved. I'm using the insiders build of the python extension, I'm going to switch back to the main branch and test this again, but if that is right, then this issue would be better on the python extension repository.
Thanks @jakebailey
CMLL
on 4 Sep 2019
If changes were sent only on save, completions and tooltips would not work as you type of edit files between saves...
 MikhailArkhipov
on 4 Sep 2019
MikhailArkhipov
on 4 Sep 2019
No, the extension isn't sending a request for an analysis, we're doing an analysis in response to the file being changed. The extension only hooks up the editor to the language server, it doesn't explicitly request any work.
Feasibly, we could debounce file changes and introduce some sort of delay before reanalyzing, but that'd mean that any future requests would get the wrong information.
jakebailey
on 4 Sep 2019
I see. Could there be a way to limit these bursts analysis in reach then? Perhaps making it only look in the modified file only, or only one dependency down? Right now adding an empty line to a file in a project (granted, is a pretty big project) triggers analysis of all these files, which I understand is needed for the right functioning of the LS but the constant bursting makes it pretty hard to use reliably.
Forcing full garbage collection and heap compaction.
Analysis of tasks.cloud(User) queued
Analysis version 5782 of 128 entries has started.
Analysis of models.core.contact_event (User) on depth 0 completed in 2.5525 ms.
Analysis of models.masterdb (User) on depth 0 completed in 1214.6711 ms.
Analysis of models.monitoring_policy.exceptions (User) on depth 0 completed in 1.9358 ms.
Analysis of models.monitoring_policy.actions (User) on depth 0 completed in 2.0436 ms.
Analysis of models.core.invitation (User) on depth 0 completed in 4.6629 ms.
Analysis of models.core.active_outage (User) on depth 0 completed in 6.6241 ms.
Analysis of models.core.scheduled_report (User) on depth 0 completed in 6.8823 ms.
Analysis of models.core.server_facts (User) on depth 0 completed in 8.825 ms.
Analysis of models.monitoring_policy.comparison_condition (User) on depth 0 completed in 15.6772 ms.
Analysis of models.core.cim_credential (User) on depth 0 completed in 8.8477 ms.
Analysis of models.core.ssh_credential (User) on depth 0 completed in 9.1488 ms.
Analysis of models.core.ssh_resource_script (User) on depth 0 completed in 9.1907 ms.
Analysis of models.core.pending_users (User) on depth 0 completed in 0.5278 ms.
Analysis of models.core.traceroute (User) on depth 0 completed in 13.0719 ms.
Analysis of models.core.scoreboard (User) on depth 0 completed in 3.1477 ms.
Analysis of models.core.event (User) on depth 0 completed in 15.5319 ms.
Analysis of models.core.sales_commission (User) on depth 0 completed in 3.797 ms.
Analysis of models.core.user_attribute (User) on depth 0 completed in 9.6421 ms.
Analysis of models.core.monitornode (User) on depth 0 completed in 34.9021 ms.
Analysis of models.core.cloud_azure (User) on depth 0 completed in 36.933 ms.
Analysis of models.core.connections (User) on depth 0 completed in 2.7733 ms.
Analysis of models.core.widget_queue_summary (User) on depth 0 completed in 2.8367 ms.
Analysis of models.core.blacklist (User) on depth 0 completed in 3.6457 ms.
Analysis of models.core.feature_highlight (User) on depth 0 completed in 5.4347 ms.
Analysis of models.core.kpi (User) on depth 0 completed in 6.2352 ms.
Analysis of models.core.network_service_discovery (User) on depth 0 completed in 10.9296 ms.
Analysis of models.core.metric_category (User) on depth 0 completed in 19.0213 ms.
Analysis of models.core.snmp_traps (User) on depth 0 completed in 20.6194 ms.
Analysis of models.core.global_announcement (User) on depth 0 completed in 4.4827 ms.
Analysis of models.core.sentry (User) on depth 0 completed in 11.1463 ms.
Analysis of models.core.appconfig (User) on depth 0 completed in 15.6476 ms.
Analysis of models.core.countermeasures (User) on depth 0 completed in 19.397 ms.
Analysis of models.core.email_lists (User) on depth 0 completed in 36.332 ms.
Analysis of models.core.copy_template (User) on depth 0 completed in 0.6444 ms.
Analysis of models.core.infra_map (User) on depth 0 completed in 1.5534 ms.
Analysis of models.core.snmp_port_discovery (User) on depth 0 completed in 44.8151 ms.
Analysis of models.core.onprem_connect (User) on depth 0 completed in 46.7808 ms.
Analysis of models.core.monitoring_policy (User) on depth 0 completed in 5.8532 ms.
Analysis of models.core.custom_incident_filter (User) on depth 0 completed in 47.3153 ms.
Analysis of models.core.vmware (User) on depth 0 completed in 1.7228 ms.
Analysis of models.tsdb.tsdb_base (User) on depth 0 completed in 3.3834 ms.
Analysis of models.core.filters (User) on depth 0 completed in 9.0955 ms.
Analysis of models.core.invoice (User) on depth 0 completed in 61.8226 ms.
Analysis of tasks.ops (User) on depth 0 completed in 21.2562 ms.
Analysis of models.monitoring_policy.ruleset_evaluator (User) on depth 0 completed in 6.2585 ms.
Analysis of models.core.widget_queue (User) on depth 0 completed in 6.5815 ms.
Analysis of models.core.saml_idp (User) on depth 0 completed in 10.0586 ms.
Analysis of models.monitoring_policy.policy_evaluator (User) on depth 0 completed in 6.3134 ms.
Analysis of models.core.availability (User) on depth 0 completed in 30.9626 ms.
Analysis of models.core.maintenance (User) on depth 0 completed in 50.749 ms.
Analysis of models.core.widget (User) on depth 0 completed in 53.7224 ms.
Analysis of models.core.dashboard (User) on depth 0 completed in 9.9745 ms.
Analysis of models.core.order (User) on depth 0 completed in 9.3927 ms.
Analysis of models.tsdb.tsdb_mysql (User) on depth 0 completed in 80.5731 ms.
Analysis of models.tsdb (User) on depth 0 completed in 0.3631 ms.
Analysis of tasks.celeryapp (User) on depth 0 completed in 7.5579 ms.
Analysis of tasks.monitoring_policy (User) on depth 0 completed in 0.8957 ms.
Analysis of tasks.cloud (User) on depth 0 completed in 17.0674 ms.
Analysis of models.core.server (User) on depth 0 completed in 439.6908 ms.
Analysis of models.core.maintenance_period (User) on depth 0 completed in 36.1654 ms.
Analysis of models.core.cloud (User) on depth 0 completed in 38.1387 ms.
Analysis of models.core.api_calls_counter (User) on depth 0 completed in 3.6842 ms.
Analysis of models.core.cloud_gcp (User) on depth 0 completed in 4.6792 ms.
Analysis of models.core.cloud_aws (User) on depth 0 completed in 99.4394 ms.
Analysis of models.core.contact_event (User) on depth 0 completed in 1.9494 ms.
Analysis of models.masterdb (User) on depth 0 completed in 1255.5011 ms.
Analysis of models.monitoring_policy.exceptions (User) on depth 0 completed in 4.634 ms.
Analysis of models.monitoring_policy.actions (User) on depth 0 completed in 4.9895 ms.
Analysis of models.core.active_outage (User) on depth 0 completed in 5.4479 ms.
Analysis of models.core.invitation (User) on depth 0 completed in 1.5422 ms.
Analysis of models.core.event (User) on depth 0 completed in 7.2572 ms.
Analysis of models.core.ssh_credential (User) on depth 0 completed in 3.2266 ms.
Analysis of models.core.scheduled_report (User) on depth 0 completed in 8.5979 ms.
Analysis of models.core.server_facts (User) on depth 0 completed in 7.4289 ms.
Analysis of models.monitoring_policy.comparison_condition (User) on depth 0 completed in 13.914 ms.
Analysis of models.core.traceroute (User) on depth 0 completed in 8.7157 ms.
Analysis of models.core.user_attribute (User) on depth 0 completed in 7.742 ms.
Analysis of models.core.pending_users (User) on depth 0 completed in 0.6749 ms.
Analysis of models.core.ssh_resource_script (User) on depth 0 completed in 3.9944 ms.
Analysis of models.core.cim_credential (User) on depth 0 completed in 5.6261 ms.
Analysis of models.core.scoreboard (User) on depth 0 completed in 3.5683 ms.
Analysis of models.core.sales_commission (User) on depth 0 completed in 7.6243 ms.
Analysis of models.core.metric_category (User) on depth 0 completed in 16.0362 ms.
Analysis of models.core.connections (User) on depth 0 completed in 0.8853 ms.
Analysis of models.core.widget_queue_summary (User) on depth 0 completed in 0.959 ms.
Analysis of models.core.monitornode (User) on depth 0 completed in 38.3346 ms.
Analysis of models.core.blacklist (User) on depth 0 completed in 5.5777 ms.
Analysis of models.core.kpi (User) on depth 0 completed in 6.2948 ms.
Analysis of models.core.feature_highlight (User) on depth 0 completed in 7.3039 ms.
Analysis of models.core.network_service_discovery (User) on depth 0 completed in 10.5252 ms.
Analysis of models.core.appconfig (User) on depth 0 completed in 3.9946 ms.
Analysis of models.core.custom_incident_filter (User) on depth 0 completed in 24.1092 ms.
Analysis of models.core.snmp_traps (User) on depth 0 completed in 24.7003 ms.
Analysis of models.core.snmp_port_discovery (User) on depth 0 completed in 27.1098 ms.
Analysis of models.core.onprem_connect (User) on depth 0 completed in 27.4449 ms.
Analysis of models.core.copy_template (User) on depth 0 completed in 11.2902 ms.
Analysis of models.core.infra_map (User) on depth 0 completed in 3.1438 ms.
Analysis of models.core.global_announcement (User) on depth 0 completed in 14.9955 ms.
Analysis of models.core.sentry (User) on depth 0 completed in 19.219 ms.
Analysis of models.core.vmware (User) on depth 0 completed in 4.9989 ms.
Analysis of models.core.cloud_azure (User) on depth 0 completed in 72.1949 ms.
Analysis of models.core.monitoring_policy (User) on depth 0 completed in 10.8237 ms.
Analysis of models.core.email_lists (User) on depth 0 completed in 22.58 ms.
Analysis of models.tsdb.tsdb_base (User) on depth 0 completed in 2.979 ms.
Analysis of models.core.countermeasures (User) on depth 0 completed in 26.5076 ms.
Analysis of models.core.invoice (User) on depth 0 completed in 60.1888 ms.
Analysis of models.core.filters (User) on depth 0 completed in 13.2104 ms.
Analysis of tasks.ops (User) on depth 0 completed in 19.086 ms.
Analysis of models.monitoring_policy.ruleset_evaluator (User) on depth 0 completed in 2.577 ms.
Analysis of models.core.widget_queue (User) on depth 0 completed in 4.2491 ms.
Analysis of models.monitoring_policy.policy_evaluator (User) on depth 0 completed in 11.53 ms.
Analysis of models.core.saml_idp (User) on depth 0 completed in 14.6498 ms.
Analysis of models.core.availability (User) on depth 0 completed in 24.4939 ms.
Analysis of models.core.maintenance (User) on depth 0 completed in 46.3375 ms.
Analysis of models.tsdb.tsdb_mysql (User) on depth 0 completed in 51.4913 ms.
Analysis of models.tsdb (User) on depth 0 completed in 0.4065 ms.
Analysis of tasks.celeryapp (User) on depth 0 completed in 6.4951 ms.
Analysis of tasks.monitoring_policy (User) on depth 0 completed in 0.9924 ms.
Analysis of tasks.cloud (User) on depth 0 completed in 6.5113 ms.
Analysis of models.core.widget (User) on depth 0 completed in 71.8702 ms.
Analysis of models.core.dashboard (User) on depth 0 completed in 8.8477 ms.
Analysis of models.core.order (User) on depth 0 completed in 10.4304 ms.
Analysis of models.core.server (User) on depth 0 completed in 464.5628 ms.
Analysis of models.core.cloud (User) on depth 0 completed in 41.9325 ms.
Analysis of models.core.api_calls_counter (User) on depth 0 completed in 2.6271 ms.
Analysis of models.core.cloud_gcp (User) on depth 0 completed in 9.6257 ms.
Analysis of models.core.maintenance_period (User) on depth 0 completed in 56.6216 ms.
Analysis of models.core.cloud_aws (User) on depth 0 completed in 106.7908 ms.
Analysis complete: 64 modules in 3934.1659 ms.
Analysis version 5782 of 128 entries has been completed in 3928.1441 ms.
How big is models.masterdb?
 AlexanderSher
on 4 Sep 2019
AlexanderSher
on 4 Sep 2019
Pretty big, 21,000 lines. And also imports from another >20 files in core.
Edit:
I just got this notification when working while one of the burst analysis got stuck. I've seen they happen before but they are rare, I usually reload the window before they happen and the analysis gets restarted. Usually the ram usage of the LS stays pretty stable.
CMLL
on 4 Sep 2019
Analysis only looks at modified files. Files analyzed previously are not re-processed - unless
- some of the _open_ files depend on the changed one (closed files are not relevant).
- there are circular dependencies in which case yes, they can be re-analyzed.
MikhailArkhipov
on 4 Sep 2019
Thanks @MikhailArkhipov I think I may be hitting the second case of the 2 you mention. I went to a test file that depends masterdb and adding a empty line triggers an analysis of only that file.
Analysis of tests.unit.notifyengine3.test_notifications(User) queued
Analysis version 5680 of 1 entries has started.
Analysis of tests.unit.notifyengine3.test_notifications (User) on depth 0 completed in 1.9614 ms.
Analysis version 5680 of 1 entries has been completed in 2.1542 ms.
Analysis of tests.unit.notifyengine3.test_notifications(User) queued
Analysis version 5681 of 1 entries has started.
Analysis of tests.unit.notifyengine3.test_notifications (User) on depth 0 completed in 2.3661 ms.
Analysis version 5681 of 1 entries has been completed in 2.5529 ms.
But when I add a line in another file that also imports masterdb I get the big analysis I mentioned previously. Is that circular dependency analysis an expected outcome or is a bug/side effect? I did both tests with the masterdb file opened and closed.
CMLL
on 4 Sep 2019
masterdb can be opened or closed, does not matter. If you have file A opened and it imports B, B will be loaded regardless. Now, if A imports B and C imports B, and nothing in the open files tree of dependencies depends on C, C won't be analyzed unless it is opened.
Log above looks like circular dependencies. tests.unit.notifyengine3.test_notifications (User) is processed twice and that typically means something similar to "A imports B and B imports A" in which case single pass cannot figure out types so it has to go around twice. If three modules are involved in loops, there may be three passes. And so on.
Static analysis, as opposed to an interpreter, does not have luxury of ignoring circular dependencies until they are actually executed...
MikhailArkhipov
on 4 Sep 2019
The 3 lines of test_notifications (User) was actually each a single new empty line I added to the file, each change triggered a new analysis, but it didn't went over the to the masterdb as other files, which yes, leads me to believe that there is a circular one existing between those files and masterdb, since both them and test_notifications use masterdb but only some of them triggers an analysis of masterdb.
CMLL
on 4 Sep 2019
I see issue after issue getting closed and really defensive replied by the maintainer. On top of that this annoying survey pops up all the time. Sometimes I want to install this extension again just do the survey so that I can down rate it.
You are also asking about reproducible steps. Well, this one was on a fresh windows 10 install.
Its a corporate project so I cannot share the code. However, below you will find the pipefile. Yes I am using pipenv.
step 1. Fresh windows 10
step 2. pull project and run pipenv install
step 3. open vscode/any file.py and see it getting stuck analyzing 1800 items within 5 minutes.
` Pipfile
[[source]]
name = "pypi"
url = "https://pypi.org/simple"
verify_ssl = true
[dev-packages]
autopep8 = ""
pylint = ""
[packages]
asyncio = "==3.4.3"
pyodbc = "==4.0.27"
aioodbc = "==0.0.1"
aiohttp = "==3.5.4"
aiohttp-cors = ""
python-enginio = {git = "https://github.com/miguelgrinberg/python-engineio/",ref = "master"}
python-socketio = "==4.3"
aiolog = "==0.0.2"
aiocache = "==0.11.1"
msgpack = "==0.6.1"
pandas = "==0.25.0"
sqlalchemy = "==1.3.6"
pytest = ""
pytest-asyncio = "*"
requests = "==2.22.0"
[requires]
python_version = "3.7"
`
 bluebrown
on 9 Sep 2019
bluebrown
on 9 Sep 2019
I don't agree with your comment about they closing down issues and being defensive about issues, at least that's not my experience with the handful of issues I've opened. Static analysis is a pretty complicated problem to tackle and getting it work right requires a non trivial amount of work. And also this is a very much in development project, not close to public release so rough edges are expected.
That said, is your issue similar to the one I'm having? From your step 3, doesn't seem to be the case.
CMLL
on 9 Sep 2019
Ok, I am not quite sure if it's the same issue. At first glance it seemed related and I encountered already a few closed issues on "my issue". Sorry If this is wrong here, I get that its for free and actual its works pretty well, but this memory leak, related to background analysis, makes it unusable. In fact, it makes vscode for python a bit useless as there is no good alternative as it seems. I would go and fix it, but I am too weak.
bluebrown
on 9 Sep 2019
Issues may or may not be related, but it is always better to open separate one. Otherwise fix for one issue may close the thread with several different issues. Different cases may be assigned to different people in different milestones depending on the schedule. If cases happen to be deemed the same, we'll duplicate one against the other.
MikhailArkhipov
on 9 Sep 2019
@bluebrown - which issues were closed that you have opened?
MikhailArkhipov
on 9 Sep 2019
@bluebrown if the issue is rendering vscode unusable you could setting python.jediEnabled: True in the settings, that will make vscode use the Jedi engine instead of this one, is slower and doesn't have as many features but perhaps it will help you get along until your issue is resolved.
Also you could set "python.analysis.logLevel": "Trace", in the settings to get a more detailed view of how the LS is working.
@MikhailArkhipov @jakebailey I'm still encountering the issue when the analysis get stuck on an file change analysis until a reload. The trace log shows that the server analysis is queue but doesn't complete.
Analysis of models.core.server(User) queued
Is there a deeper log level that I could enable to shed more light into the issue or a log file directly in the downloaded files for the LS.
I have the repository downloaded. I can compile it and pass it directly to my vscode installation by setting "python.downloadLanguageServer": false, if that would help me access some other log or diagnostic files.
CMLL
on 9 Sep 2019
I have not opened one myself. I usually try to find one because I think otherwise there were tons of duplicates.
However, you will find plenty of material regarding vscode python analyzing in background
Should I open an issue? I am not a pro, so I am glad about any advice.
bluebrown
on 9 Sep 2019
@bluebrown A new issue with your test case would be preferred, yes. Issues seem to always end up in buckets like:
- High memory usage
- High CPU usage
- "Analysis running" message not going away
- "Unresolved imports"
- etc...
But are often unrelated. The limited number of "symptoms" that we can exhibit compared to the number of differing underlying isuses makes it better to start with multiple issues that we can close as duplicates of each other as we find the root cause.
@CMLL Just to verify, which LS version are you on? I think stable is still 0.3.66, but I know we've had some reload fixes in the meantime. Additionally, in 0.3.72+, you can set python.analysis.watchSearchPaths to false to completely disable the file watching behavior and see if that helps.
jakebailey
on 9 Sep 2019
@jakebailey I'm the beta channel, 0.3.76, put python.analysis.watchSearchPaths to false but I still see hangups after some file changes.
Out of curiosity, should that affect the trace output, 'cause I don't see any difference in there with that setting at false, the user search paths are the same, the same big analysis happen at the start and the small burst analysis that happen on file change seem to analyze the same files.
CMLL
on 9 Sep 2019
watchSearchpaths is specifically only file watching, i.e. if you were to see "Reloading modules..." printed in the output.
jakebailey
on 9 Sep 2019
Gotcha, so far no, I haven't seen that message in the logs at all. I'm going to keep it on for some more time.
CMLL
on 9 Sep 2019
There is something else I noticed while doing some tests on this issue. Seems to easier to reproduce if I type a long sentence quickly that triggers several analysis requests quickly one after the other. I was typing a function as a test, would do def t, wait a few seconds watching the logs, waited until the analysis completed, then do est_, same again, and continued liked that for a few more attemps, then afterwards completed the function by typing a lot of gibberish real quickly and surely enough, the analysis locked himself up.
This is all happening on a file that triggers a somewhat hefty analysis of ~130 items on each file change.
CMLL
on 10 Sep 2019
I was curious about the frequency of the analysis triggered so I set to debug the LS and noticed that on the function DidChangeTextDocument that replaces the document internally, and I assume triggers a new analysis, the change gets passed char by char, i.e. I was writing this function def test_nothing and the change.text value was n, o, t and so on. Each one of this triggered a document change.
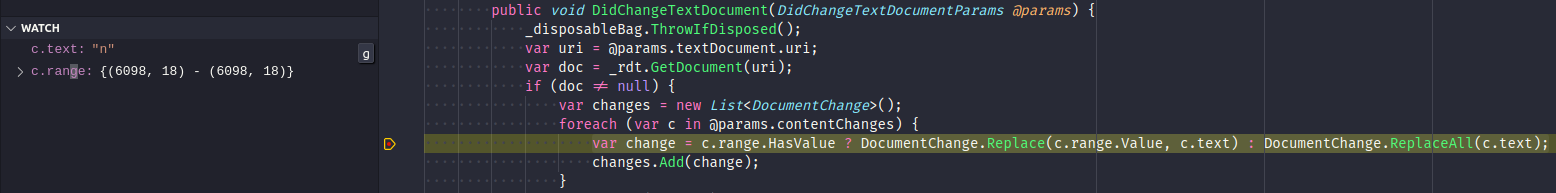
Is this needed to perform the latest analysis? Could a small delay between these updates improve the performance of the burst analysis? As in having the document update def update_something(name) instead of d, e, f, , u, etc.
Also when debugging I saw several throw CancelledExceptions being raised that didn't got over to the output of the LS in the code window, I think they are being caught somewhere, but could some of them be causing my burst analysis to stall?
CMLL
on 10 Sep 2019
Throttling changes leads to various problems such as when user types . they won't get proper completions since processing was delayed. It is unclear when exactly start the process since typing d may be beginning of a construct or fixing ef foo(): or import atetime. In the latter case user wants to see proper tooltip right away after atetime turns into datetime.
Re-analyzing single file does not typically produce much load, parsing is literally few ms + analysis maybe 50. Cancelled exceptions are normal, the file has changed and hence previous processing gets canceled. Cancellations are handled. Question is why changing this particular file causes more that one file being analyzed. Log in the output window (what being analyzed after change) may help.
MikhailArkhipov
on 10 Sep 2019
So far I've been able to reliably reproduce this in some files by rapid typing code that triggers analysis. A def testing_something typed quickly (regular speed for a developer, not flash fast) will get it stuck with the analysing in background message. I see this on the output at that point, this is on file A server.py
Completions in file:///home/cllamach/Panopta/classic/src/models/core/server.py at (6127, 23)
Analysis of models.core.server(User) queued
Analysis version 632 of 130 entries has started.
Analysis of models.core.active_outage (User) on depth 0 completed in 3.4118 ms.
Analysis of models.core.widget_queue (User) on depth 0 completed in 2.6114 ms.
Analysis of models.core.widget (User) on depth 0 completed in 57.9672 ms.
Analysis of models.core.dashboard (User) on depth 0 completed in 7.2734 ms.
Analysis of models.core.order (User) on depth 0 completed in 5.4699 ms.
Analysis of models.core.server(User) queued
Analysis of models.core.server(User) queued
Analysis of models.core.server(User) queued
Out of order analysis of models.core.server(User) completed in 523.4476 ms.
Analysis of models.core.server(User) queued
By comparison, slowly typing def wil show this in the output.
Completions in file:///home/cllamach/Panopta/classic/src/models/core/server.py at (6127, 9)
Analysis of models.core.server(User) queued
Analysis version 661 of 130 entries has started.
Analysis of models.core.user_attribute (User) on depth 0 completed in 1.6749 ms.
Analysis of models.core.server(User) queued
Out of order analysis of models.core.server(User) completed in 513.7385 ms.
Analysis of models.masterdb (User) on depth 0 completed in 1392.4663 ms.
Analysis version 661 has been completed in 1394.9557 ms with 2 entries analyzed and 128 entries skipped.
Analysis version 662 of 130 entries has started.
Analysis of models.core.user_attribute (User) on depth 0 completed in 3.4103 ms.
Analysis of models.masterdb (User) on depth 0 completed in 1662.623 ms.
Analysis of models.core.server_facts (User) on depth 0 completed in 2.8466 ms.
Analysis of models.core.network_service_discovery (User) on depth 0 completed in 10.3493 ms.
Analysis of models.core.snmp_traps (User) on depth 0 completed in 16.5297 ms.
Analysis of models.core.custom_incident_filter (User) on depth 0 completed in 21.2365 ms.
Analysis of models.core.countermeasures (User) on depth 0 completed in 11.8062 ms.
Analysis of models.core.metric_category (User) on depth 0 completed in 23.7498 ms.
Analysis of models.core.snmp_port_discovery (User) on depth 0 completed in 21.0434 ms.
Analysis of models.core.monitornode (User) on depth 0 completed in 25.5255 ms.
Analysis of models.core.invitation (User) on depth 0 completed in 1.1521 ms.
Analysis of models.monitoring_policy.actions (User) on depth 0 completed in 2.0355 ms.
Analysis of models.monitoring_policy.exceptions (User) on depth 0 completed in 2.1324 ms.
Analysis of models.core.scheduled_report (User) on depth 0 completed in 2.3699 ms.
Analysis of models.core.traceroute (User) on depth 0 completed in 4.6521 ms.
Analysis of models.core.active_outage (User) on depth 0 completed in 2.8052 ms.
Analysis of models.core.event (User) on depth 0 completed in 12.1628 ms.
Analysis of models.core.pending_users (User) on depth 0 completed in 0.4624 ms.
Analysis of models.core.ssh_resource_script (User) on depth 0 completed in 2.0347 ms.
Analysis of models.core.cim_credential (User) on depth 0 completed in 2.5375 ms.
Analysis of models.core.sales_commission (User) on depth 0 completed in 9.5562 ms.
Analysis of models.core.ssh_credential (User) on depth 0 completed in 9.6746 ms.
Analysis of models.core.connections (User) on depth 0 completed in 0.3796 ms.
Analysis of models.core.scoreboard (User) on depth 0 completed in 1.0149 ms.
Analysis of models.core.blacklist (User) on depth 0 completed in 0.6771 ms.
Analysis of models.monitoring_policy.comparison_condition (User) on depth 0 completed in 15.703 ms.
Analysis of models.core.widget_queue_summary (User) on depth 0 completed in 0.613 ms.
Analysis of models.core.feature_highlight (User) on depth 0 completed in 1.7202 ms.
Analysis of models.core.contact_event (User) on depth 0 completed in 2.3357 ms.
Analysis of models.core.kpi (User) on depth 0 completed in 1.891 ms.
Analysis of models.core.appconfig (User) on depth 0 completed in 1.0951 ms.
Analysis of models.core.global_announcement (User) on depth 0 completed in 1.4342 ms.
Analysis of models.core.sentry (User) on depth 0 completed in 9.0405 ms.
Analysis of models.core.copy_template (User) on depth 0 completed in 0.5849 ms.
Analysis of models.core.monitoring_policy (User) on depth 0 completed in 10.4882 ms.
Analysis of models.core.email_lists (User) on depth 0 completed in 10.8903 ms.
Analysis of models.core.infra_map (User) on depth 0 completed in 0.8284 ms.
Analysis of models.core.vmware (User) on depth 0 completed in 1.2217 ms.
Analysis of models.tsdb.tsdb_base (User) on depth 0 completed in 4.1187 ms.
Analysis of models.core.filters (User) on depth 0 completed in 11.508 ms.
Analysis of models.core.onprem_connect (User) on depth 0 completed in 24.9945 ms.
Analysis of models.core.widget_queue (User) on depth 0 completed in 3.6441 ms.
Analysis of models.monitoring_policy.ruleset_evaluator (User) on depth 0 completed in 2.8189 ms.
Analysis of models.core.saml_idp (User) on depth 0 completed in 13.6328 ms.
Analysis of models.core.invoice (User) on depth 0 completed in 43.0182 ms.
Analysis of models.core.availability (User) on depth 0 completed in 20.3526 ms.
Analysis of models.monitoring_policy.policy_evaluator (User) on depth 0 completed in 10.3372 ms.
Analysis of models.core.cloud_azure (User) on depth 0 completed in 61.3571 ms.
Analysis of models.tsdb.tsdb_mysql (User) on depth 0 completed in 56.6424 ms.
Analysis of models.tsdb (User) on depth 0 completed in 0.254 ms.
Analysis of tasks.celeryapp (User) on depth 0 completed in 11.5717 ms.
Analysis of models.core.widget (User) on depth 0 completed in 52.0451 ms.
Analysis of tasks.monitoring_policy (User) on depth 0 completed in 0.8191 ms.
Analysis of tasks.cloud (User) on depth 0 completed in 13.3317 ms.
Analysis of models.core.dashboard (User) on depth 0 completed in 13.8086 ms.
Analysis of tasks.ops (User) on depth 0 completed in 16.5693 ms.
Analysis of models.core.order (User) on depth 0 completed in 5.3894 ms.
Analysis of models.core.server (User) on depth 0 completed in 462.9566 ms.
Analysis of models.core.notifications (User) on depth 0 completed in 15.1525 ms.
Analysis of models.core.cloud (User) on depth 0 completed in 50.5788 ms.
Analysis of models.core.api_calls_counter (User) on depth 0 completed in 2.2566 ms.
Analysis of models.core.cloud_gcp (User) on depth 0 completed in 3.3446 ms.
Analysis of models.core.maintenance_period (User) on depth 0 completed in 55.9364 ms.
Analysis of models.core.maintenance (User) on depth 0 completed in 30.3649 ms.
Analysis of models.core.cloud_aws (User) on depth 0 completed in 59.5895 ms.
Analysis of models.core.user_attribute (User) on depth 0 completed in 1.8753 ms.
Analysis of models.masterdb (User) on depth 0 completed in 1289.5614 ms.
Analysis of models.core.server_facts (User) on depth 0 completed in 9.0673 ms.
Analysis of models.core.network_service_discovery (User) on depth 0 completed in 12.4776 ms.
Analysis of models.core.countermeasures (User) on depth 0 completed in 16.6747 ms.
Analysis of models.core.custom_incident_filter (User) on depth 0 completed in 21.1678 ms.
Analysis of models.core.snmp_traps (User) on depth 0 completed in 21.6233 ms.
Analysis of models.core.snmp_port_discovery (User) on depth 0 completed in 24.0339 ms.
Analysis of models.core.metric_category (User) on depth 0 completed in 26.4477 ms.
Analysis of models.core.monitornode (User) on depth 0 completed in 27.8041 ms.
Analysis of models.core.invitation (User) on depth 0 completed in 4.6336 ms.
Analysis of models.monitoring_policy.exceptions (User) on depth 0 completed in 5.4519 ms.
Analysis of models.core.scheduled_report (User) on depth 0 completed in 6.2029 ms.
Analysis of models.core.active_outage (User) on depth 0 completed in 6.5709 ms.
Analysis of models.monitoring_policy.actions (User) on depth 0 completed in 7.1983 ms.
Analysis of models.core.event (User) on depth 0 completed in 8.5157 ms.
Analysis of models.core.traceroute (User) on depth 0 completed in 9.2304 ms.
Analysis of models.core.pending_users (User) on depth 0 completed in 0.6285 ms.
Analysis of models.core.scoreboard (User) on depth 0 completed in 2.0782 ms.
Analysis of models.core.ssh_resource_script (User) on depth 0 completed in 2.7378 ms.
Analysis of models.core.sales_commission (User) on depth 0 completed in 2.5268 ms.
Analysis of models.core.cim_credential (User) on depth 0 completed in 4.3723 ms.
Analysis of models.monitoring_policy.comparison_condition (User) on depth 0 completed in 12.8101 ms.
Analysis of models.core.ssh_credential (User) on depth 0 completed in 6.0786 ms.
Analysis of models.core.cloud_azure (User) on depth 0 completed in 30.6333 ms.
Analysis of models.core.connections (User) on depth 0 completed in 0.5664 ms.
Analysis of models.core.blacklist (User) on depth 0 completed in 0.8018 ms.
Analysis of models.core.widget_queue_summary (User) on depth 0 completed in 0.5647 ms.
Analysis of models.core.contact_event (User) on depth 0 completed in 8.046 ms.
Analysis of models.core.appconfig (User) on depth 0 completed in 7.4335 ms.
Analysis of models.core.kpi (User) on depth 0 completed in 8.7539 ms.
Analysis of models.core.sentry (User) on depth 0 completed in 8.1456 ms.
Analysis of models.core.copy_template (User) on depth 0 completed in 0.4212 ms.
Analysis of models.core.feature_highlight (User) on depth 0 completed in 9.5674 ms.
Analysis of models.core.vmware (User) on depth 0 completed in 0.8916 ms.
Analysis of models.core.infra_map (User) on depth 0 completed in 0.9116 ms.
Analysis of models.core.global_announcement (User) on depth 0 completed in 3.1071 ms.
Analysis of models.core.email_lists (User) on depth 0 completed in 5.3201 ms.
Analysis of models.tsdb.tsdb_base (User) on depth 0 completed in 4.0582 ms.
Analysis of models.core.monitoring_policy (User) on depth 0 completed in 6.0085 ms.
Analysis of models.core.saml_idp (User) on depth 0 completed in 11.046 ms.
Analysis of models.core.filters (User) on depth 0 completed in 12.1861 ms.
Analysis of models.core.onprem_connect (User) on depth 0 completed in 23.1472 ms.
Analysis of models.core.widget_queue (User) on depth 0 completed in 2.2427 ms.
Analysis of models.monitoring_policy.ruleset_evaluator (User) on depth 0 completed in 3.2435 ms.
Analysis of models.monitoring_policy.policy_evaluator (User) on depth 0 completed in 8.0954 ms.
Analysis of models.core.invoice (User) on depth 0 completed in 56.1013 ms.
Analysis of models.core.availability (User) on depth 0 completed in 36.6948 ms.
Analysis of models.core.widget (User) on depth 0 completed in 53.8162 ms.
Analysis of models.core.dashboard (User) on depth 0 completed in 14.5458 ms.
Analysis of models.core.order (User) on depth 0 completed in 6.2892 ms.
Analysis of models.tsdb.tsdb_mysql (User) on depth 0 completed in 81.2913 ms.
Analysis of models.tsdb (User) on depth 0 completed in 0.2979 ms.
Analysis of tasks.celeryapp (User) on depth 0 completed in 4.8724 ms.
Analysis of tasks.monitoring_policy (User) on depth 0 completed in 3.5472 ms.
Analysis of tasks.cloud (User) on depth 0 completed in 9.9932 ms.
Analysis of tasks.ops (User) on depth 0 completed in 15.0816 ms.
Analysis of models.core.server (User) on depth 0 completed in 478.7152 ms.
Analysis of models.core.notifications (User) on depth 0 completed in 22.7786 ms.
Analysis of models.core.cloud (User) on depth 0 completed in 60.0895 ms.
Analysis of models.core.api_calls_counter (User) on depth 0 completed in 5.7547 ms.
Analysis of models.core.maintenance_period (User) on depth 0 completed in 66.6573 ms.
Analysis of models.core.cloud_gcp (User) on depth 0 completed in 8.0824 ms.
Analysis of models.core.maintenance (User) on depth 0 completed in 38.4958 ms.
Analysis of models.core.cloud_aws (User) on depth 0 completed in 74.8598 ms.
Analysis complete: 65 modules in 5766.6624 ms.
Analysis version 662 of 130 entries has been completed in 4370.6163 ms.
In contrast, several other files, behave like this when typing fast. I can see each change triggering changes and returning faster without touching related modules.
Completions in file:///home/cllamach/Panopta/classic/src/tests/unit/notifyengine3/test_notifications.py at (46, 30)
Analysis of tests.unit.notifyengine3.test_notifications(User) queued
Analysis version 698 of 1 entries has started.
Completions in file:///home/cllamach/Panopta/classic/src/tests/unit/notifyengine3/test_notifications.py at (46, 31)
Analysis of tests.unit.notifyengine3.test_notifications (User) on depth 0 completed in 1.4477 ms.
Analysis complete: 1 modules in 2.0478 ms.
Analysis version 698 of 1 entries has been completed in 1.5763 ms.
Analysis of tests.unit.notifyengine3.test_notifications(User) queued
Analysis version 699 of 1 entries has started.
Completions in file:///home/cllamach/Panopta/classic/src/tests/unit/notifyengine3/test_notifications.py at (46, 32)
Analysis of tests.unit.notifyengine3.test_notifications (User) on depth 0 completed in 2.7175 ms.
Analysis complete: 1 modules in 3.6665 ms.
Analysis version 699 of 1 entries has been completed in 2.919 ms.
Analysis of tests.unit.notifyengine3.test_notifications(User) queued
Analysis version 700 of 1 entries has started.
Analysis of tests.unit.notifyengine3.test_notifications (User) on depth 0 completed in 1.9784 ms.
Analysis complete: 1 modules in 2.7945 ms.
Completions in file:///home/cllamach/Panopta/classic/src/tests/unit/notifyengine3/test_notifications.py at (46, 33)
Analysis version 700 of 1 entries has been completed in 2.2203 ms.
Analysis of tests.unit.notifyengine3.test_notifications(User) queued
Analysis version 701 of 1 entries has started.
Completions in file:///home/cllamach/Panopta/classic/src/tests/unit/notifyengine3/test_notifications.py at (46, 34)
Analysis of tests.unit.notifyengine3.test_notifications (User) on depth 0 completed in 1.5748 ms.
Analysis complete: 1 modules in 2.4038 ms.
Analysis version 701 of 1 entries has been completed in 1.7212 ms.
Analysis of tests.unit.notifyengine3.test_notifications(User) queued
Completions in file:///home/cllamach/Panopta/classic/src/tests/unit/notifyengine3/test_notifications.py at (46, 35)
Analysis version 702 of 1 entries has started.
Analysis of tests.unit.notifyengine3.test_notifications (User) on depth 0 completed in 1.352 ms.
Analysis complete: 1 modules in 2.1321 ms.
Analysis version 702 of 1 entries has been completed in 1.4805 ms.
Analysis of tests.unit.notifyengine3.test_notifications(User) queued
Analysis version 703 of 1 entries has started.
Analysis of tests.unit.notifyengine3.test_notifications (User) on depth 0 completed in 1.4677 ms.
Analysis complete: 1 modules in 3.0332 ms.
Completions in file:///home/cllamach/Panopta/classic/src/tests/unit/notifyengine3/test_notifications.py at (46, 36)
Analysis version 703 of 1 entries has been completed in 2.5114 ms.
Analysis of tests.unit.notifyengine3.test_notifications(User) queued
Analysis version 704 of 1 entries has started.
Analysis of tests.unit.notifyengine3.test_notifications (User) on depth 0 completed in 1.397 ms.
Analysis complete: 1 modules in 2.1583 ms.
Analysis version 704 of 1 entries has been completed in 1.5702 ms.
Signatures in file:///home/cllamach/Panopta/classic/src/tests/unit/notifyengine3/test_notifications.py at (46, 37)
Analysis of tests.unit.notifyengine3.test_notifications(User) queued
Analysis version 705 of 1 entries has started.
Completions in file:///home/cllamach/Panopta/classic/src/tests/unit/notifyengine3/test_notifications.py at (46, 38)
Analysis of tests.unit.notifyengine3.test_notifications (User) on depth 0 completed in 1.6165 ms.
Analysis complete: 1 modules in 2.3219 ms.
Analysis version 705 of 1 entries has been completed in 1.7866 ms.
Analysis of tests.unit.notifyengine3.test_notifications(User) queued
Analysis version 706 of 1 entries has started.
Analysis of tests.unit.notifyengine3.test_notifications (User) on depth 0 completed in 1.3733 ms.
Analysis complete: 1 modules in 2.3307 ms.
Analysis version 706 of 1 entries has been completed in 1.5173 ms.
Completions in file:///home/cllamach/Panopta/classic/src/tests/unit/notifyengine3/test_notifications.py at (46, 39)
Analysis of tests.unit.notifyengine3.test_notifications(User) queued
Analysis version 707 of 1 entries has started.
Completions in file:///home/cllamach/Panopta/classic/src/tests/unit/notifyengine3/test_notifications.py at (46, 40)
Analysis of tests.unit.notifyengine3.test_notifications (User) on depth 0 completed in 1.4162 ms.
Analysis complete: 1 modules in 2.1195 ms.
Analysis version 707 of 1 entries has been completed in 1.5494 ms.
Completions in file:///home/cllamach/Panopta/classic/src/tests/unit/notifyengine3/test_notifications.py at (46, 41)
Analysis of tests.unit.notifyengine3.test_notifications(User) queued
Analysis version 708 of 1 entries has started.
Analysis of tests.unit.notifyengine3.test_notifications (User) on depth 0 completed in 2.1816 ms.
Analysis complete: 1 modules in 3.5213 ms.
Analysis version 708 of 1 entries has been completed in 2.3502 ms.
Analysis of tests.unit.notifyengine3.test_notifications(User) queued
Analysis version 709 of 1 entries has started.
Analysis of tests.unit.notifyengine3.test_notifications (User) on depth 0 completed in 1.4971 ms.
Analysis complete: 1 modules in 2.4873 ms.
Analysis version 709 of 1 entries has been completed in 1.7203 ms.
Signatures in file:///home/cllamach/Panopta/classic/src/tests/unit/notifyengine3/test_notifications.py at (46, 42)
@MikhailArkhipov What part of the source code would be in charge of traversing the related files and triggering analysis on them, perhaps I could debug those and find another clue on why he hangs up. Thanks for your help, and sorry for the long log dumps.
CMLL
on 10 Sep 2019
Is this related to #1601?
 astrowonk
on 17 Oct 2019
astrowonk
on 17 Oct 2019
Could be, the main symptom I'm seeing is the same message of analysis ongoing in the client.
CMLL
on 17 Oct 2019
Note that there seem to be two issues related to "analyzing in background", one where it's actually stuck and using resources, and one where the message just doesn't get updated.
jakebailey
on 17 Oct 2019
@jakebailey My issue I think is the first one, it renders the LS unusable, I've gone back to using Jedi for now, completions simply stop working or complete the generic same set of results everytime.
CMLL
on 17 Oct 2019
I'm experiencing the same issue using remote-ssh from windows to ubuntu 16.04, "analyzing in background" is stuck and autocompletion is completely broken.
Setting "python.jediEnabled": true "fixes" the problem.
 stillwalker1234
on 21 Oct 2019
stillwalker1234
on 21 Oct 2019
Same here on macOS 10.14.6, the LS analysis seemingly finishes but the autocompletion is broken (attempted on a simple str) and I see "analyzing in background..."
PLS v0.4.72.0
Python extension: 2019.11.42782-dev
Analysis version 2854 has been completed in 2.74 ms with 65 entries analyzed and 1423 entries skipped.
IntelliCode identified no likely completion items.
 ivasic
on 21 Oct 2019
ivasic
on 21 Oct 2019
@ivasic This issue is primarily due to a big file in the dependency chain for a file being edited. #1601 is likely closer to what you're experiencing, and if you have a codebase that reproduces the issue that'd be helpful. Since you're on 0.4.72, caching is enabled by default, so disabling it may work around the issue (https://github.com/microsoft/python-language-server/wiki/Module-caching), but finding the real cause would be best.
jakebailey
on 21 Oct 2019
@jakebailey thanks a lot for your response, disabling caching has helped! It also got rid of the "analyzing in background..." message.
ivasic
on 21 Oct 2019
@jakebailey Could this issue be related to circular dependencies between the files being imported?
CMLL
on 24 Oct 2019
disable cache work for me too. If there anything I could help, I would like to help reproduces as well.
 kis87988
on 3 Nov 2019
kis87988
on 3 Nov 2019
For that, read #1601. A PR is open to fix that issue (but there are other outstanding PRs that need to go in first, and merging a bunch of stuff on Friday isn't a great plan...).
jakebailey
on 3 Nov 2019
Related issues
astrowonk
·
39Comments
 brettcannon
·
29Comments
brettcannon
·
29Comments
 DonJayamanne
·
29Comments
DonJayamanne
·
29Comments
 Ark-kun
·
25Comments
MikhailArkhipov
·
46Comments
Ark-kun
·
25Comments
MikhailArkhipov
·
46Comments
Most helpful comment
For that, read #1601. A PR is open to fix that issue (but there are other outstanding PRs that need to go in first, and merging a bunch of stuff on Friday isn't a great plan...).