Hi all 👋🏼
Yesterday I deployed one of my Heroku apps with the new Puma v5 version (from 4.3.6 to 5.0.2). After that, my app starts to consume more memory (~x2) than in v4.3.6 (~pretty similar traffic):

I only changed the gem version, with no config tweaks. I'm running puma with no cluster mode (only 1 worker) "single" mode and 20 threads, Rails 6.0.3 and Ruby 2.6. Do you know if I can get back to prior memory usage with any setting I probably missed?
Thanks a lot for all your work in Puma!
NOTE I'm using Jemalloc too
 markets
All 36 comments
puma with no cluster mode (only 1 worker)
It's possible to run puma in cluster mode with 1 worker. This is actually distinct from running puma in "single" mode (non-clustered). Do you have the puma config file you're using? That'll make it easier to figure out what happened.
 cjlarose
on 29 Sep 2020
cjlarose
on 29 Sep 2020
ah! you're right @cjlarose, I mean I'm running "single" mode, this is my config file:
max_threads_count = ENV.fetch("RAILS_MAX_THREADS") { 20 }
min_threads_count = ENV.fetch("RAILS_MIN_THREADS") { max_threads_count }
threads min_threads_count, max_threads_count

port ENV.fetch("PORT") { 3000 }

environment ENV.fetch("RAILS_ENV") { "development" }

pidfile ENV.fetch("PIDFILE") { "tmp/pids/server.pid" }

plugin :tmp_restart
When booting the server (in development):
=> Booting Puma
=> Rails 6.0.3.3 application starting in development
=> Run `rails server --help` for more startup options
Puma starting in single mode...
* Version 5.0.2 (ruby 2.6.3-p62), codename: Spoony Bard
* Min threads: 20, max threads: 20
* Environment: development
* Listening on http://0.0.0.0:3000
I only upgraded Puma to v5.0.2 and deployed to Heroku (no other gems updates, no code changes ...), and the memory consumption practically doubled compared to v4.3.6.
markets
on 29 Sep 2020
What is the result of:
heroku config:get WEB_CONCURRENCY PUMA_MIN_THREADS PUMA_MAX_THREADS MIN_THREADS MAX_THREADS --app <your_app_name>
 nateberkopec
on 29 Sep 2020
nateberkopec
on 29 Sep 2020
@nateberkopec I don't set any of those ENV vars in Heroku, so I get "blank" response
[2.6.3] markets: ~/workspace/desaigner (master)$ heroku config:get WEB_CONCURRENCY PUMA_MIN_THREADS PUMA_MAX_THREADS MIN_THREADS MAX_THREADS
 ›   Warning: heroku update available from 7.42.11 to 7.43.0.


[2.6.3] markets: ~/workspace/desaigner (master)$
Can you post a screenshot of the memory statistics before you deployed 5.0? In your OP, you just posted the statistics since you deployed 5.0, but we can't see what memory usage looked like when you were running 4.3.6
nateberkopec
on 30 Sep 2020
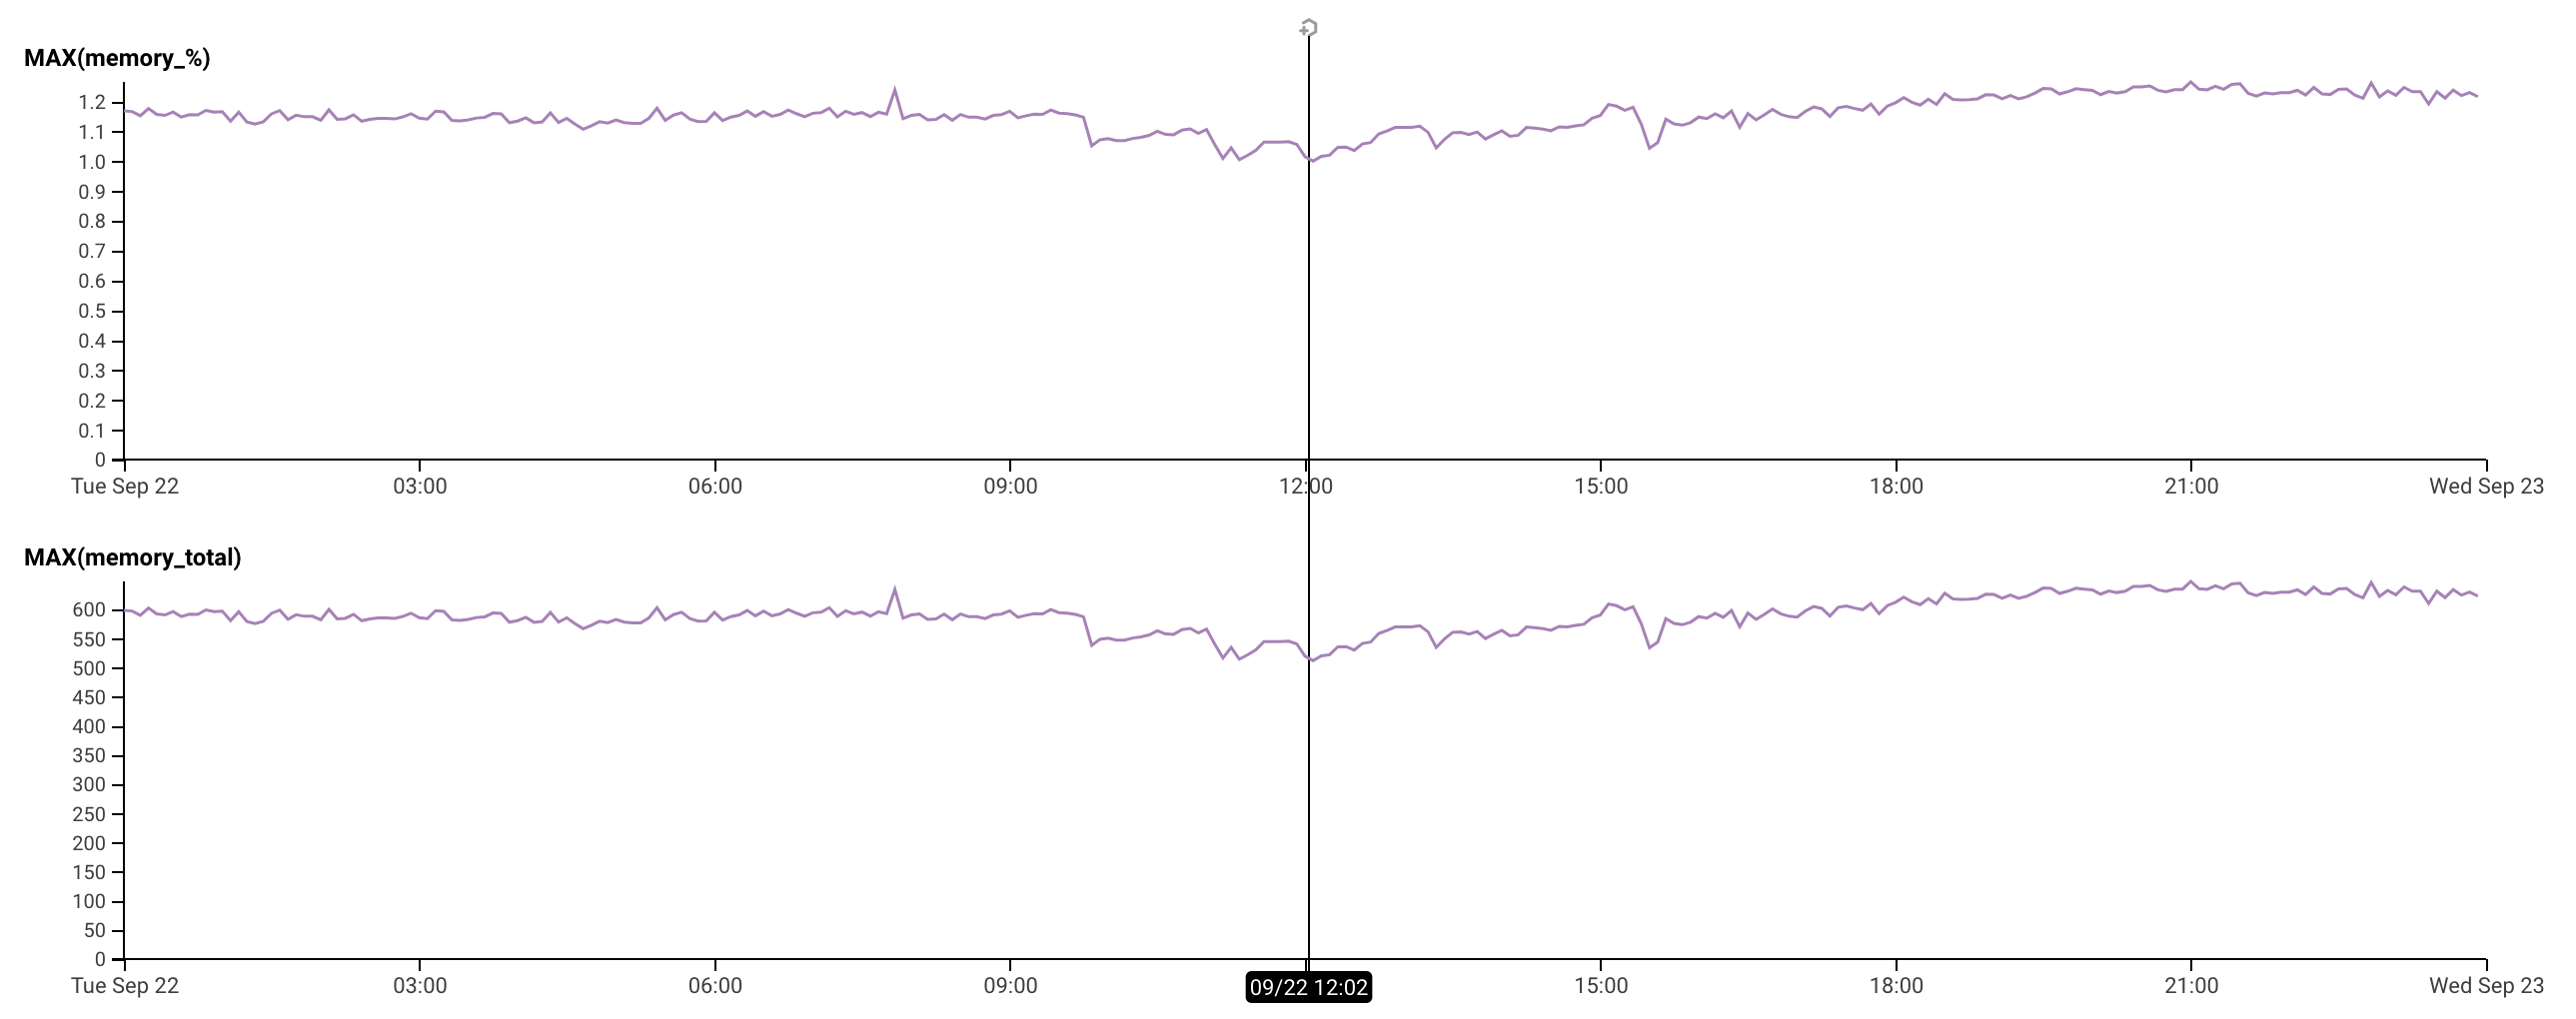
Sorry @nateberkopec, I only have access to 24h timeframe (Hobby dyno). I'm going to downgrade to Puma v4.3.6 and tomorrow will post the difference.
markets
on 30 Sep 2020
Works for me - about 12 hours of both versions visible would really help.
nateberkopec
on 30 Sep 2020
@markets you can change the dyno type for just a minute and the heroku dashboard will show you metrics for >24h 😉
 dentarg
on 30 Sep 2020
dentarg
on 30 Sep 2020
@markets you can change the dyno type for just a minute and the heroku dashboard will show you metrics for >24h 😉
is this possible (upgrade to Pro dynos) with 1 min? how much they will charge me for this movement? Interesting to know, thanks 😸
markets
on 30 Sep 2020
@markets yes, https://devcenter.heroku.com/articles/usage-and-billing, "Heroku calculates billing based on wall-clock usage", "All costs are prorated to the second"
dentarg
on 30 Sep 2020
oh! nice thanks!! I'm really enjoying this Heroku platform 👌🏼 :)) My first time deploying something "serious" in Heroku, used to going down to the metal 🤘🏼
markets
on 30 Sep 2020
Also, after you've got that memory data, what's the output of heroku logs -n 10000 --app <your app name> | grep --context=8 "Puma starting". You may need to restart your app to get output. I want to see the lines logged when Puma starts.
nateberkopec
on 30 Sep 2020
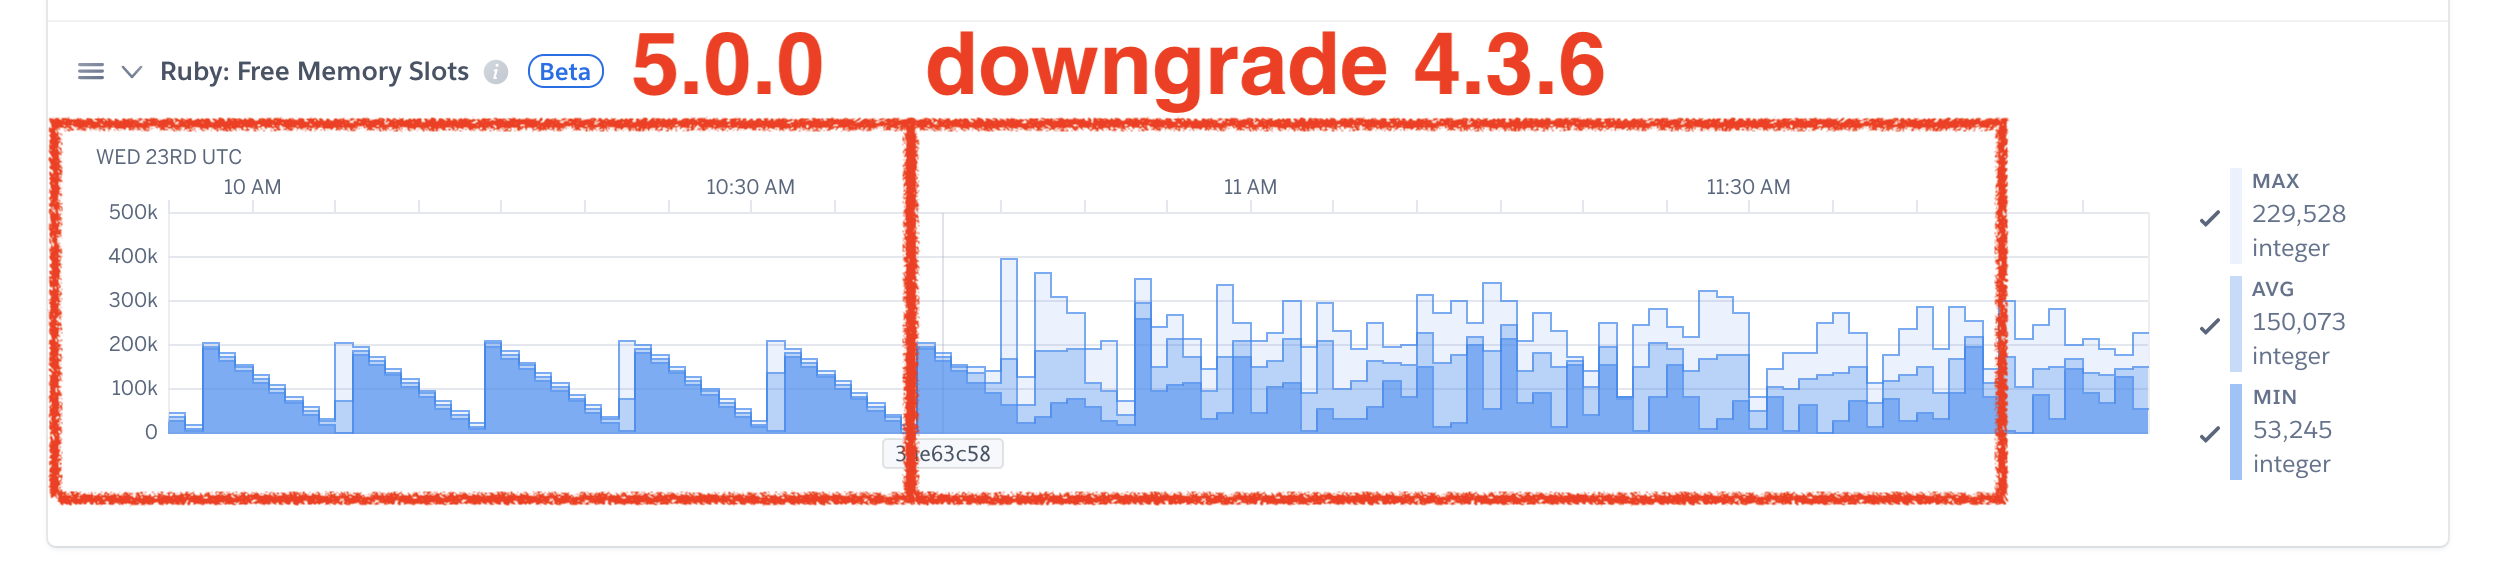
Hi there, I'm seeing similar spike patterns in memory with Heroku.
With 5.0.0 on Friday 18th:

Then with 5.0.2:

These env vars are not set: WEB_CONCURRENCY, PUMA_MIN_THREADS, PUMA_MAX_THREADS, MIN_THREADS MAX_THREADS
And the logs:
Starting process with command `PROC_TYPE=web bin/start-stunnel bin/puma -C config/puma.rb`
Puma starting in single mode...
We're on Rails 6.0.3.3, Ruby 2.6.6 if that helps.
Thank you for the amazing work, and I appreciate you're investigating this bug. Let me know how I can help you further.
 bernardeli
on 30 Sep 2020
bernardeli
on 30 Sep 2020
@nateberkopec about 12 hours of both versions visible 👇🏼

markets
on 30 Sep 2020
Hi, to chime in with saying we _aren't_ experience this:

Both applications running rails 6.0.3.3, puma 5.0.0, ruby 2.6.6, WEB_CONCURRENCY=1 MAX_THREADS=8 (cluster mode with a single worker), also running on heroku.
 CGA1123
on 30 Sep 2020
CGA1123
on 30 Sep 2020
I have the same problem:

We were using an 1 GB dyno and changed to an 2.5 GB dyno because we weren't able to find the cause of the problem.
When we reverted the gem upgrade everything turned to work right again.
We also checked the version 5.0.2.
Below our puma.rb:
````
Puma can serve each request in a thread from an internal thread pool.
The threads method setting takes two numbers: a minimum and maximum.
Any libraries that use thread pools should be configured to match
the maximum value specified for Puma. Default is set to 5 threads for minimum
and maximum; this matches the default thread size of Active Record.
#
max_threads_count = ENV.fetch("RAILS_MAX_THREADS") { 5 }
min_threads_count = ENV.fetch("RAILS_MIN_THREADS") { max_threads_count }
threads min_threads_count, max_threads_count
Specifies the port that Puma will listen on to receive requests; default is 3000.
#
port ENV.fetch("PORT") { 3000 }
Specifies the environment that Puma will run in.
#
environment ENV.fetch("RAILS_ENV") { "development" }
Specifies the pidfile that Puma will use.
pidfile ENV.fetch("PIDFILE") { "tmp/pids/server.pid" }
Specifies the number of workers to boot in clustered mode.
Workers are forked web server processes. If using threads and workers together
the concurrency of the application would be max threads * workers.
Workers do not work on JRuby or Windows (both of which do not support
processes).
#
workers ENV.fetch("WEB_CONCURRENCY") { 2 }
Use the preload_app! method when specifying a workers number.
This directive tells Puma to first boot the application and load code
before forking the application. This takes advantage of Copy On Write
process behavior so workers use less memory.
#
preload_app!
Allow puma to be restarted by rails restart command.
plugin :tmp_restart
on_worker_boot do
# Valid on Rails 4.1+ using the config/database.yml method of setting pool size
ActiveRecord::Base.establish_connection
end
before_fork do
# worker configuration
Barnes.start
end
```
 cesarjr
on 30 Sep 2020
cesarjr
on 30 Sep 2020
We've repro'd as well on codetriage, will start bisecting soon to figure out which commit it is
nateberkopec
on 30 Sep 2020
@schneems has narrowed it down to a range of about 4 commits. Should have an idea of the issue soon.
nateberkopec
on 1 Oct 2020
Good news everyone! It's not a bug. It's a feature! Before I say more. Let's talk about debugging technique.
Debug process
My web app https://www.codetriage.com was running a beta version of Puma 5 for some time. When Nate put out a call for people who had seen this issue in the wild I asked if it showed up on CodeTriage. Nate deployed v436 and we saw memory use go way down. We've got a reproduction!
I then made a list of all the commits between the beta version we were previously on, and a known "low memory" commit. I then manually bisected the list. I deployed, waited ~30 minutes to see if the issue was present and then went higher or lower to zero in on the problem.
- https://github.com/codetriage/CodeTriage/pull/1381
- https://github.com/codetriage/CodeTriage/pull/1382
- https://github.com/codetriage/CodeTriage/pull/1383
- https://github.com/codetriage/CodeTriage/pull/1384
- https://github.com/codetriage/CodeTriage/pull/1385
- https://github.com/codetriage/CodeTriage/pull/1386
- https://github.com/codetriage/CodeTriage/pull/1387
- https://github.com/codetriage/CodeTriage/pull/1388
Towards the end I started posting pictures of memory graphs. In the last one, https://github.com/codetriage/CodeTriage/pull/1388, I describe exactly what I expect to see when I deploy if my theory holds, then I deployed and my theory held.
Here's a graph:

Look at the right side of the graph. Memory drops a bunch that's me deploying ae3522cb. When it climbs dramatically, that's me deploying dc3b9b89.
So what happened in that commit range? It's only one commit, and it was pretty minor, but it did include this line: https://github.com/puma/puma/blob/bb61c7b151c1610e107f914509cac8bb2a9a8b01/lib/puma/configuration.rb#L188
:workers => Integer(ENV['WEB_CONCURRENCY'] || 0),
What happened in CodeTriage is that even though I've set WEB_CONCURRENCY on my app:
$ heroku run "env | grep WEB_CONCURRENCY"
Running env | grep WEB_CONCURRENCY on ⬢ issuetriage... up, run.3307 (Standard-1X)
WEB_CONCURRENCY=2
I never modified my config to read it in https://github.com/codetriage/CodeTriage/blob/54dddf119a2f81f7e628bfbd09ff678afe782bd7/config/puma.rb. Note the lack of a workers configuration in that file.
So essentially: I had been accidentally running in puma's "single" mode for the last few years even though I had intended to use processes and modify it via WEB_CONCURRENCY env var. With this commit, now my application is honoring my wishes and is booting two processes.
Good news
The good news is that this increased memory use comes with increased performance. If you look at my graph above, when memory goes down...response time goes up, and the rails autoscale add-on kicks in to scale the app up. When memory goes back up due to more processes, response time goes down and auto-scaling goes down.
So basically: I wasn't getting the perf I could have gotten out of this dyno if I had utlizing the config that I was setting.
TLDR;
Puma now knows about WEB_CONCURRENCY env var and is honoring the value set on your system. If you're going above your memory limit's you'll need to adjust your WEB_CONCURRENCY value down. If you're under your memory limits, you likely got increased performance from increased CPU usage that comes with multiple processes that you weren't getting before. You'll likely also want to modify your config/puma.rb to be a bit more clear about where the workers value is coming from. Rails generates the config file with this line commented out by default:
# workers ENV.fetch("WEB_CONCURRENCY") { 2 }
I recommend uncommenting this line.
 schneems
on 1 Oct 2020
schneems
on 1 Oct 2020
While this might not have been expected. I think it's not a bug to be fixed. I think we should keep the current behavior and honor WEB_CONCURRENCY.
schneems
on 1 Oct 2020
@schneems Hi! Would it be worth adding a mention of WEB_CONCURRENCY now being honoured to https://github.com/puma/puma/blob/master/5.0-Upgrade.md to reduce potential for confusion? :-)
 edmorley
on 1 Oct 2020
edmorley
on 1 Oct 2020
Great idea @edmorley. On it!
schneems
on 1 Oct 2020
ok @schneems thanks a lot for this depth investigation 👌🏼
Just to have a clear understanding, if I'm running in single mode, is this WEB_CONCURRENCY affecting me?
From the generated config/puma.rb:
# Specifies the number of `workers` to boot in clustered mode.
# Workers are forked web server processes. If using threads and workers together
# the concurrency of the application would be max `threads` * `workers`.
# Workers do not work on JRuby or Windows (both of which do not support
# processes).
#
# workers ENV.fetch("WEB_CONCURRENCY") { 2 }
But I'm not running in clustered mode, so I was assuming this didn't affect my app (single mode).
markets
on 1 Oct 2020
If you want to run in single mode I think you can manually set your workers to zero. Uncomment that line and either hard code a 0 or set your WEB_CONCURRENCY env var to zero:
workers 0
or
$ heroku config:set WEB_CONCURRENCY=0
And then:
workers ENV.fetch("WEB_CONCURRENCY") { 0 }
Here's an example of me explicitly passing in 0 from the CLI even with WEB_CONCURRENCY:
$ WEB_CONCURRENCY=2 bin/puma -C config/puma.rb -w 0
Puma starting in single mode...
* Version 5.0.2 (ruby 2.7.1-p83), codename: Spoony Bard
* Min threads: 5, max threads: 5
* Environment: development
Note that it says it's booting in "single mode"
The reason I gave this example previously instead of a heroku config example:
$ heroku run "env | grep WEB_CONCURRENCY"
Is because something might be setting the value for you even if you've not got your config var set, for example a buildpack. The Ruby buildpack doesn't set a value for now, but some others do. In general I recommend explicitly setting the value and not relying on defaults, as the default might change (as in this situation) and then it's confusing to figure out where the change in behavior came from.
schneems
on 1 Oct 2020
@schneems hey, people here have reported higher memory usage when running in single mode on Puma 5 (they don't have WEB_CONCURRENCY environment variable nor workers set it looks like). I think your explanation works out for CodeTriage but not the others that have posted here:
dentarg
on 1 Oct 2020
Is because something might be setting the value for you even if you've not got your config var set
ok, it had to be configured by other piece in my system, like a buildpack as you said, because without that (workers 0), booting in local also says "single mode":
=> Booting Puma
=> Rails 6.0.3.3 application starting in development
=> Run `rails server --help` for more startup options
Puma starting in single mode...
And yees!! if I run that command:
$ heroku run "env | grep WEB_CONCURRENCY"
WEB_CONCURRENCY=2
Something is setting that ENV var for us!
Just in case it helps or gives some clues, here are my buildpacks list:

markets
on 1 Oct 2020
@dentarg see my comment above https://github.com/puma/puma/issues/2393#issuecomment-702384439, probably some buildpack or library/package/gem is setting that ENV var:
$ heroku config:get WEB_CONCURRENCY PUMA_MIN_THREADS PUMA_MAX_THREADS MIN_THREADS MAX_THREADS


$ heroku run "env | grep WEB_CONCURRENCY"
WEB_CONCURRENCY=2
And since v5, this is now read by Puma itself as @schneems pointed out in https://github.com/puma/puma/issues/2393#issuecomment-702352208.
I think it makes more sense this new behaviour, but would be nice to know who is setting this ENV var for us and also this #2402 to help future readers :)
markets
on 1 Oct 2020
I think it makes more sense this new behaviour, but would be nice to know who is setting this ENV var for us and this #2402 :)
@markets you can find where it's being set in the .profile.d/ directory:
$ heroku run bash
~ $ grep -r WEB_CONCURRENCY ./.profile.d/*
Looks like the Python buildpack does it? https://github.com/heroku/heroku-buildpack-python/search?q=WEB_CONCURRENCY
dentarg
on 1 Oct 2020
@schneems @dentarg thanks!
yes, I can confirm this comes from the Python buildpack (settings for Gunicorn server):
~ $ grep -r WEB_CONCURRENCY ./.profile.d/*
./.profile.d/WEB_CONCURRENCY.sh:  export WEB_CONCURRENCY=${WEB_CONCURRENCY:-2}
./.profile.d/WEB_CONCURRENCY.sh:  export WEB_CONCURRENCY=${WEB_CONCURRENCY:-4}
./.profile.d/WEB_CONCURRENCY.sh:  export WEB_CONCURRENCY=${WEB_CONCURRENCY:-8}
./.profile.d/WEB_CONCURRENCY.sh:  export WEB_CONCURRENCY=${WEB_CONCURRENCY:-11}
~ $ more ./.profile.d/WEB_CONCURRENCY.sh
case $(ulimit -u) in

# Automatic configuration for Gunicorn's Workers setting.

# Standard-1X (+Free, +Hobby) Dyno
256)
  export DYNO_RAM=512
  export WEB_CONCURRENCY=${WEB_CONCURRENCY:-2}
  ;;

...
Most buildpacks define a default WEB_CONCURRENCY it. Ruby doesn't because this is such a common pattern:
workers ENV.fetch("WEB_CONCURRENCY") { 2 }
In this situation, developers will EXPECT that not setting the WEB_CONCURRENCY to mean the same thing as WEB_CONCURRENCY=2, but in other languages, it's less common. I had a PR to introduce defaults to Ruby but only for new apps to not break backwards compat. It gets even more confusing when you throw in more buildpacks as they install in isolation and can conflict with one-another.
schneems
on 1 Oct 2020
@schneems I agree, now that I understand better the whole situation I think it's much better to have a value defined for the workers option (even if 0, for single mode), and probably, this line uncommented in Rails generators (or at least some documentation tweaks):
# workers ENV.fetch("WEB_CONCURRENCY") { 2 }
Thank you everybody for digging into this!
markets
on 2 Oct 2020
Thanks everyone for helping with this.
Even though we're running ruby/rails app, our buildpacks include the official heroku/nodejs.
We're running in thread mode at the moment and so workers were set to 0 via PUMA_WORKERS env var.
With the new defaults where workers read from WEB_CONCURRENCY, I assumed I could just set that to 0 and call it a day.
It just happens that the nodejs buildpack assumes WEB_CONCURRENCY < 0 or > 200 isn't correct and sets WEB_CONCURRENCY back to 1: https://github.com/heroku/heroku-buildpack-nodejs/blob/main/profile/WEB_CONCURRENCY.sh#L8-L14
I don't have nodejs context to know why it needs to be 1. The workaround I found is to hardcode workers to 0 in config/puma.rb and proceed with the upgrade from v4 to v5.
Again, I appreciate everyone's time and effort diggint into this. 🙏🏻
bernardeli
on 2 Oct 2020
Sorry for not including that one in the upgrade guide! I had no idea Heroku buildpacks other than Ruby would set WEB_CONCURRENCY. If I did, I definitely would have made this change more obvious in the changelog.
nateberkopec
on 2 Oct 2020
Some extra background, in case it's useful:
- whilst the Ruby buildpack doesn't (at least currently) set a default
WEB_CONCURRENCYvalue, the Python, Nodejs and PHP Heroku buildpacks do - they set it via a profile script at
.profile.d/WEB_CONCURRENCY.shin the app's slug (example) - the original idea was that users could order their buildpacks such that the "main" language is last, and so the last buildpack's
.profile.d/WEB_CONCURRENCY.shwould win (since it overwrites the versions from earlier buildpacks) - similar to how the buildpacks API uses thebin/releaseoutput from only the last buildpack
edmorley
on 2 Oct 2020
I just encountered this issue on Heroku when attempting to replace Passenger with Puma in an application. It prompted me to submit a PR to heroku/nodejs to respect a manually set WEB_CONCURRENCY.
The behavior that I'm seeing is documented in that PR, but if you're seeing values that you don't expect for WEB_CONCURRENCY, it could be that you're experiencing the behavior that I'm seeing.
A buildpack's preferences shouldn't take precedence over an explicitly configured value, but that's what appears to be happening at the moment.
 michaelherold
on 9 Dec 2020
michaelherold
on 9 Dec 2020
Related issues
 gingerlime
·
47Comments
gingerlime
·
47Comments
 brunowego
·
29Comments
brunowego
·
29Comments
 bmclean
·
23Comments
bmclean
·
23Comments
 PetrKaleta
·
38Comments
PetrKaleta
·
38Comments
 wxmn
·
29Comments
wxmn
·
29Comments
Most helpful comment
We've repro'd as well on
codetriage, will start bisecting soon to figure out which commit it is