Puma: Puma 5.0.0 HTTP connection error: #<Puma::ConnectionError: Connection error detected during read>
After upgrading to puma 5.0.0 I am seeing HTTP connection error: #<Puma::ConnectionError: Connection error detected during read> error in server logs directly after server starts. This happens just on Heroku. Regardless that app is working without any issues...
2020-09-17T17:58:33.045281+00:00 app[web.1]: Puma starting in single mode...
2020-09-17T17:58:33.045331+00:00 app[web.1]: * Version 5.0.0 (ruby 2.7.1-p83), codename: Spoony Bard
2020-09-17T17:58:33.045332+00:00 app[web.1]: * Min threads: 10, max threads: 10
2020-09-17T17:58:33.045332+00:00 app[web.1]: * Environment: production
2020-09-17T17:58:33.684588+00:00 app[web.1]: * Listening on http://0.0.0.0:31428
2020-09-17T17:58:33.684657+00:00 app[web.1]: Use Ctrl-C to stop
2020-09-17T17:58:34.163946+00:00 app[web.1]: 2020-09-17 17:58:34 +0000 HTTP connection error: #<Puma::ConnectionError: Connection error detected during read>
2020-09-17T17:58:35.162918+00:00 heroku[web.1]: State changed from starting to up
 PetrKaleta
All 38 comments
I see this too, on my app I just updated earlier today. It too runs on Heroku. I see many ConnectionError lines, not only directly after server start. Yeah, the app seems to work (it does not have a lot of traffic).
 dentarg
on 18 Sep 2020
dentarg
on 18 Sep 2020
This might be that more logging was added in 5.0.0 and that Puma has always operated in this way.
dentarg
on 18 Sep 2020
pinging @schneems just because he may have more visibility here, possibly also related to the H13 issue
 nateberkopec
on 18 Sep 2020
nateberkopec
on 18 Sep 2020
I deployed Puma 5 into a production service yesterday and have been noticing increased timeouts. Matches exactly this issue so seems more than just logging.
 davejcameron
on 18 Sep 2020
davejcameron
on 18 Sep 2020
Getting this error on as well.
rails: 6.0.3.3 - testing on local machine with RAILS_ENV=development
puma: 5 (2 workers, 32 threads - yes this a lot), didn't added the new cool config options yet.
ruby: 2.6.6p146
os: mac
Doing simple wrk http://localhost:3000/test/test
puma 5:
Running 10s test @ http://localhost:3000/test/test
  2 threads and 10 connections
  Thread Stats   Avg      Stdev     Max   +/- Stdev
    Latency   200.95ms   88.58ms 621.15ms   70.44%
    Req/Sec    21.57     10.24    49.00     61.29%
  284 requests in 10.09s, 143.66KB read
  Socket errors: connect 0, read 0, write 0, timeout 10
Requests/sec:     28.14
Transfer/sec:     14.24KB
If I can assist troubleshooting this, let me know :)
edit:
did simple puts debugging to try to gather more information:
I added SecureRandom.hex so I can follow the call logs for a specific request -
[7e5040a7e3cbe34e071c7be9d3659446] eaglery finish is called
[7e5040a7e3cbe34e071c7be9d3659446] [eagerly_finish] ready: false
[7e5040a7e3cbe34e071c7be9d3659446] [eagerly_finish] to_io: #<TCPSocket:0x00007fde727268e0>
[7e5040a7e3cbe34e071c7be9d3659446] [eagerly_finish] calling try_to_finish
[7e5040a7e3cbe34e071c7be9d3659446] [try_to_finish] read_nonblock(16384) failed end of file reached
[7e5040a7e3cbe34e071c7be9d3659446] http connection error Connection error detected during read
the root error is from try_to_finish - https://github.com/puma/puma/blob/master/lib/puma/client.rb#L155
 yosiat
on 19 Sep 2020
yosiat
on 19 Sep 2020
Sounds like root cause is https://github.com/puma/puma/commit/adb6170b77ce4a4ea156f0198678444f61b39255 then?
nateberkopec
on 19 Sep 2020
@nateberkopec did manual revert of this commit (replace IO::WaitReadable with Errno::EAGAIN in my local installed version of puma) and still getting those timeouts (and same logs as above):
Running 10s test @ http://localhost:3000/test/test
  2 threads and 10 connections
  Thread Stats   Avg      Stdev     Max   +/- Stdev
    Latency   217.04ms  127.82ms 767.33ms   74.11%
    Req/Sec    15.55      9.12    50.00     70.69%
  207 requests in 10.02s, 104.71KB read
  Socket errors: connect 0, read 0, write 0, timeout 10
Requests/sec:     20.67
Transfer/sec:     10.45KB
edit:
did another test, cloned puma and ran it:
bundle exec bin/puma -w 2 -t 32 test/rackup/hello.ru and then doing wrk http://localhost:9292.
results of wrk are:
Running 10s test @ http://localhost:9292
  2 threads and 10 connections
  Thread Stats   Avg      Stdev     Max   +/- Stdev
    Latency   614.96us  546.24us  10.99ms   95.63%
    Req/Sec     8.97k     1.22k   11.12k    76.00%
  178502 requests in 10.00s, 12.94MB read
Requests/sec:  17843.37
Transfer/sec:      1.29MB
no timeouts, but in console: 2020-09-20 13:06:22 +0300 HTTP connection error: #<Puma::ConnectionError: Connection error detected during read>.
edit2:
tried to check with new rails app, using the same config as my main rails app and not getting timeouts:
Running 10s test @ http://localhost:3000/test/test
  2 threads and 10 connections
  Thread Stats   Avg      Stdev     Max   +/- Stdev
    Latency    11.47ms    3.34ms  32.19ms   83.80%
    Req/Sec   438.94     35.36   500.00     81.00%
  8749 requests in 10.01s, 4.21MB read
Requests/sec:    873.96
Transfer/sec:    430.20KB
1) Can someone give me an example app that reproduces the problem (https://www.codetriage.com/example_app)?
2) These reproductions you're seeing, are any of them local, or are they only on heroku?
 schneems
on 21 Sep 2020
schneems
on 21 Sep 2020
@schneems
- All my reproductions are happening locally, our app doesn't run on Heroku (it runs on k8s). I can deploy the app to a staging environment and see if I have timeouts their if it helps.
- I tried creating a minimal reproduction app but can't, this why I published all info I can give - from logs to trial to reproduction on simple rails app and puma hello.ru example.
If you can give me any guidance on how to give better visibility what's going on I'll be happy to help.
yosiat
on 21 Sep 2020
@schneems I can see it as well after deploying to heroku, but I didn't reproduce it locally yet.
I could maybe open Heroku support ticket, so you could look into it on our production app?
 morgoth
on 21 Sep 2020
morgoth
on 21 Sep 2020
@schneems , I can see it at my app on Heroku - https://dashboard.heroku.com/apps/florsan, but can't reproduce it locally.
 texpert
on 21 Sep 2020
texpert
on 21 Sep 2020
I'm trying to narrow down the scope of the problem. It seems the behavior is correlated to something since it's seen by some only on Heroku and some only on a certain type of app.
- For those of you who are only seeing it on Heroku. Did you try locally with
wrk? Then grep the logs?
brew install wrk
wrk http://localhost:9292
- If you can see the behavior on Heroku, how often does it happen? Is it a function of load? If you deploy to a new Heroku app can you reproduce the error? Does it require load or can you do it just by hitting the app.
If we cannot reproduce this reliably then it will be hard to debug. The other possibility would be to try to bisect the git commits until we find one where it works with the one before it and fails on it. If you can reproduce safely via a staging app that would be fore the best.
schneems
on 21 Sep 2020
@schneems I created a ticket for my app, https://help.heroku.com/tickets/920245, if it can help in any way
I can also reproduce(-ish) it locally in macOS. It happens more often on Heroku than I see locally, but I haven't tried replicating the same traffic locally (but the production app does not have a heavy load). The code for my app is public: https://github.com/Starkast/wikimum
The steps I did in macOS to start the app (using https://github.com/Starkast/wikimum/commit/0bc59331ebcedfca482e1b54211788edf9ccb0dd)
createdb wikimum-puma-2371
DATABASE_URL=postgres://localhost/wikimum-puma-2371 bundle e rake db:migrate
DATABASE_URL=postgres://localhost/wikimum-puma-2371 bundle e puma -C config/puma.rb
After Puma has booted, and when the wrk command is started, I can see one line of 2020-09-21 17:30:16 +0200 HTTP connection error: #<Puma::ConnectionError: Connection error detected during read> before the request logging starts. Full log here. I've tested the same thing using Puma 4.3.6 and the error isn't logged then.
There are no timeouts from wrk:
$ wrk http://127.0.0.1:3000
Running 10s test @ http://127.0.0.1:3000
  2 threads and 10 connections
  Thread Stats   Avg      Stdev     Max   +/- Stdev
    Latency    49.27ms   19.55ms 231.59ms   87.16%
    Req/Sec   105.14     20.24   160.00     74.49%
  2081 requests in 10.05s, 5.65MB read
Requests/sec:    206.99
Transfer/sec:    575.28KB
I see the same thing as @dentarg (one Puma::ConnectionError: Connection error detected during read line locally when I start a wrk command against Rails running on Puma 5 under macOS). I also see it with a brand new Rails project with nothing else modified aside from setting the Ruby version to 2.6.6 and Puma 5 in the Gemfile, available here: https://github.com/ryanfb/puma_connection_error
I also just used the same repo with Ruby 2.5.7 and ran the same test and see the same behavior.
 ryanfb
on 21 Sep 2020
ryanfb
on 21 Sep 2020
I used the above minimal repo to manually bisect which puma commit between v4.3.6 and v5.0.0 first results in the error being output in a local environment with wrk, and it's 265f638d2beb9ee60d1af5e5c03ae876b0c3e4d8 (though the error format is different):
=> Booting Puma
=> Rails 6.0.3.3 application starting in development
=> Run `rails server --help` for more startup options
Puma starting in single mode...
* Version 4.3.3 (ruby 2.6.6-p146), codename: Mysterious Traveller
* Min threads: 5, max threads: 5
* Environment: development
* Listening on tcp://0.0.0.0:3000
Use Ctrl-C to stop
2020-09-21 12:40:06 -0400 HTTP connection error: #<Puma::ConnectionError: Connection error detected during read>
Handling request {   } ()
/Users/ryan/.rbenv/versions/2.6.6/lib/ruby/gems/2.6.0/bundler/gems/puma-265f638d2beb/lib/puma/client.rb:159:in `rescue in try_to_finish'
/Users/ryan/.rbenv/versions/2.6.6/lib/ruby/gems/2.6.0/bundler/gems/puma-265f638d2beb/lib/puma/client.rb:154:in `try_to_finish'
/Users/ryan/.rbenv/versions/2.6.6/lib/ruby/gems/2.6.0/bundler/gems/puma-265f638d2beb/lib/puma/client.rb:239:in `eagerly_finish'
/Users/ryan/.rbenv/versions/2.6.6/lib/ruby/gems/2.6.0/bundler/gems/puma-265f638d2beb/lib/puma/server.rb:199:in `block in run'
/Users/ryan/.rbenv/versions/2.6.6/lib/ruby/gems/2.6.0/bundler/gems/puma-265f638d2beb/lib/puma/thread_pool.rb:137:in `block in spawn_thread'
I've updated the Gemfile in the puma_connection_error repo to use this commit.
Since the error is probably still happening before this commit, and just isn't logged, it would probably be trickier to bisect that.
ryanfb
on 21 Sep 2020
I confirm that I'm seeing a failure with the repro app
- Works (no error)
# works
gem 'puma', git: 'https://github.com/puma/puma.git', ref: 'c606471b5ae436a165ee2f083a35635c90a29b93'
- Fails (with error)
# fails
 gem 'puma', git: 'https://github.com/puma/puma.git', ref: '265f638d2beb9ee60d1af5e5c03ae876b0c3e4d8'
For convenience here are commits in a historical view that contains both of those: https://github.com/puma/puma/commits/master?after=7d00e1dc3c71b77ea171f503e6c9be24836314eb+174&branch=master
cc @alexeevit any idea what might be at play here?
schneems
on 22 Sep 2020
Seems the error was there just swallowed by the server, and the logging refactoring revealed it - https://github.com/alexeevit/puma/commit/2d7ff5da5007dcaf8321601e77166c1c3391f3b9
texpert
on 22 Sep 2020
This is stream of concious, so bare with me a bit as I semi-live debug this.
I'm not able to reproduce this with curl or with nc. Which makes me think that wrk is doing something special/specific that's a part of this failure. I was hoping if I could reproduce this with curl then I could detect the issue by looking for a specific response status or curl error, but I'm still unsure how to reproduce this outside of using wrk.
FWIW the error that's coming from:
data = @io.read_nonblock(CHUNK_SIZE)
Is EOFError and there's nothing on the socket. So my best guess (at the moment) is that wrk initializes a socket and connects with puma before sending over any data, and this raises an EOFError since there's no data yet.
Okay actually as i'm typing this it looks like I can repro with nc. I had to add this to my environment/development.rb:
$ cat config/environments/development.rb | grep host
  config.hosts.clear
Then when I run netcat without a header or body I get the same error:
$ printf '' | nc -n 127.0.0.1 3000
Which made me think that maybe wrk was sending empty requests somehow. I forced it not to by specifying a header
$ wrk http://localhost:3000 -H "Foo: bar"
This didn't change anything, I still saw the errors in Rails. I added some logging and saw that wrk is sending this as the full request:
GET / HTTP/1.1\r\nHost: localhost:3000\r\nFoo: bar\r\n\r\n
So I tried that with netcat:
printf 'GET / HTTP/1.1\r\nHost: localhost:3000\r\nFoo: bar\r\n\r\n' | nc -n 127.0.0.1 3000
And i'm still not able to see the same problem with netcat.
So i'm back at square one.
I did realize though that when you run wrk not all the requests fail, I only get two errors. I also noticed this output from wrk:
$ wrk http://localhost:3000 -H "Foo: bar"
Running 10s test @ http://localhost:3000
  2 threads and 10 connections
When I bump it up to "3" threads I still only get 2 errors, so maybe it's not related. But it is interesting that it's always 2 errors from wrk for me, not more...not fewer.
So my current theory is still something along the lines of wrk is opening a socket and puma is trying to read it but there's no data yet. I'm not sure how to test this theory. I could try to manually make socket objects in Ruby...maybe? The other alternative is to try to figure out why the same behavior doesn't exist in puma 4.x.
schneems
on 22 Sep 2020
If I switch to puma 4.3.6 and add the same logging I see an empty request being read and an EOFError:
nil
#<EOFError: end of file reached>
nil
#<EOFError: end of file reached>
So it's the same error (and two of them) but it's just not being logged. AFAIK it looks like this behavior is reasonable. Or at least it's not causing problems.
Several of yall have said you've said stuff like
been noticing increased timeouts. Matches exactly this issue so seems more than just logging.
If that's the case, then either this wrk example doesn't reproduce the same failure mode, or the timeouts are unrelated.
TLDR; From my investigation it looks like the behavior of puma hasn't changed here between 4.x and 5.x, but logging did.
schneems
on 22 Sep 2020
I'm going to deploy puma 5.0.0 and see if I can get a reproduction, it's quite possible based on the description above that it was environmental in my case and was resolved by a rollback. I should know more tomorrow, and can report back. I know other services that have upgraded to puma 5.0.0 without issue.
davejcameron
on 22 Sep 2020
For convenience here are commits in a historical view that contains both of those: https://github.com/puma/puma/commits/master?after=7d00e1dc3c71b77ea171f503e6c9be24836314eb+174&branch=master
cc @alexeevit any idea what might be at play here?
Yup, it seems like logging behavior was changed. The commit you've mentioned does not really reflect the changes I've made. That's better to take a look at the whole PR: https://github.com/puma/puma/pull/2250/files
I'm also looking for the root of the problem.
 alexeevit
on 22 Sep 2020
alexeevit
on 22 Sep 2020
I'm not sure, but it looks like we must not raise a ConnectionError on EOFError here because it's not unexpected EOF. In according to the apidock:
read_nonblock causes EOFError on EOF.
So IMO it would be better just to swallow EOFError here. WDYT?
alexeevit
on 22 Sep 2020
So IMO it would be better just to swallow EOFError here. WDYT?
I'm okay with that. But I would feel better if we knew why wrk was causing this. I.e. is it an empty socket connection? Is it trying to make some http 5.0 request that we don't support ? If we figure that out then we can add a test for it. The only way I was able to raise the same error was the empty netcat request. I'm unclear if that's the same think wrk is doing or why it's doing it twice per test-run.
If people are seeing this in prod it makes me wonder what the conditions that cause it are. Are browsers or people sending empty requests or is something else going on? There might be a case here that we should be handling different. If someone wants to go through wrk to try to figure out why the request is getting an EOF, it's open source (though written in C).
schneems
on 22 Sep 2020
@schneems It is not only wrk that is causing this. From the 100 lines heroku logs give me 46 about Connection error detected during read for my app on Heroku (https://help.heroku.com/tickets/920245). I haven't tried to understand this more yet. I can add that the Heroku app has a proxy (nginx) in front of it (users are accessing it via the proxy, the proxy is run on another server). Maybe that makes it more common somehow. I can see the error happening even when there aren't any requests happening.
dentarg
on 22 Sep 2020
I noted this behavior change introduced by #2250 as a potential regression in https://github.com/puma/puma/pull/2279#issuecomment-642322710. There are three code blocks that catch ConnectionError, and until #2250 they all swallowed the error without logging them. Note the existing comment in one of these code blocks which explains why: https://github.com/puma/puma/blob/3cb00a6b6838bca98af380200c066fb3246fda9a/lib/puma/reactor.rb#L229-L234
 wjordan
on 23 Sep 2020
wjordan
on 23 Sep 2020
I don't know how to reproduce the problem but using Puma 5.0.0, our app is generating the same log error and the memory is increasing too much suddenly.
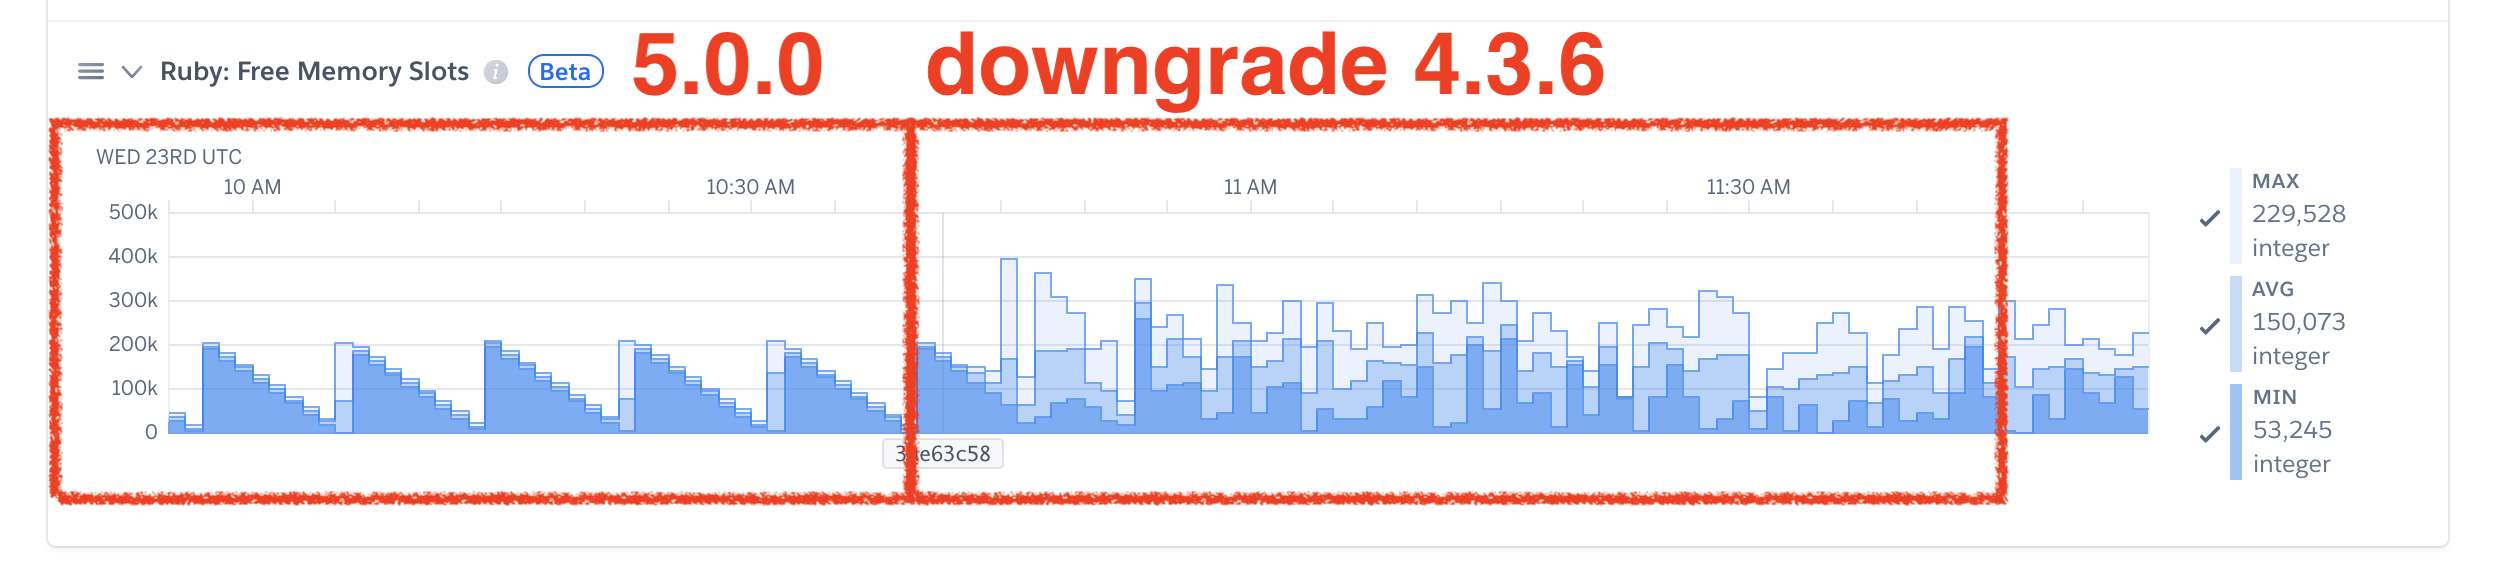
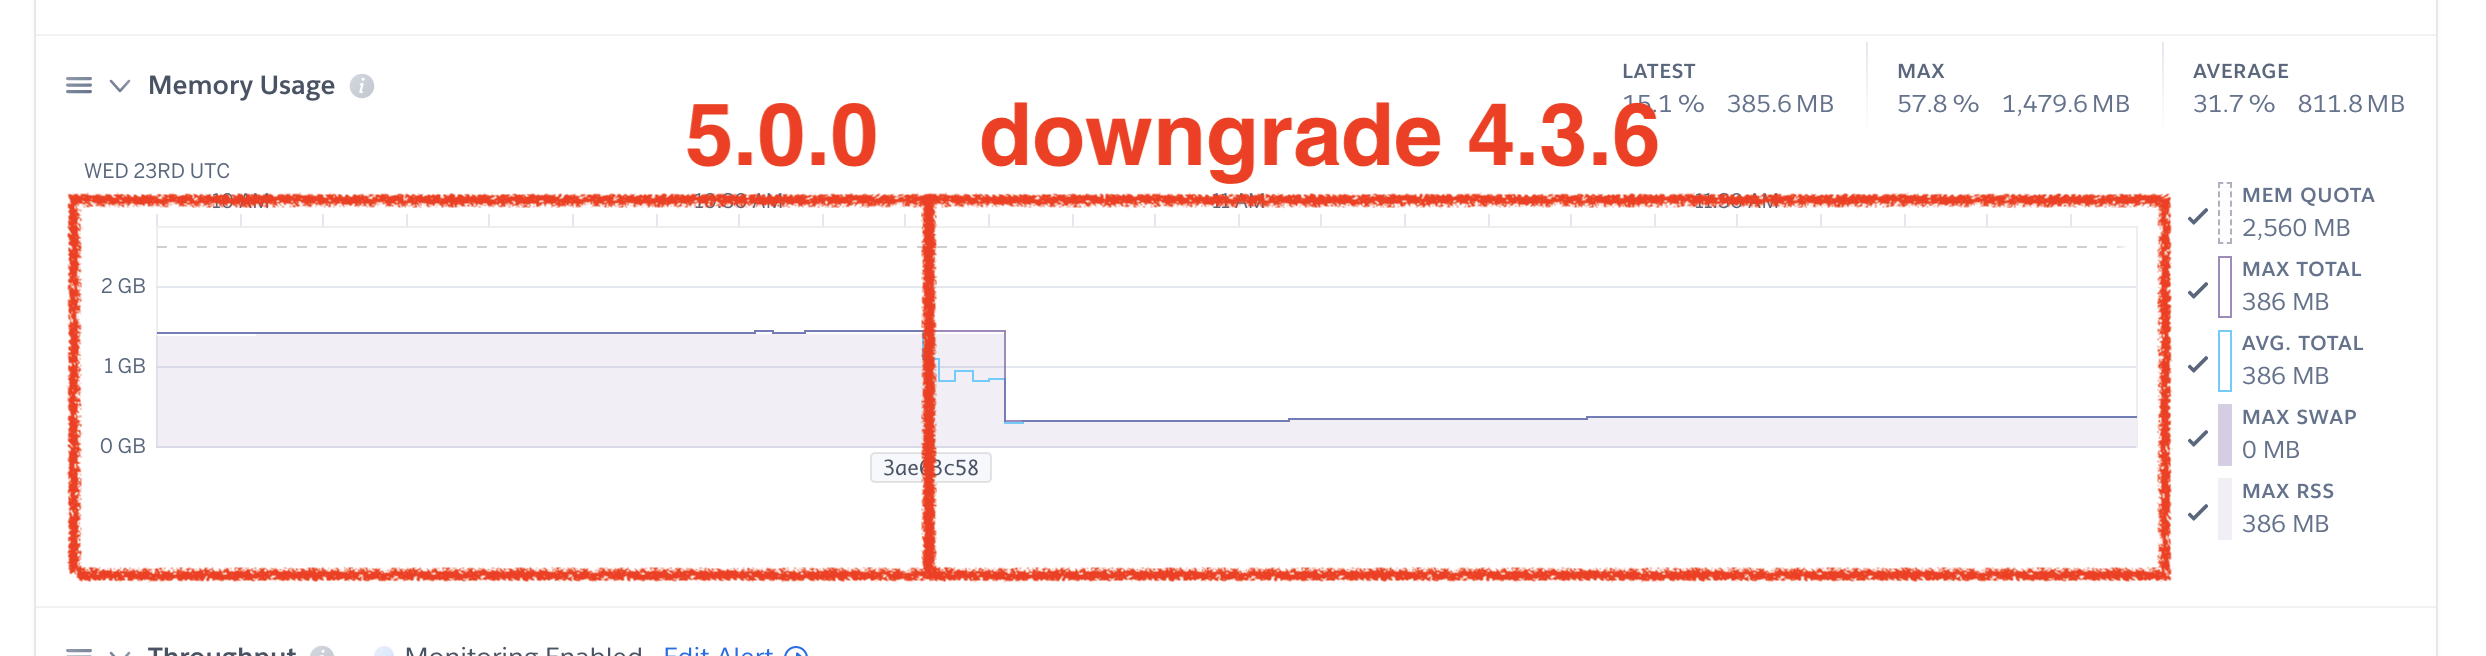
We were using an 1 GB dyno and changed to an 2.5 GB dyno because we weren't able to find the cause of the problem.
When we reverted the gem upgrade everything turned to work right again.
 cesarjr
on 23 Sep 2020
cesarjr
on 23 Sep 2020
I don't know how to reproduce the problem but using Puma 5.0.0, our app is generating the same log error and the memory is increasing too much suddenly.
We were using an 1 GB dyno and changed to an 2.5 GB dyno because we weren't able to find the cause of the problem.
When we reverted the gem upgrade everything turned to work right again.
We're experiencing exactly the same issue. Reverting to 4.3.6 also helped
PetrKaleta
on 23 Sep 2020
If you have a different issue than the connection problem in the OP, please open a new issue. Let's not turn this into a "all 5.0 issues" megathread.
nateberkopec
on 23 Sep 2020
If you have a different issue than the connection problem in the OP, please open a new issue. Let's not turn this into a "all 5.0 issues" megathread.
I'm sorry about that. I'm having the "Puma :: ConnectionError: Connection error detected during read" error and I thought the suddenly increase of memory was related to it. Sorry again.
cesarjr
on 23 Sep 2020
No problem - it is definitely _not_ related though. Open a new issue and we can get to it.
nateberkopec
on 23 Sep 2020
A co-worker recommends checking out a tool called mitmproxy for seeing what exactly wrk is sending. I think this is it https://mitmproxy.org/ I've not had a chance to use it though.
schneems
on 23 Sep 2020
Looks like #959 contains the original reason this was ignored.
nateberkopec
on 24 Sep 2020
I was able to write a failing test that I believe reproduces the initial failure logging mode then I was able to fix it in https://github.com/puma/puma/pull/2384. Please take a look. I mention that one of my rescues is sub-optimal and there might be a way to do it. If someone else is more familiar with client.rb/server.rb and wants to take a look, I would appreciate it. Otherwise I think this will work for the short term.
schneems
on 25 Sep 2020
So my best guess (at the moment) is that wrk initializes a socket and connects with puma before sending over any data, and this raises an EOFError since there's no data yet.
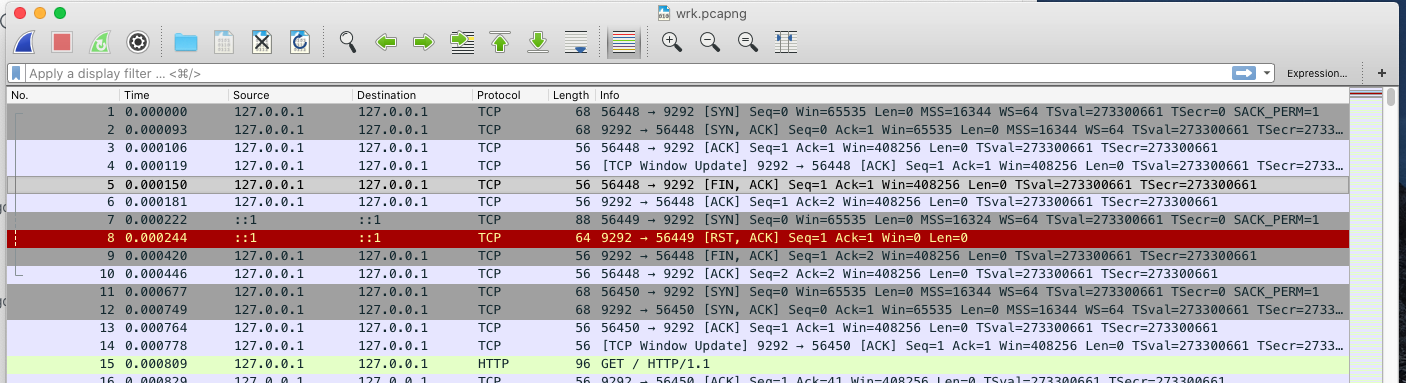
I started a puma server bundle exec ruby -Ilib bin/puma test/rackup/hello.ru and started up wrk wrk -t1 -c1 -d1 http://localhost:9292 while performing a packet capture with Wireshark and the evidence from Wireshark appears to corroborate your guess.
When wrk starts up, it establishes a connection with the puma server normally, but then sends a FIN to the puma server (it starts to tear down the TCP connection) before sending any data. I don't really know why wrk does this quite yet and I'm still looking into it, but figured I should share what I found out so far.
 cjlarose
on 25 Sep 2020
cjlarose
on 25 Sep 2020
Ok this looks like it might be the relevant code in wrk
https://github.com/wg/wrk/blob/0896020a2a28b84b1150e9b60933b746fe1dc761/src/wrk.c#L96-L100
That, I think calls the lua function wrk.resolve, which calls wrk.connect or script_wrk_connect
https://github.com/wg/wrk/blob/7594a95186ebdfa7cb35477a8a811f84e2a31b62/src/wrk.lua#L12-L20
https://github.com/wg/wrk/blob/7594a95186ebdfa7cb35477a8a811f84e2a31b62/src/script.c#L466-L475
I think wrk just creates an initial TCP connection to make sure it can connect the the server before it begins its main testing phase. If that first connection fails, it'll print something out to the console and exit.
I imagine Heroku is doing something similar to make sure your app is up and ready to accept connections, but I haven't come across documentation that makes that explicit. Edit: Heroku tries to ensure that you application binds to the expected $PORT within 60 seconds https://devcenter.heroku.com/articles/error-codes#r10-boot-timeout The error we're seeing might be related to that check.
In short, #2384 seems like the appropriate solution. Puma already correctly detects when a connection is established and immediately closed. Puma also already closes down the connection gracefully from a TCP perspective. This behavior is not really exceptional and users don't need to be notified.
cjlarose
on 25 Sep 2020
Okay - I'll be merging #2384 and releasing a 5.0.1 tomorrow morning.
Good to know this was never really an issue and we just added extra logging in the wrong place. Thanks for the deep dig @cjlarose.
nateberkopec
on 27 Sep 2020
5.0.2 is out with the fix update ur deps!
schneems
on 28 Sep 2020
@cjlarose great investigation! Thanks! I was able to reproduce the behavior in a test by opening a socket, then closing it without writing. I spent about 30 minutes to an hour playing with mitmproxy but couldn't get it to work how I wanted and moved on. That's interesting wireshark output.
schneems
on 28 Sep 2020
Related issues
 kesha-antonov
·
25Comments
kesha-antonov
·
25Comments
 brunowego
·
29Comments
brunowego
·
29Comments
 eregon
·
25Comments
eregon
·
25Comments
 eric-norcross
·
29Comments
eric-norcross
·
29Comments
 gamafranco
·
32Comments
gamafranco
·
32Comments
Most helpful comment
Okay - I'll be merging #2384 and releasing a 5.0.1 tomorrow morning.
Good to know this was never really an issue and we just added extra logging in the wrong place. Thanks for the deep dig @cjlarose.