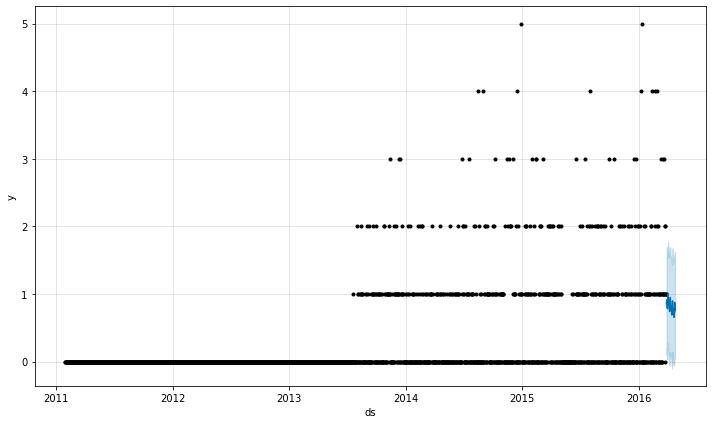
Prophet: Can I adjust the output plot range?
I predicted one month with five years of data, but the predicted area is too narrow to see.
So I want to see only the last 1 year or the last 6 months, not 5 years.
How Can I do so?
 HydonKim
>All comments
If you do
fig = m.plot(fcst)
then fig is a matplotlib fig object and matplotlib gives you complete control over making changes to it. For any change you want to make to a figure, just search for how to do that in matplotlib and you can almost certainly find a SO post about it. In this case, do ax = fig.gca() to get the matplotlib axis object, and then ax.set_xlim([lower, upper]) to change the limit. lower and upper here would be python datetime objects with the dates you want for the lower and upper limits.
 bletham
on 23 Apr 2020
bletham
on 23 Apr 2020
👍3
Was this page helpful?
0 / 5 - 0 ratings
Related issues
 davidjayjackson
·
3Comments
davidjayjackson
·
3Comments
 GretaShi3084
·
3Comments
GretaShi3084
·
3Comments
 rev3ks
·
3Comments
rev3ks
·
3Comments
 Earththing
·
3Comments
Earththing
·
3Comments
 arnaudvl
·
3Comments
arnaudvl
·
3Comments
Most helpful comment
If you do
then
figis a matplotlib fig object and matplotlib gives you complete control over making changes to it. For any change you want to make to a figure, just search for how to do that in matplotlib and you can almost certainly find a SO post about it. In this case, doax = fig.gca()to get the matplotlib axis object, and thenax.set_xlim([lower, upper])to change the limit.lowerandupperhere would be python datetime objects with the dates you want for the lower and upper limits.