Prophet: Period of monthly seasonality and the number of days in each month
Hello-
Thanks a lot for developing Prophet! it is really promising.
Currently I am forecasting the number of calls for the call center of a bank. My data is organized by day. It has weekly seasonality as well as monthly seasonality - as more people will make the calls at the beginning and end of each month (especially the last day and the first day of a month) because they usually receive their bills at that time.
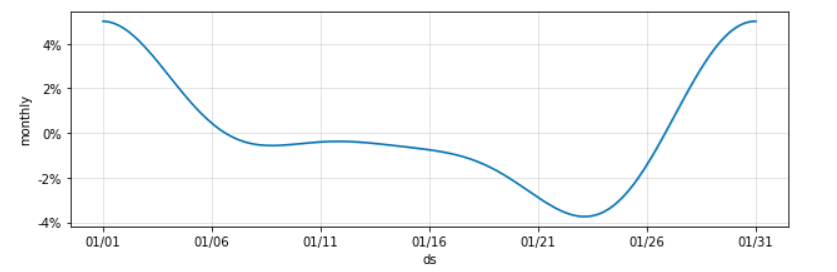
To deal with it, I add monthly seasonality to my model with period = 30.5, fourier_order = 3. The monthly seasonality chart from component plot looks good and is shown as below.
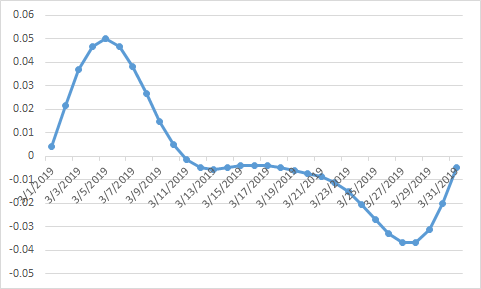
However, i find a problem: since the numbers of days in each month aren't fixed, the monthly seasonality shifts from 1st to 3rd or 4th gradually in the dataset. This situation is extremely serious in Feb. because Feb only has 28 or 29 days, the monthly seasonality of Mar moves forward - the spike doesn't show around 1st, but around 5th as the chart below.
Any idea about how to solve it? I try to change the period of my monthly seasonality to 30 or 30.25, but the seasonality it finds become really weird.
Thank you in advance!
 GretaShi3084
All 3 comments
What does it look like if you add those last/first days of each month as holiday effects instead of seasonal effects?
 benmwhite
on 2 Mar 2020
benmwhite
on 2 Mar 2020
@benmwhite Thank you for your kind reply! I will give it a try and post the result later. Appreciate your help!!
GretaShi3084
on 10 Mar 2020
Adding flags for these begin days and end days works well and it can achieve better performance than using monthly seasonality even for those normal months. It is like adding dummy variable seasonalities.
GretaShi3084
on 4 Apr 2020
Related issues
 annabednarska
·
3Comments
annabednarska
·
3Comments
 ahash52
·
3Comments
ahash52
·
3Comments
 arnaudvl
·
3Comments
arnaudvl
·
3Comments
 germayneng
·
3Comments
germayneng
·
3Comments
 robertdknight
·
3Comments
robertdknight
·
3Comments
Most helpful comment
What does it look like if you add those last/first days of each month as holiday effects instead of seasonal effects?