Prophet: Trend uncertainty with MCMC sampling
Hi,
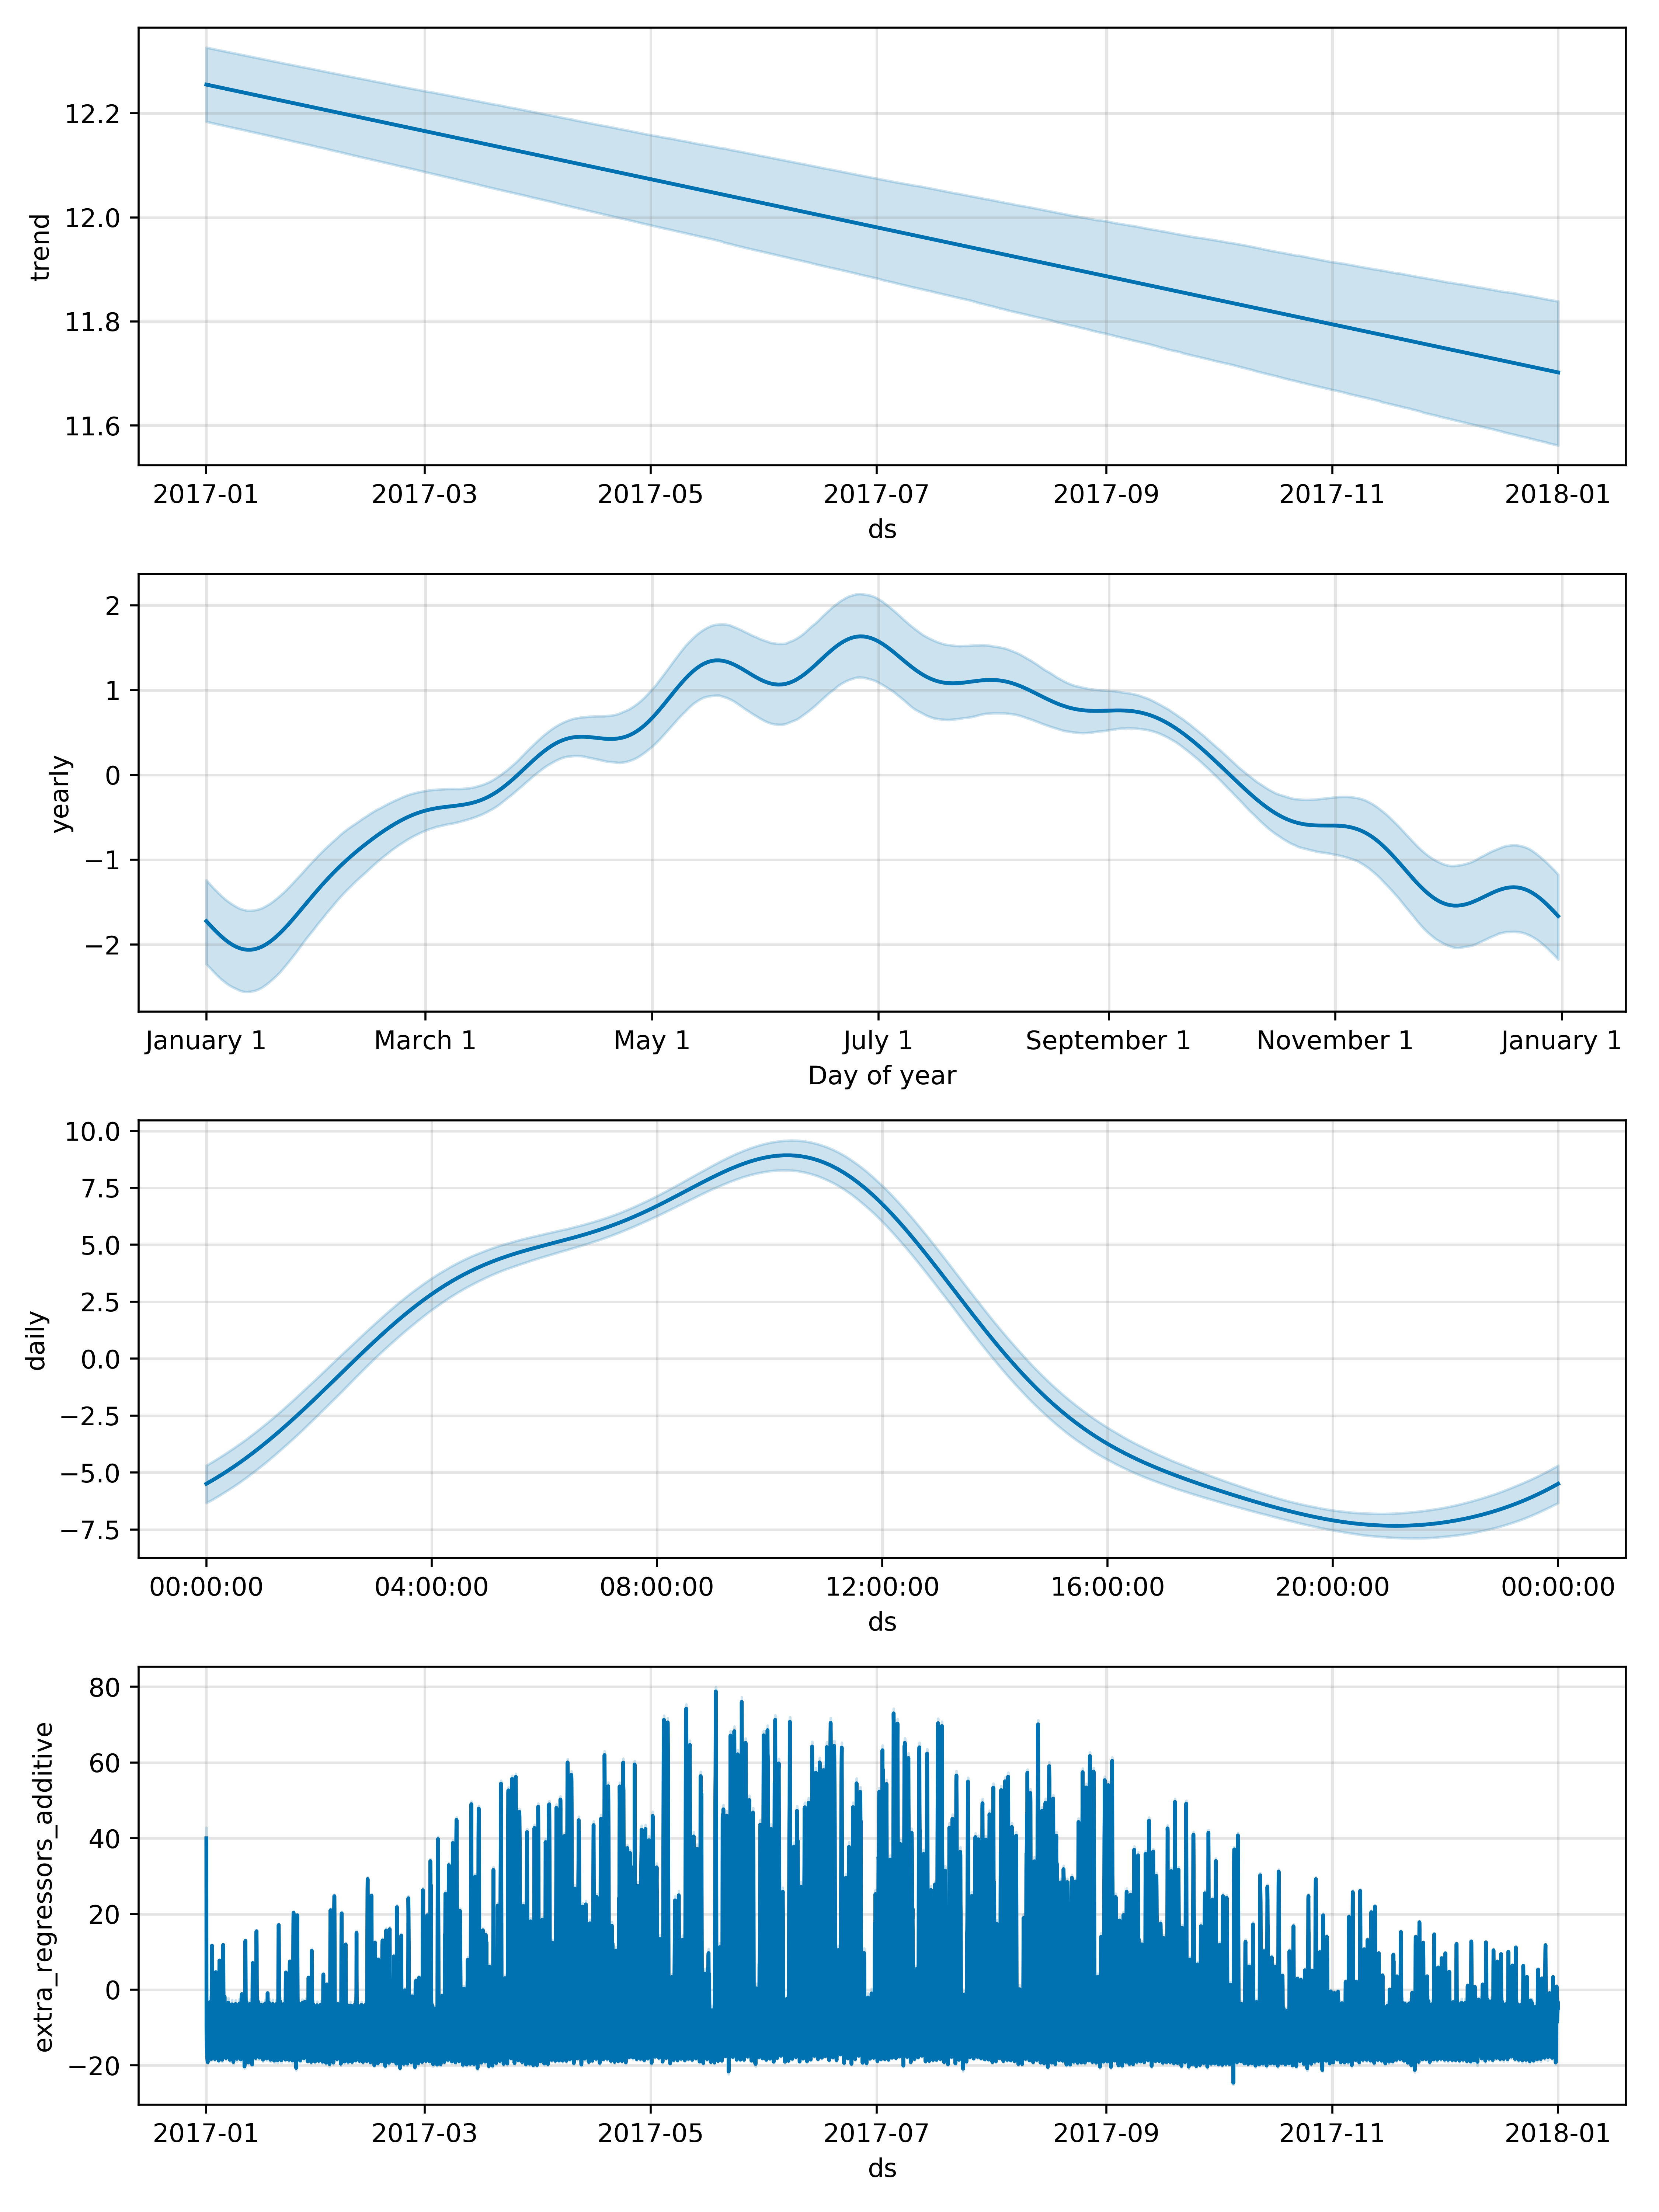
I have a dataset I am trying to model with Prophet, using full MCMC sampling. I really want to extract the values for the linear trend and the uncertainty interval for the trend but I cannot figure out how to do this. Is there any way to get out a table of values that describes the trend plot in the figure below? Also, how are these uncertainty intervals actually calculated when using mcmc sampling?
So far I have tried accessing the trend data using the below code:
m = Prophet(growth='linear', mcmc_samples=1000)
m.fit(train_data)
forecast = m.predict(test_data)

posterior_samples = m.predictive_samples(test_data)
trend_points = posterior_samples['trend']
I have tried looking at trend_points but cannot figure out what data it actually contains. I'm guessing each row is an individual prediction interval, but what do the readings across the columns mean?
If anyone could help me out that would be much appreciated, I am not well versed in the theory of MCMC sampling.
Max
 MaxBirdChemEng
All 5 comments
@MaxBirdChemEng Hi.
There is a detailed explanation that Ben provided here for how MCMC works and how the intervals are calculated.
In short, mcmc_samples is the number of iterations per MCMC chain. By default, Stan does four chains and discards of the first two as warm-up (traditionally known as burn-in). That means, you'll see 2000 columns for each value in your parameters (2 * mcmc_samples). In the case of the trend, the slope k would be the mean of m.params['k'] and the intercept m is the mean of m.params['m']. The delta parameter is in m.params['delta'] and that will be 2000 columns for each of the 25 changepoint (Prophet default). Those are combined with the linear function as explained in a piecewise linear manner as explained by the paper.
The intervals are the quantiles from the distribution of the 2000 samples.
 sammo
on 29 Oct 2019
sammo
on 29 Oct 2019
One additional note is that there is some data transformation that happens before fitting (y is divided by max value, time is mapped to [0, 1]) and the slope in m.params['k'] is the slope in that transformed space. So in practice the easiest way to get the slope is probably to compute it directly from the trend column in the forecast dataframe (output of predict). You can do this with MCMC uncertainty by calling
https://github.com/facebook/prophet/blob/83f66dadfd8f127687aa1d6e88cf153fff963fc7/python/fbprophet/forecaster.py#L1358
which will return posterior samples of the trend; you could compute the slope for each of them to get a distribution of slopes.
 bletham
on 7 Nov 2019
bletham
on 7 Nov 2019
Great thanks both for the response. I want to look at the convergence of the model, by comparing the trace plots for each of the mcmc chains. If, like you said, stan does four chains by default and discards the first half of each chain I then will have 2000 samples total in the predictive samples dataframe. Is it structured such that each chains samples are grouped? E.g. 4 consecutive chunks of 500 samples, all in the one dataframe?
MaxBirdChemEng
on 14 Jul 2020
@MaxBirdChemEng I'm actually not sure, turning that into a list of samples happens in PyStan and looking through their documentation I can't quite figure it out. Draws are extracted here:
https://github.com/facebook/prophet/blob/0d260699e4776c449703a957f08eca8013461a47/python/fbprophet/models.py#L226-L229
If you install the current version on github, then the actual StanFit object will be stored and can be accessed at m.stan_backend.stan_fit. That does allow you to directly access the unmerged / unfiltered chains, like with m.stan_backend.stan_fit.sim['samples'][0]['chains']['k'] for samples of k from chain 0. But I'm not exactly sure in what order samples are merged to get the merged result in m.stan_backend.stan_fit['k'], which is what is stored in m.params['k'].
bletham
on 15 Jul 2020
@bletham Thank you for the speedy response, will try the manual way you mentioned.
MaxBirdChemEng
on 15 Jul 2020
Related issues
 andmib
·
3Comments
andmib
·
3Comments
 sriramkraju
·
3Comments
sriramkraju
·
3Comments
 L471
·
3Comments
L471
·
3Comments
 arnaudvl
·
3Comments
arnaudvl
·
3Comments
 ChaymaeHarfoush
·
3Comments
ChaymaeHarfoush
·
3Comments
Most helpful comment
One additional note is that there is some data transformation that happens before fitting (
yis divided by max value, time is mapped to [0, 1]) and the slope inm.params['k']is the slope in that transformed space. So in practice the easiest way to get the slope is probably to compute it directly from thetrendcolumn in the forecast dataframe (output ofpredict). You can do this with MCMC uncertainty by callinghttps://github.com/facebook/prophet/blob/83f66dadfd8f127687aa1d6e88cf153fff963fc7/python/fbprophet/forecaster.py#L1358
which will return posterior samples of the trend; you could compute the slope for each of them to get a distribution of slopes.