Prophet: Prophet model predicts negative values
I am new to prophet and have some issues with creating a predictive model using python. I am trying to predict daily sales of a product, using around 5 years of data. This is the data I use:
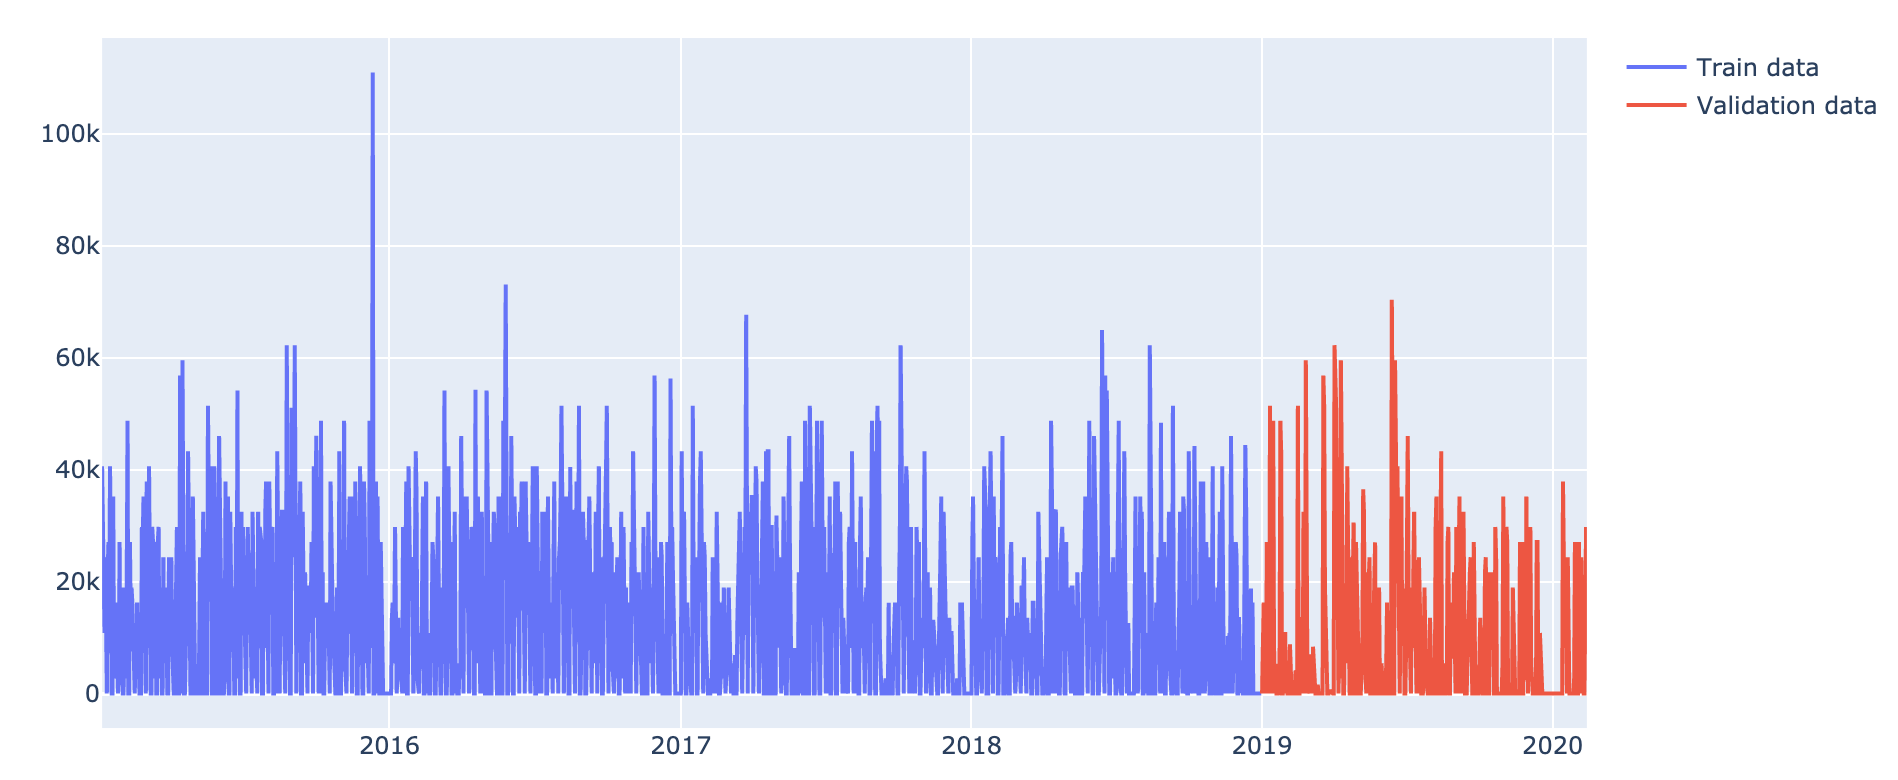
The company is closed in the weekends en during holidays, so there will be no orders. I accounted for this by creating a dataframe with al the weekends/holidays and using this dataframe as an argument for the holidays parameter.
Furthermore I didn't change anything from the model, so it looks like: Prophet(holidays = my weekend/holiday dataframe).
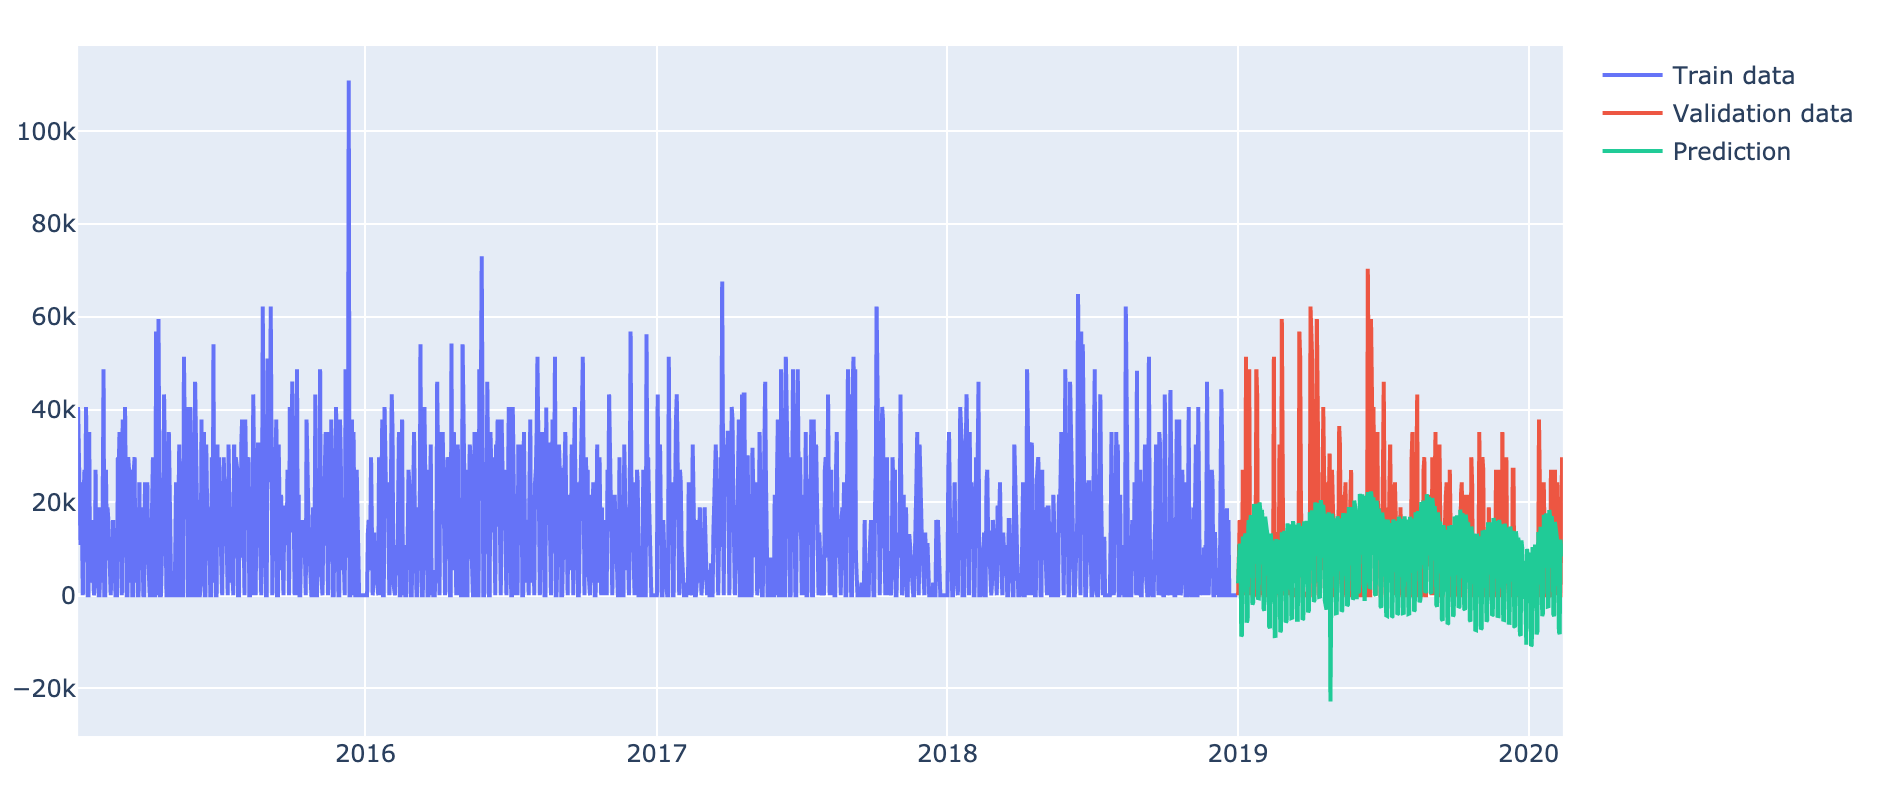
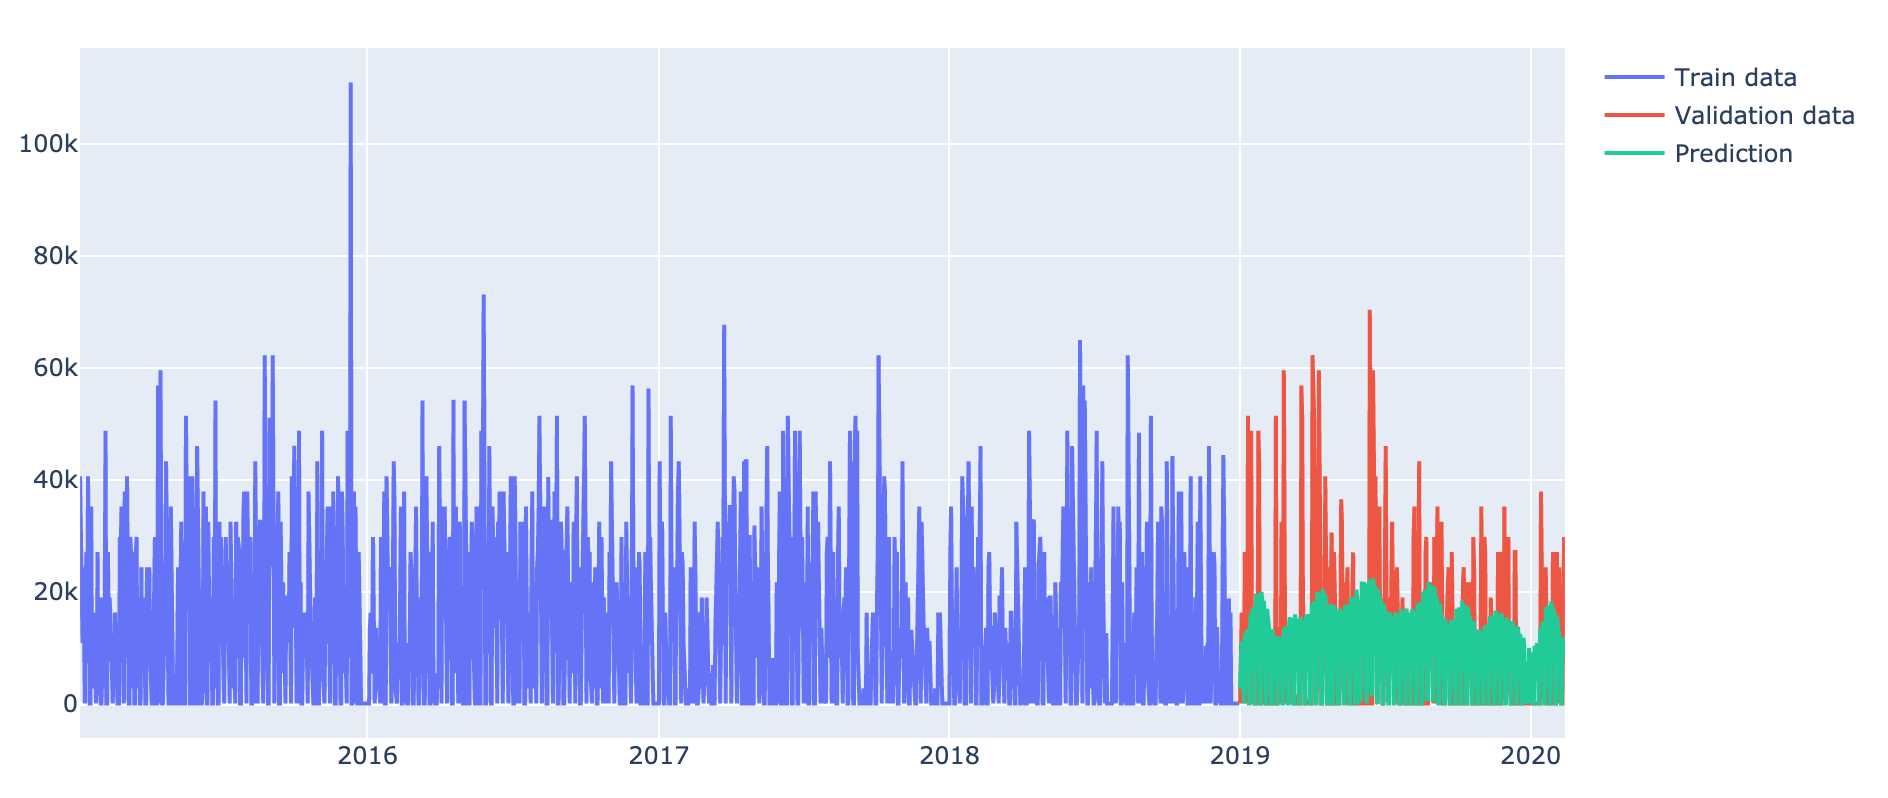
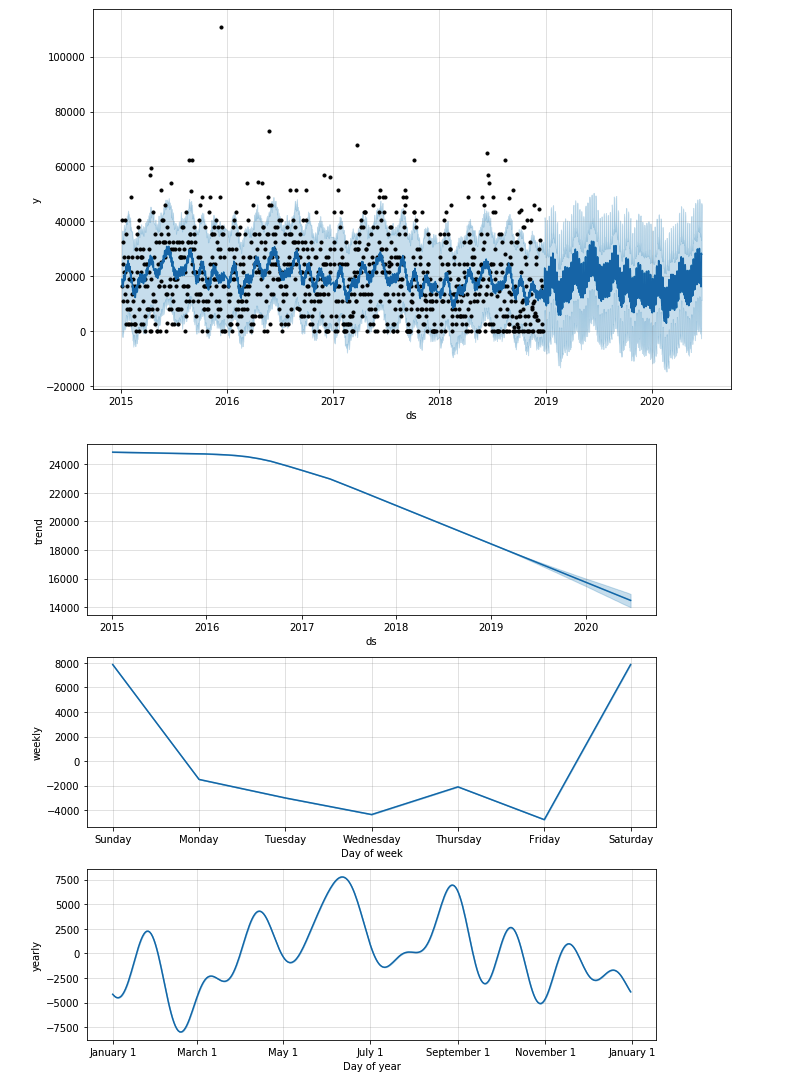
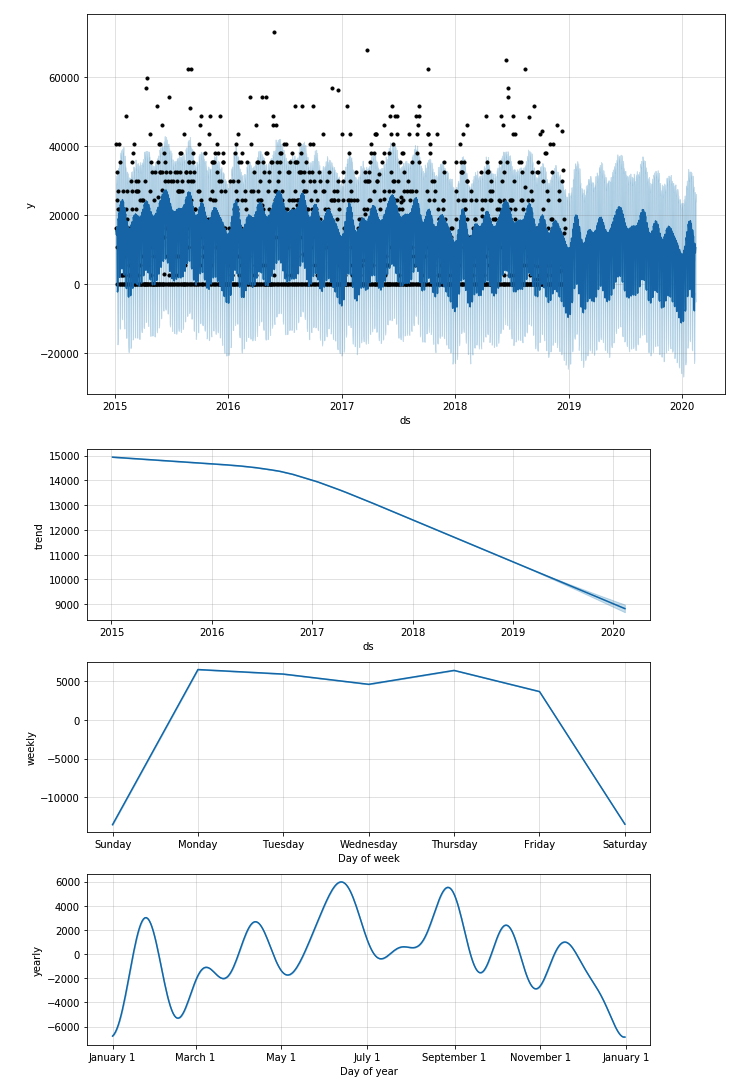
However, my model doens't seem to work right and predicts negative values, see the following plot:
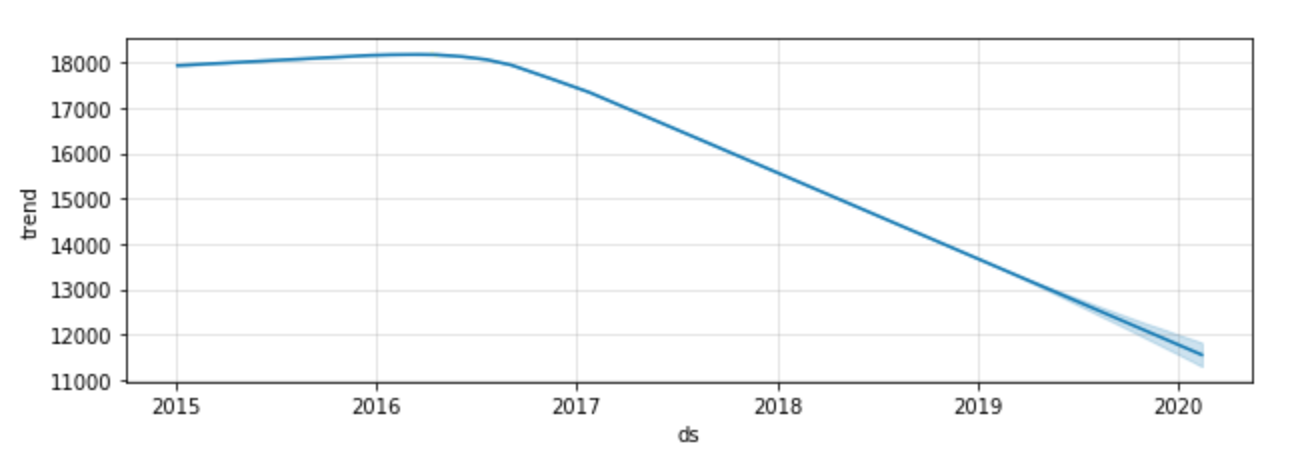
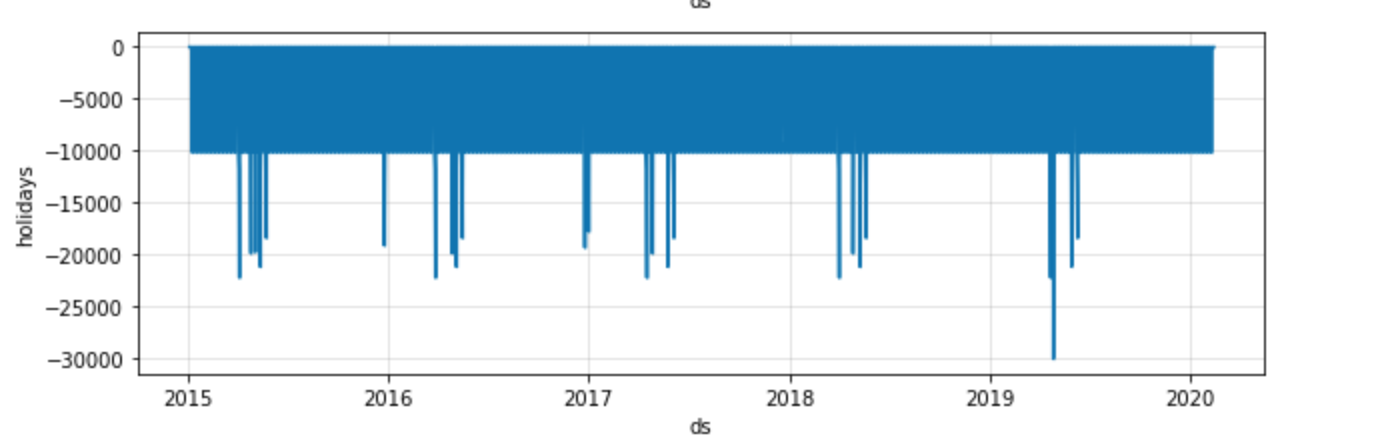
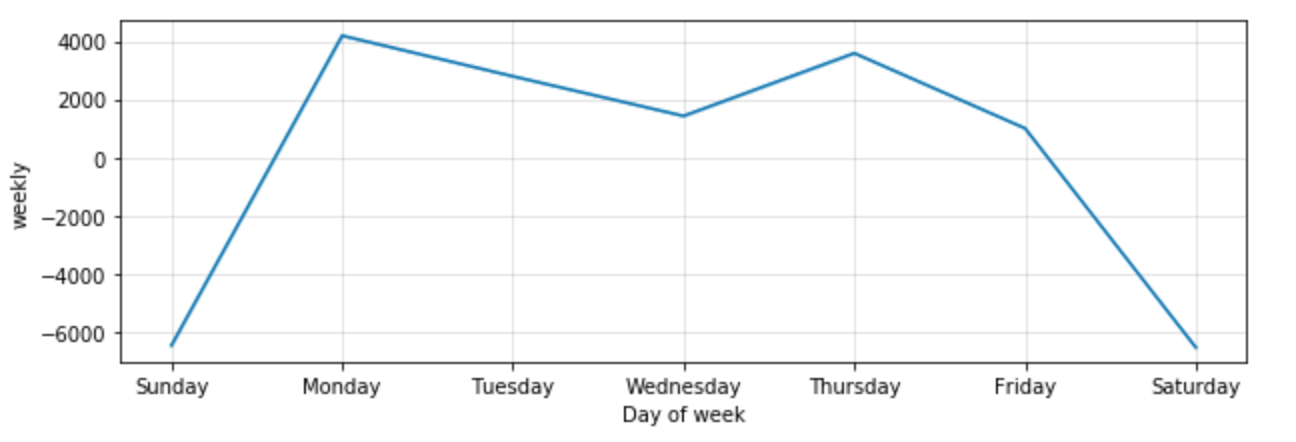
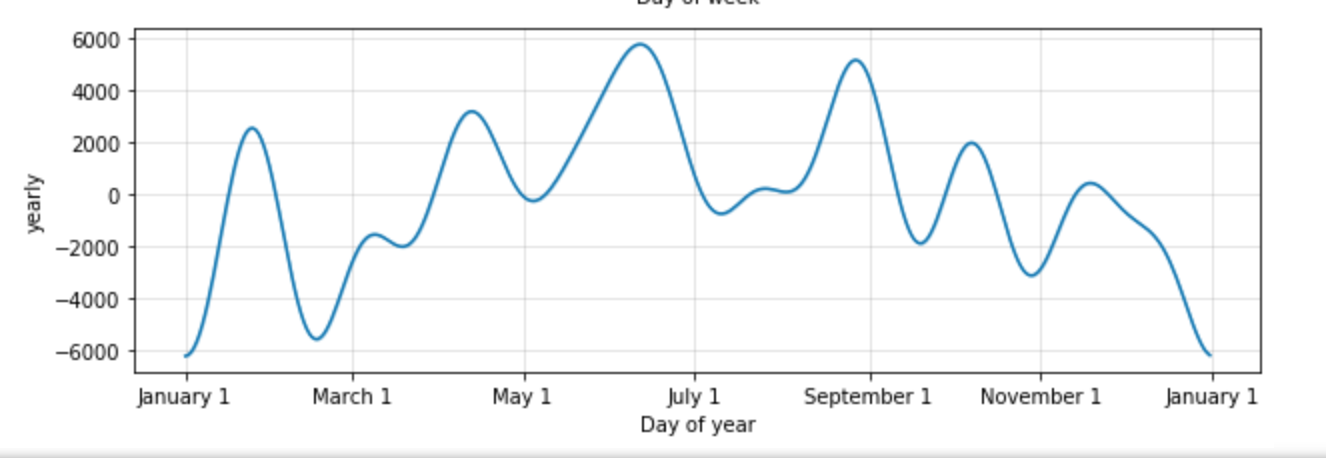
Hereby also the different component plots as extra information:
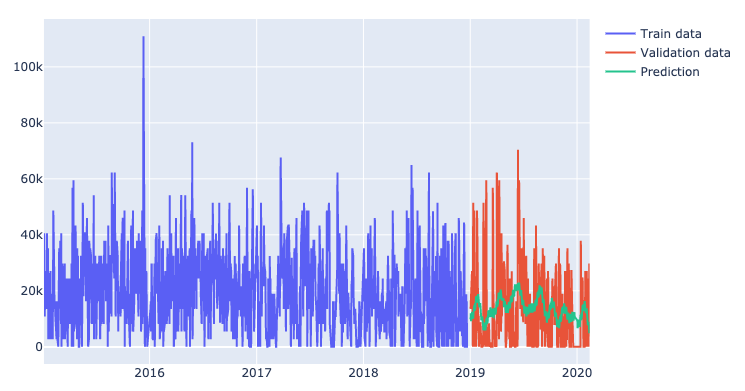
I also tried to just replace the negative values in the prediction by 0, which gives some better results, but I don't think this is the right way to tackle this problem.
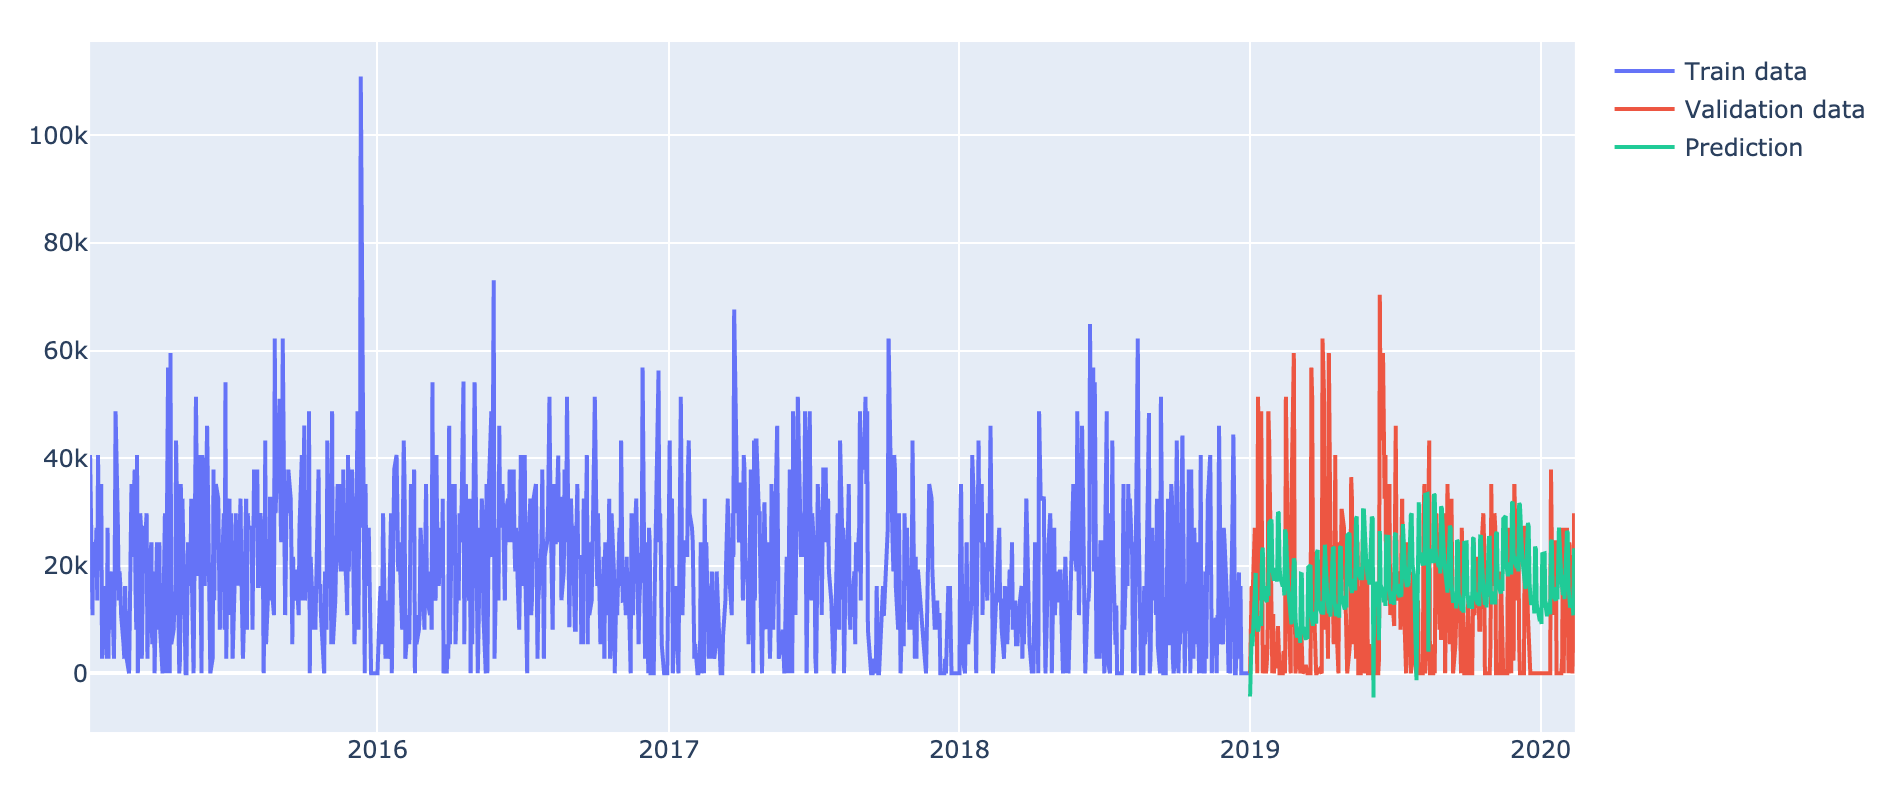
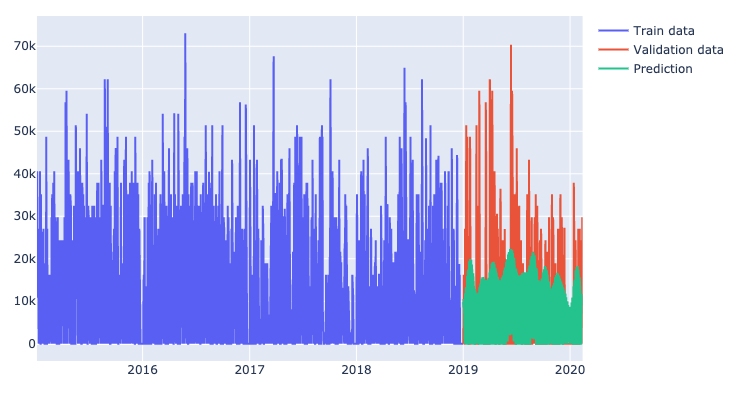
The last thing I tried was to remove all the weekends from the training and predicting data. The results weren't good either:
Some tips are welcome :) If anything is unclear or you need more information, just let me know. Thank you in advance!!
 L471
L471
All 3 comments
I have a few comments:
- There's nothing in the model to require it to be positive, and when you have data close to 0 with seasonal fluctuations it's pretty easy to end up with negative predictions. In this case, the best you can do is clamp your predictions to 0 (as you have done here). I think this is actually a reasonable thing to do; it's along the lines of a censored data problem.
Handling days that are always 0: You note that weekends and holidays will always have y=0 because the company is closed. You look at two ways of handling this: specifying them as holidays, and just removing them from train/predict data. Using holidays is a fairly reasonable approach, but it does have one issue: the holiday effected will be fit to be a constant offset (as you can see in the components plot above, it is about -10000). This means that if over the course of a time series the trend grows from 10k to 20k, then the prediction on the holiday will grow from 0 to 10k. What you want is for it to be 0 all the time. Making it a multiplicative effect can be better (so, the effect would be fitted as -100%) but that's not perfect either since yearly seasonality could still put it a little away from 0. I actually think that if you have values that are known to always be 0, removing them from the data (in both train and predict, as you do) is the better approach. The we will always predict the right value (0), and we won't have to worry about the 0s messing up other quantities in the model, like yearly seasonality. You note that this isn't giving you great results, but I do have another thought below that could potentially improve that. (Note that even after removing these known 0s from the data, you might still have some negative values in the forecast due to values close to 0, in which case clamping to 0 would be appropriate).
It looks like there is a lot of positive skew in the variance for this time series. Prophet assumes Gaussian noise, which is symmetric and thin-tailed and so skewed, heavy-tailed noise (which seems to be a feature here) can bias the forecast in the direction of the skew (which looks like what's happening in the last forecast plot). What you could do in this situation is log transform the data before giving it to Prophet. In particular, you would compute
y_trans = np.log(1 + y), fit the model to y_tilde, and then untransform the forecast withyhat_untrans = np.exp(fcst['yhat']) - 1. This might give a better forecast in this case. Note that you will want to use additive seasonalities/holidays in this case and not multiplicative, since additive+log transform will be equivalent to multiplicative seasonality.
That's what I'd try. If you have other questions if you could post the m.plot() plot that'd be helpful for me to see what the in-sample fit looks like.
 bletham
on 28 Apr 2020
bletham
on 28 Apr 2020
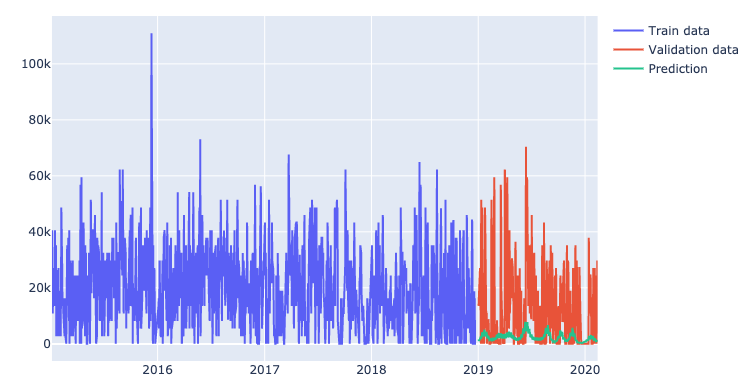
Thank you for your response! I have tried your suggestions, but it doesn't seem to improve...
- Removing all weekends and holidays from the train/predict data. Didn't change anything to the prophet settings:
m = Prophet()
- Removing all weekends and holidays from the train/predict data, log transform the train data ,un-transform the predict data and set
seasonality_mode = 'additive'
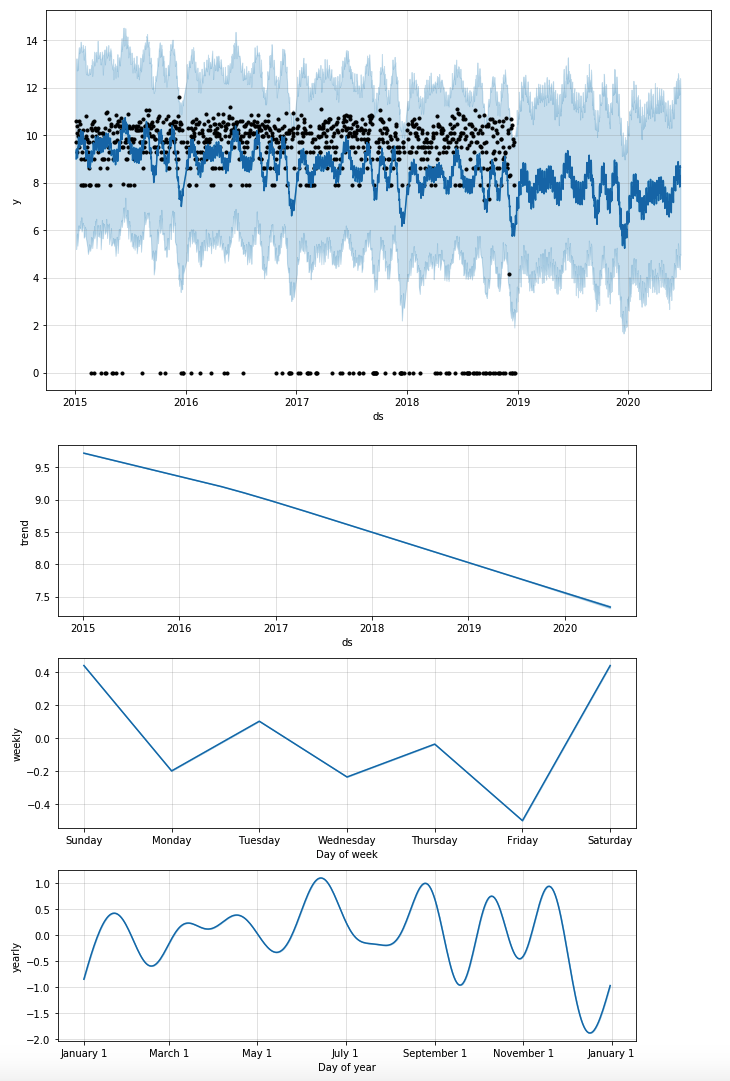
- This is the in-sample fit when I don't transform the data, not remove the holidays and weekends but use them as the holidays parameter
holidays = weekends_holidays()
Are there other things that I could try to do to improve the model? Thank you in advance! :)
L471
on 29 Apr 2020
hm yeah that's definitely worse with a log transform. Seeing the data with the dots rather than the lines there's less skew in the noise than I'd thought. I unfortunately don't have any other ideas. Looking at the top plot, there's no signal that I can see that the model is clearly missing; there just seems to be a lot of variance.
bletham
on 5 May 2020
Related issues
 rev3ks
·
3Comments
rev3ks
·
3Comments
 sriramkraju
·
3Comments
sriramkraju
·
3Comments
 andrew-pollock
·
3Comments
andrew-pollock
·
3Comments
 dsvrsec
·
3Comments
dsvrsec
·
3Comments
 kimhale
·
3Comments
kimhale
·
3Comments
Most helpful comment
I have a few comments:
Handling days that are always 0: You note that weekends and holidays will always have y=0 because the company is closed. You look at two ways of handling this: specifying them as holidays, and just removing them from train/predict data. Using holidays is a fairly reasonable approach, but it does have one issue: the holiday effected will be fit to be a constant offset (as you can see in the components plot above, it is about -10000). This means that if over the course of a time series the trend grows from 10k to 20k, then the prediction on the holiday will grow from 0 to 10k. What you want is for it to be 0 all the time. Making it a multiplicative effect can be better (so, the effect would be fitted as -100%) but that's not perfect either since yearly seasonality could still put it a little away from 0. I actually think that if you have values that are known to always be 0, removing them from the data (in both train and predict, as you do) is the better approach. The we will always predict the right value (0), and we won't have to worry about the 0s messing up other quantities in the model, like yearly seasonality. You note that this isn't giving you great results, but I do have another thought below that could potentially improve that. (Note that even after removing these known 0s from the data, you might still have some negative values in the forecast due to values close to 0, in which case clamping to 0 would be appropriate).
It looks like there is a lot of positive skew in the variance for this time series. Prophet assumes Gaussian noise, which is symmetric and thin-tailed and so skewed, heavy-tailed noise (which seems to be a feature here) can bias the forecast in the direction of the skew (which looks like what's happening in the last forecast plot). What you could do in this situation is log transform the data before giving it to Prophet. In particular, you would compute
y_trans = np.log(1 + y), fit the model to y_tilde, and then untransform the forecast withyhat_untrans = np.exp(fcst['yhat']) - 1. This might give a better forecast in this case. Note that you will want to use additive seasonalities/holidays in this case and not multiplicative, since additive+log transform will be equivalent to multiplicative seasonality.That's what I'd try. If you have other questions if you could post the
m.plot()plot that'd be helpful for me to see what the in-sample fit looks like.