Prophet: Getting very different answers in R and Python
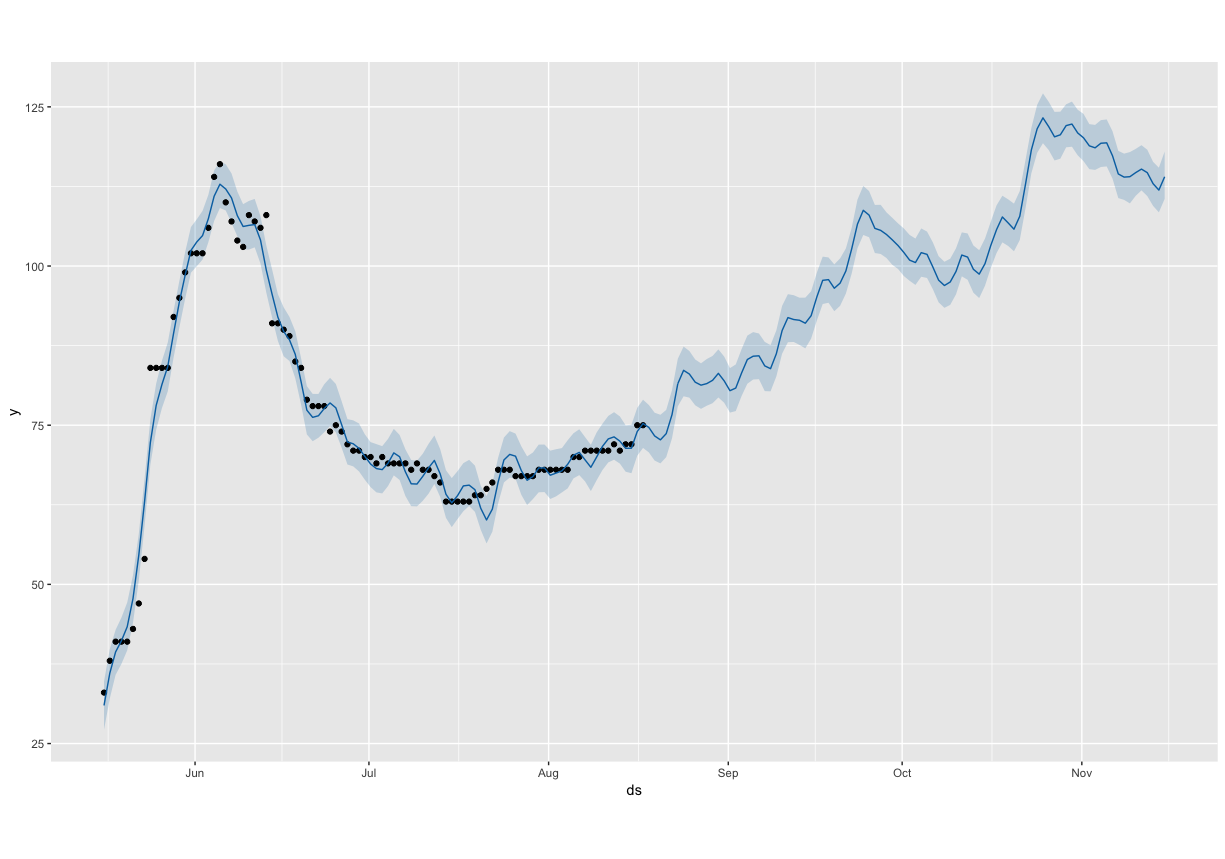
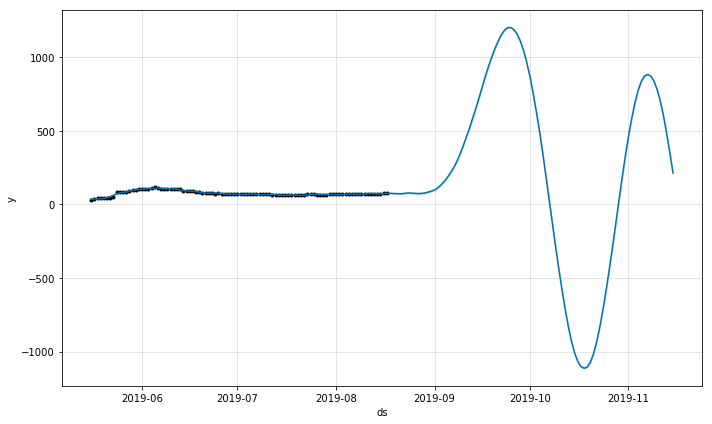
Hi, I’m getting very different results in R and Python for a particular model. The model fit in R appears reasonable, but when I fit the same model in Python, the yearly seasonality goes crazy. See the images attached. Code below with example dataset attached.
R plot
Python plot
R code
mod <- prophet(daily.seasonality = FALSE, yearly.seasonality = TRUE)
mod <- add_country_holidays(mod, country_name = 'US')
mod <- add_seasonality(mod, name='monthly', period=30.5, fourier.order=5)
mod <- fit.prophet(mod, dat)
future <- make_future_dataframe(mod, periods = 90)
forecast <- predict(mod, future)
Python code
model = Prophet(daily_seasonality=False, yearly_seasonality=True)
model.add_seasonality("monthly", period=30.5, fourier_order=5)
model.add_country_holidays(country_name='US')
model.fit(df)
future = model.make_future_dataframe(periods=90)
fcst = model.predict(future)
 kimhale
All 3 comments
Any chance of giving access to the data as well?
 APramov
on 26 Sep 2019
APramov
on 26 Sep 2019
I included the data with the submission above.
kimhale
on 26 Sep 2019
Thanks for the clean repro code! I get the same bad forecast in R and Python. It seems that in R you are using v0.4 of Prophet, whereas in Python it is v0.5. You can check this by:
R:
library(prophet)
sessionInfo()
Py:
import fbprophet
print(fbprophet.__version__)
In this particular time series, there is a difference in the forecast results from v0.4 to v0.5 because of the change described in #1019. In short, for time series with less than 100 datapoints (this one has 94), v0.5 defaults to use the Stan "Newton" optimizer for model fitting, whereas v0.4 uses the Stan "LBFGS" optimizer. This was because the "Newton" optimizer is more robust on small datasets (but slower on large ones, so v0.5 still uses LBFGS if there are >100 points).
You can see that the different optimizer is the source of the difference by changing the Python fitting command to this:
model.fit(df, algorithm='LBFGS')
This produces the same forecast as the R (that is, the same forecast that would be produced under v0.4.
That's what's happening technically, but now for why the forecast is so bad: If you look at the components plot (model.plot_components(fcst)), you'll see that it looks relatively flat from May to September, and then has massive fluctuations outside that range:
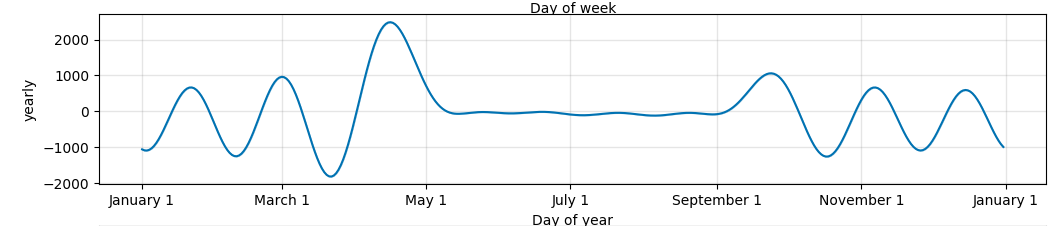
These massive fluctuations are what you're seeing in the forecast. The reason they are happening is because there is only data from May 16 to Aug 17, so the model has no way to know what the yearly seasonality is outside that range. If you ask the model to fit seasonality to a large chunk of time for which there is no data, it can do really bad things [*]. The best thing to do is to not fit yearly seasonality. With only 3 months of data there isn't any possibility of learning yearly seasonality. That is why it is disabled by default. You can also avoid these super extreme values by reducing the seasonality prior scale (e.g. use seasonality_prior_scale=0.1 when initializing the model). The values won't be as crazy, but the forecast will still be bad if yearly seasonality is included because it just has no good way to estimate it.
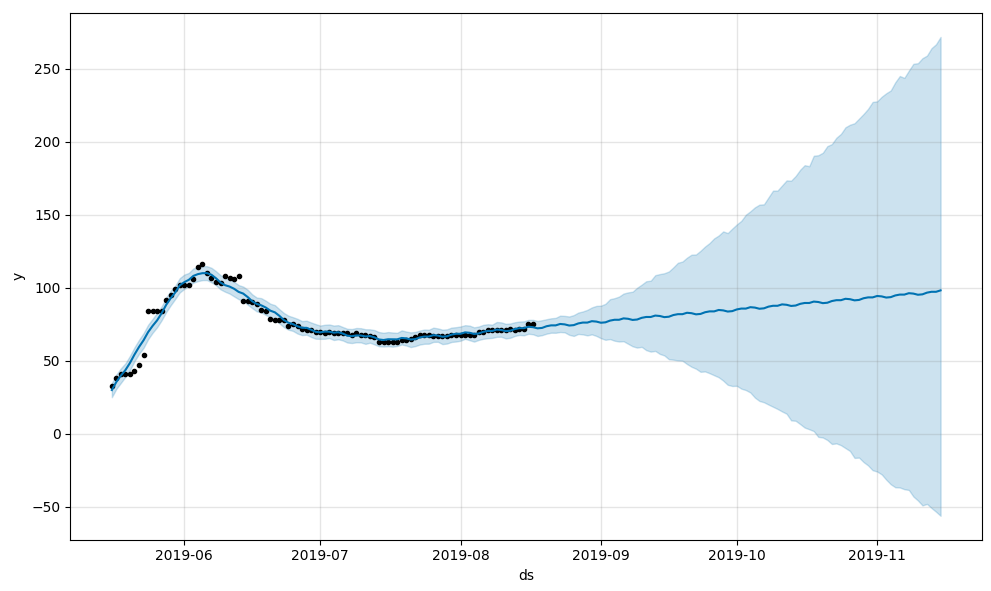
This particular time series is going to be challenging for Prophet because there is no clear seasonality. From looking at the time series it is clear there are no weekly or monthly patterns, so the Prophet model will basically just be a piecewise linear trend. But it also has very sharp trend changes, and so to get good fit you'll have to increase the changepoint prior scale (see documentation here: https://facebook.github.io/prophet/docs/trend_changepoints.html#adjusting-trend-flexibility)
model = Prophet(changepoint_prior_scale = 0.1)
With this model, this is the forecast you get which is about the best you will get from Prophet on this time series:
As a final side note, the reason it is so different between the optimizers is because the yearly seasonality parameters are badly unidentifiable with so much of the year having no data. This means the likelihood surface is very flat, and so different optimizers can terminate at very different points, which is what is happening here.
[*] This is because regularization on the seasonality happens on the Fourier series, which means its regularized in the frequency domain and not the time domain. So seasonality is not regularized to 0 in the time domain in the absence of data.
 bletham
on 29 Sep 2019
bletham
on 29 Sep 2019
Related issues
 pjebs
·
23Comments
pjebs
·
23Comments
 TheLeanAcademic
·
18Comments
TheLeanAcademic
·
18Comments
 laurencezabanal
·
18Comments
laurencezabanal
·
18Comments
 msoedov
·
33Comments
msoedov
·
33Comments
 gkourogiorgas
·
32Comments
gkourogiorgas
·
32Comments
Most helpful comment
Thanks for the clean repro code! I get the same bad forecast in R and Python. It seems that in R you are using v0.4 of Prophet, whereas in Python it is v0.5. You can check this by:
R:
Py:
In this particular time series, there is a difference in the forecast results from v0.4 to v0.5 because of the change described in #1019. In short, for time series with less than 100 datapoints (this one has 94), v0.5 defaults to use the Stan "Newton" optimizer for model fitting, whereas v0.4 uses the Stan "LBFGS" optimizer. This was because the "Newton" optimizer is more robust on small datasets (but slower on large ones, so v0.5 still uses LBFGS if there are >100 points).
You can see that the different optimizer is the source of the difference by changing the Python fitting command to this:
This produces the same forecast as the R (that is, the same forecast that would be produced under v0.4.
That's what's happening technically, but now for why the forecast is so bad: If you look at the components plot (
model.plot_components(fcst)), you'll see that it looks relatively flat from May to September, and then has massive fluctuations outside that range:These massive fluctuations are what you're seeing in the forecast. The reason they are happening is because there is only data from May 16 to Aug 17, so the model has no way to know what the yearly seasonality is outside that range. If you ask the model to fit seasonality to a large chunk of time for which there is no data, it can do really bad things [*]. The best thing to do is to not fit yearly seasonality. With only 3 months of data there isn't any possibility of learning yearly seasonality. That is why it is disabled by default. You can also avoid these super extreme values by reducing the seasonality prior scale (e.g. use
seasonality_prior_scale=0.1when initializing the model). The values won't be as crazy, but the forecast will still be bad if yearly seasonality is included because it just has no good way to estimate it.This particular time series is going to be challenging for Prophet because there is no clear seasonality. From looking at the time series it is clear there are no weekly or monthly patterns, so the Prophet model will basically just be a piecewise linear trend. But it also has very sharp trend changes, and so to get good fit you'll have to increase the changepoint prior scale (see documentation here: https://facebook.github.io/prophet/docs/trend_changepoints.html#adjusting-trend-flexibility)
With this model, this is the forecast you get which is about the best you will get from Prophet on this time series:
As a final side note, the reason it is so different between the optimizers is because the yearly seasonality parameters are badly unidentifiable with so much of the year having no data. This means the likelihood surface is very flat, and so different optimizers can terminate at very different points, which is what is happening here.
[*] This is because regularization on the seasonality happens on the Fourier series, which means its regularized in the frequency domain and not the time domain. So seasonality is not regularized to 0 in the time domain in the absence of data.