Prophet: Question: Can plot_components return values to a dataframe?
Hi,
I am trying to export trend, daily and weekly values to a pandas dataframe. Plot_components gives me this graphs:

Reconstructing trend seems close although not the same:
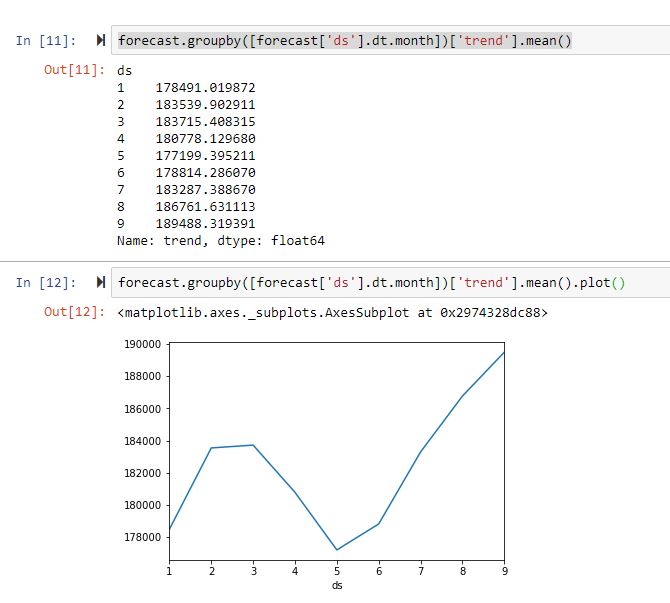
But not so much for daily seasonality:

Question is how can I get the values of seasonal_plots to save to a dataframe without needing to call internal functions?
Thank you
 turkertopal
All 4 comments
plot_components takes everything from the forecast dataframe. If you're using the model in additive mode you can take the components data from forecast["trend"], forecast["weekly"] and 'forecast["daily"]. If you're usingmultiplicative` mode you'll take the trend as is, the weekly and daily components will be a factor of the trend.
 sammo
on 24 Sep 2019
sammo
on 24 Sep 2019
I'm not sure if that is what he is asking for. I have, i think, the same question.
The forecast dataframe has the seasonality values, however, they are not the same as the ones that we see when plotting with model.plot_components. It seems that there is some smoothing that happens before the plot. For example:
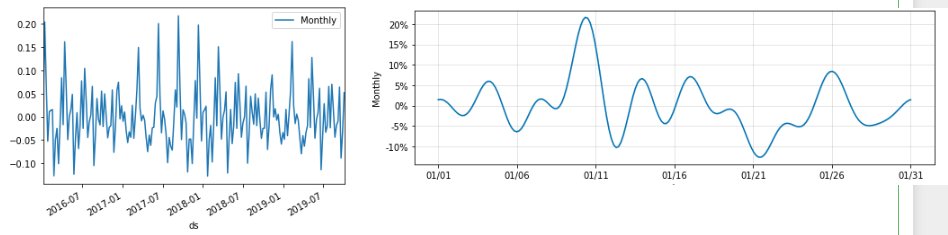
The one on the right is what the plot_components gives for 'Monthly' seasonality, the one on the left is the plot of the actual data inside the forecast dataframe. What i think he needs is a way to get the exact data (with the smoothing, if thats what plot_components is doing, for example) plot_components is using to make that plot. Both the y value and the datetime.
In my case, i want it in order to save this data afterwards, since im gonna be modelling various time series and saving a model for each, when the only thing im interested in is the seasonality components, would be a waste of time and space.
Any help would be great.
 calvelli
on 15 Oct 2019
calvelli
on 15 Oct 2019
What i meant was plot_components has number of internal functions which uses forecast dataframe to create corresponding plots- checks on trends and smoothing and etc. I was looking for a way to return the data itself rather than the figures. Although original plots are nice, I need to push this data to other dashboard tools, so like calvelli says it would be nice to have y value and corresponding datetime returned.
turkertopal
on 15 Oct 2019
Ok, so i went into Prophet's Github and figured out how plot_components works. I then created a simple function to get the date used for the plots. Here it is:
from fbprophet.plot import plot_cross_validation_metric, plot_components, plot_forecast_component, plot_seasonality, plot_weekly, plot_yearly,seasonality_plot_df

def Decomposition(m,name):
    # name = name of the seasonality component you want (yearly,monthly,etc...)
    # m = the model object
    # will return two arrays: one with the datetime values for the plot and one with the actual values
    start = pd.to_datetime('2017-01-01 0000')
    period = m.seasonalities[name]['period']
    end = start + pd.Timedelta(days=period)
    plot_points = 200
    days = pd.to_datetime(np.linspace(start.value, end.value, plot_points))
    df_y = seasonality_plot_df(m, days)
    seas = m.predict_seasonal_components(df_y)

    return(df_y['ds'].dt.to_pydatetime(),seas[name].values)
Hope this helps you.
calvelli
on 16 Oct 2019
Related issues
 andrew-pollock
·
3Comments
andrew-pollock
·
3Comments
 rev3ks
·
3Comments
rev3ks
·
3Comments
 arnaudvl
·
3Comments
arnaudvl
·
3Comments
 annabednarska
·
3Comments
annabednarska
·
3Comments
 maxwell873
·
3Comments
maxwell873
·
3Comments
Most helpful comment
plot_componentstakes everything from theforecastdataframe. If you're using the model inadditivemode you can take the components data fromforecast["trend"],forecast["weekly"]and 'forecast["daily"]. If you're usingmultiplicative` mode you'll take the trend as is, the weekly and daily components will be a factor of the trend.