Prophet: performance_metrics returns a dataframe of unexpected size
I need some help in understanding how performance_metrics works. I went through the help, quick start, and the code, but I think I'm missing something.
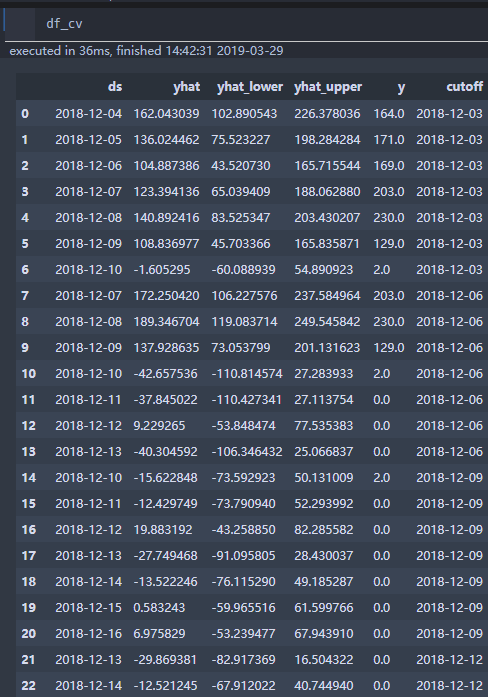
Here's the problem I am facing. When I do a cross validation of my forecast (several weeks of data with 1 hour granularity) with a 72 hours of horizon, I get a dataframe with size, 1564 rows × 6 columns.
Now if I understand correctly, for performance_metrics, rolling_window parameter decides how much of the simulated forecast should be included in a window. Now, when I use rolling_window = 0, I expect the performance_metric to return an output dataframe with exact size of the input dataframe (i.e. 1564 rows × 6 columns). But in reality, I am getting a dataframe of size 11 X 6. When I change the rolling_window to 0.1 or 0.2, the output dataframe size remains the same (11 X 6) . However, when I change rolling_window to 1, the output frame is only 1 row (which I think is correct).
Clearly, I am missing something and I would appreciate your help in understanding this. Also, how does the horizon column in performance_metric is calculated? When I use rolling_window = 1, it shows a horizon of 72 hours. I am not sure how it is calculated based on the cross validation output frame.
Please let me know, if you need any additional information or clarification. Thank you.
 jbanik85
All 10 comments
I agree with your expected size. I'm not exactly sure what is happening here - in the diagnostics documentation notebook (https://github.com/facebook/prophet/blob/master/notebooks/diagnostics.ipynb) when I set rolling_window=0, the resulting dataframe is the same size as the input dataframe. Is there any chance you can post the code/data that produces this?
What performance_metrics is actually doing is a little non-intuitive for regularly spaced data - there is a somewhat long description of it in #839.
 bletham
on 1 Mar 2019
bletham
on 1 Mar 2019
Thank you. I'm going to share the dataset with you shortly. My guess is I'm missing something obvious.
839 is very educational. I spent some time yesterday on that post and it helped me understand better. Thanks to you and the OP for having such a elaborate discussions.
jbanik85
on 1 Mar 2019
Here's the dataset.
testData23.xlsx
One thing I forgot to mention, which you would notice in this data: the data is not uniformly spaced. Space between consecutive data points are very close to an hour, but off by few minutes or seconds. I don't know if that has anything to do with the behavior I'm seeing.
Looking forward to your response.
jbanik85
on 2 Mar 2019
Thanks for posting the data.
When I run it like this with rolling_window=0, the shape is the same size as the CV result as expected:
from fbprophet import Prophet
from fbprophet.diagnostics import cross_validation, performance_metrics
import pandas as pd

df = pd.read_csv('testData23.csv')
m = Prophet().fit(df)

df_cv = cross_validation(m, horizon='72 hours')
print(df_cv.shape)  # (1563, 6)

df_p = performance_metrics(df_cv, metrics=['mse'], rolling_window=0.)
print(df_p.shape)  # (1563, 2)
Did you do something differently?
bletham
on 7 Mar 2019
@bletham Thank you!
I figured out what was causing the difference: instead of df_p = performance_metrics(df_cv, metrics=['mse'], rolling_window=0.), I was using df_p = performance_metrics(df_cv, rolling_window=0.). My expectation was that it would print all the metrics for for all horizons (i.e. 1563). Instead it was printing only one. I don't know yet why it was happening. Please let me know if you can explain.
Before closing this issue, I have couple of relevant questions:
Since this data has lot of 0s, I can't use MAPE. I do see in discussions that MAPE is generally preferred (for being scale free). Now my data is scaled within 0-100 and I am using RMSE. Do you have any comment or suggestion in this regard? Is there any better way to interpret the cross_validation?
Sometimes my data is heavily corrupted by noise. I do not want the model to fit those extreme points. However, because of not reaching those noisy points, when I compute rmse, it often becomes quite large (>20% even). I intend to use rmse for model selection. I don't know how to select a threshold rmse since very high rmse often means that it's just not capturing the noise. Do you have any suggestion?
Thanks again for answering my question, and ofcourse for giving this amazing library!
jbanik85
on 7 Mar 2019
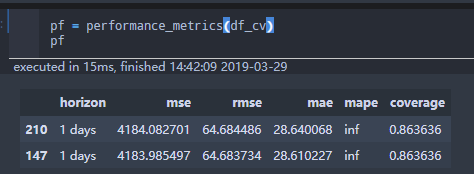
Oh, I see what's happening. When I do that it prints a runtime warning RuntimeWarning: invalid value encountered in subtract. If you then look at df_p, it has only 5 rows like you note:
      horizon         mse       rmse        mae      mape  coverage
216  00:01:00  168.729650  12.989598  12.989598  3.030906       1.0
360  00:01:00   54.767983   7.400539   7.400539  2.405175       1.0
576  00:01:00   95.679602   9.781595   9.781595  2.217162       1.0
1038 00:01:00    0.937137   0.968058   0.968058  0.638919       1.0
1183 00:01:00    1.006608   1.003299   1.003299       inf       1.0
It seems that it is running into a divide-by-zero for MAPE, and that is then killing the whole computation for some reason. If you compute all metrics other than MAPE,
df_p = performance_metrics(df_cv, metrics=['mse', 'rmse', 'mae', 'coverage'], rolling_window=0.)
it works.
We tend to like MAPE because it has a natural interpretability, but it does stop being meaningful if you have data close to 0. RMSE seems like a good alternative to me. As for how to threshold it when you have outliers - if you're able to easily identify the outliers you could remove them from df_cv, otherwise I'm not sure I have a whole lot to suggest.
Computing MAPE on data with 0s should certainly not kill the whole process unexpectedly like this, so I'm going to call this a bug and leave it open until I get it fixed. In the meantime, just specify the list of metrics manually to avoid computing MAPE if data include 0s.
bletham
on 9 Mar 2019
Thanks! Now it makes sense.
For some reason, I completely forgot to inspect the jupyter console output, and focused solely on the notebook output. Otherwise, I would probably noticed it earlier, and it would save me some frustrations.
For thresholding, do you think using log transformation would help to improve the rmse? I'm going to try it anyway. Let me know, if you have any thoughts about. Again, thanks!
jbanik85
on 9 Mar 2019
Yeah, if you have upward skew in the time series then a log transform will probably help a lot.
bletham
on 13 Mar 2019
Same here,
I am forecasting sale count of many products . Some of them may run out of stock, which cause this problem.
In my case,
df_cv = df_cv[df_cv.ds.isin(ts[ts!=0].index)]
pf = performance_metrics(df_cv)
would fix the problem.
Exclude zeros can be a flag in cross_validation function , but there must be some tasks need forecast zero value which may need log(x+1)/box-cox(x+1) .
 eromoe
on 29 Mar 2019
eromoe
on 29 Mar 2019
Pushed to PyPI and CRAN
bletham
on 22 May 2019
Related issues
 rev3ks
·
3Comments
rev3ks
·
3Comments
 andrew-pollock
·
3Comments
andrew-pollock
·
3Comments
 L471
·
3Comments
L471
·
3Comments
 robertdknight
·
3Comments
robertdknight
·
3Comments
 GretaShi3084
·
3Comments
GretaShi3084
·
3Comments