Prophet: The performance of prophet on the data with big varience
Hi
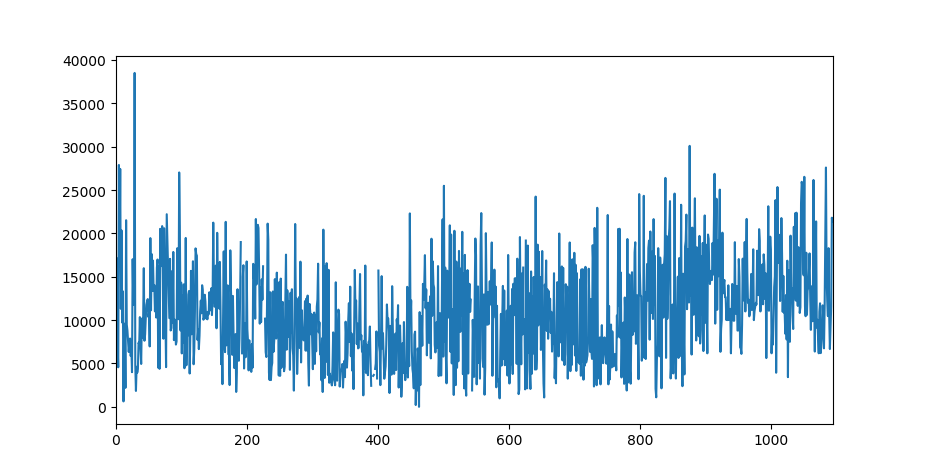
I am dealing with a time series with a high variance. The original data graph is shown below:
I try to fit the data with prophet model and use the cross_validation method to evaluate the performance
of the model.
m = Prophet(changepoint_prior_scale=0.5,)
m.fit(df_input)
# cross validation
df_cv = cross_validation(m, horizon='30 days', initial='730 days')
print(df_cv)
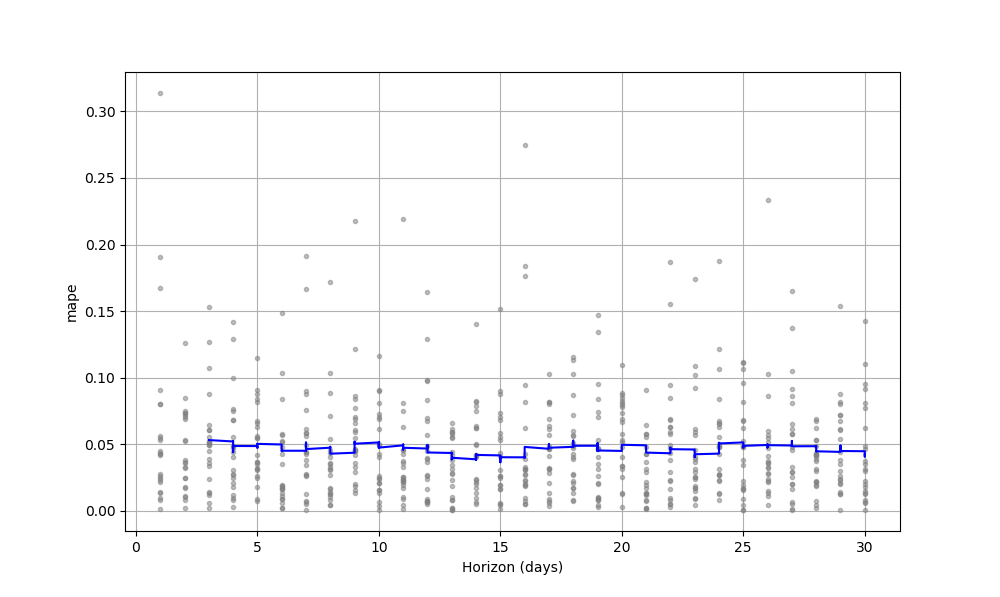
fig = plot_cross_validation_metric(df_cv, metric='mape')
plt.show()
future = m.make_future_dataframe(periods=30)
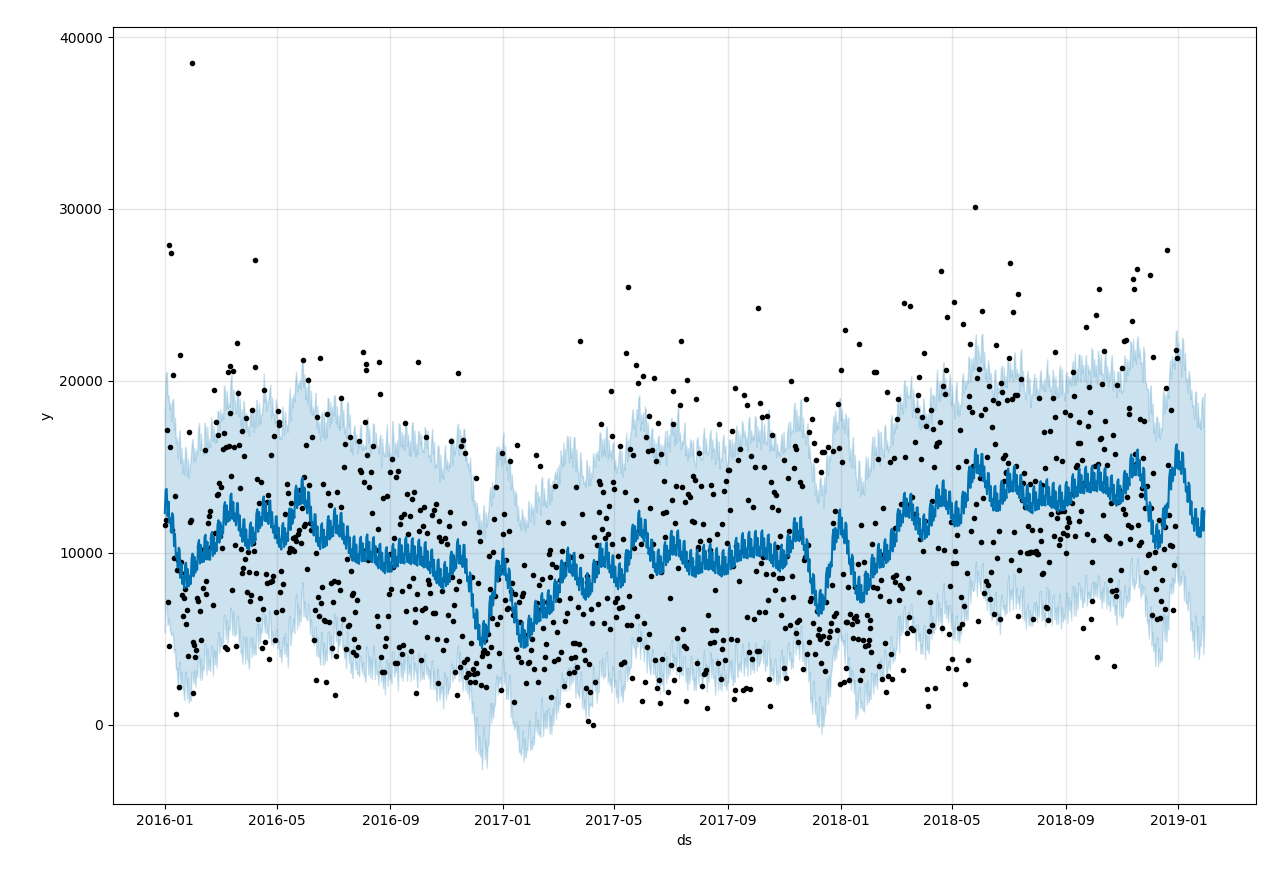
forecast = m.predict(future)
print(forecast)
fig1 = m.plot(forecast,)
The result is not satisfied.
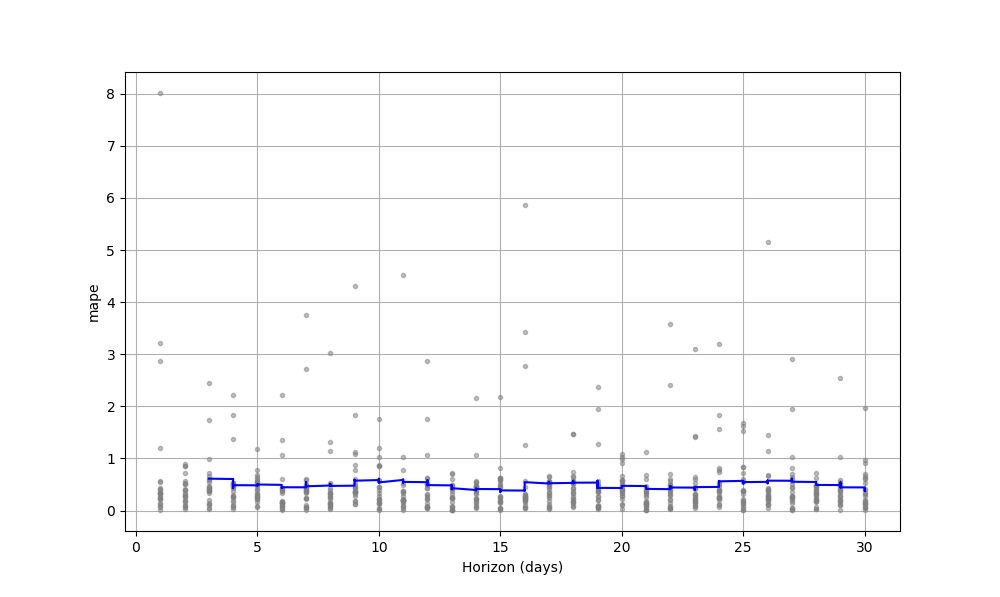
The MAPE error is 50% around. I try to increase the parameter changepoint_prior_scale to make the
model more flexible, but the result of cross_validation doesn't change too much.
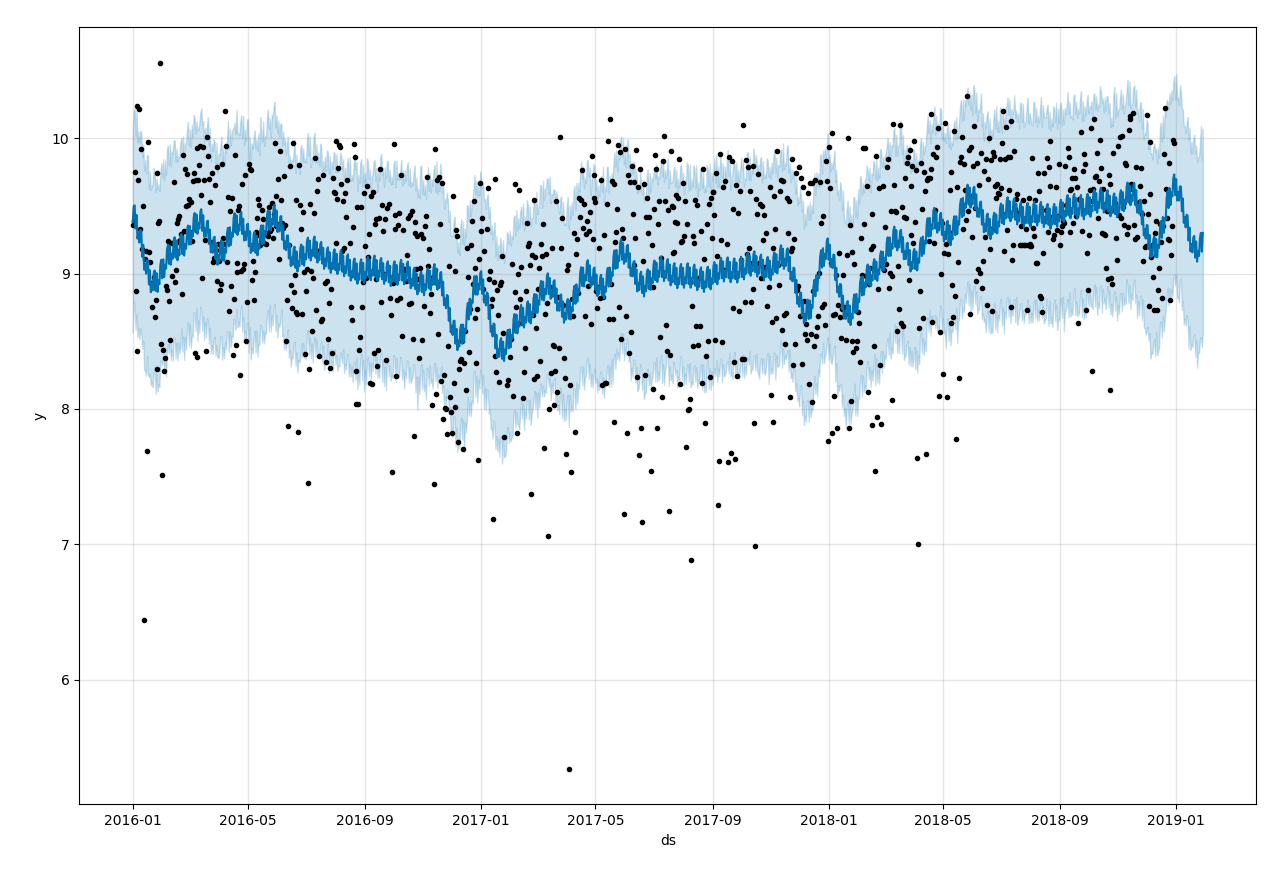
So I transform the data with a ln function to reduce the distance of data points, i find it work well.
# data preprocessing (scaling)
df['steps'] = df['steps'].replace({0:np.nan})
df['steps'] = df['steps'].apply(lambda x: np.log(x))
Is prophet not suitable for the data with a high variance? Is there any suggestions to improve the performance of prophet model for high variance data?
Thanks!
 Q-Qing
All 8 comments
I am facing the same issue. My data has high Variance and it's not giving me good result. I have included Weekend regressors, playoff, superbowl as the extra regressors. Though it can catch the seasonality but it is underfitting.
 surajdidwania
on 25 Feb 2019
surajdidwania
on 25 Feb 2019
This is an interesting question.
At this point, the dataset I have been working with shows a similar trait (i.e. high variance). I am looking forward to an expert opinion on this matter. However, I have a layman_ish_ intuition: when the dataset in question shows high variance, it's difficult for any forecast models to predict. As a result, poor forecast is kind of expected. Unless the oscillation of data points follow a certain pattern, I don't know how any model can forecast with high confidence. Since I am new to this, I am willing to know if there exists such a way.
You have already adopted the only suggestion I could give you: pre-transform the data. Looks like log improves accuracy. Don't know if it's going to be better, but you can also try with box-cox transformation to compare the performance.
 jbanik85
on 26 Feb 2019
jbanik85
on 26 Feb 2019
On top of @jbanik85 suggestion to use box-cox (you gotta find the best esp for the power transform), you can also try to differentiate the time series before fitting and/or apply a moving average/moving median to smooth the thing out
 whitehatty
on 28 Feb 2019
whitehatty
on 28 Feb 2019
@Q-Qing in this case it looks like the noise distribution has a lot of upward skew. Prophet uses a normal noise model. When you take a log transform, this significantly reduces the skew in the transformed space, and so the normal noise model becomes a lot more appropriate and the model fit is a lot better.
To be clear, this is about the distribution of the noise and not the level of the noise per-se: If the noise were actually normal and did not have skew, then you wouldn't need the log transform regardless of the magnitude of the variance.
More generally, the Prophet model has
y(t) = trend(t) + regressors(t) + noise
where regressors include seasonality or other regressors that have been added. Trend is fit from the data. You the user must specify which regressors to use (i.e., which seasonalities, or adding extra regressors) and then the effect sizes for those regressors are fit from the data. Trend and regressors are the only things that are useful for prediction - the noise term implies variance in y(t) that is not modeled as a function of t and so will just be present as constant error in the forecast.
If the variance is high, then probably a lot of it will be captured by the noise term. That is the case here (the shaded band). The "errors" that you see in the past data points you will expect to see in the future ones too.
The only way to do better is to give the model some way to know that the variance in those points is not just random noise, but rather is due to some external factor that you know of. You do this by including that external factor as an extra regressor. For instance, if you choose any point near the top of the shaded band and any point near the bottom of the shaded band, the factor that is the source of the difference between those points needs to be included as an extra regressor.
 bletham
on 1 Mar 2019
bletham
on 1 Mar 2019
Thanks @bletham
I am also dealing with a dataset with similar traits, and your explanation helped me a lot to understand it better.
jbanik85
on 1 Mar 2019
@bletham Thank you for your explanation!
The performance of prophet is unsatisfied in this dataset because the distribution of the noise isn't like a normal distribution. Taking a log transformation modifies the noise to be more normally distributed and it make the model fit better.
This is my understanding about your explanation. If it is right, I have an idea about how to improve the performance of the model.
The distribution of noise after a log transformation approximates a normal distribution, then the distribution of raw noise maybe approximates a log-normal distribution. So I think if I set the noise item in the model is a log-normal distribution, the performance may be better.
Because I know less about the statistics, I'm not sure can this method work. So I want to know what is your thought about this idea.
Thanks!
(PS: I had added additional regressor into the model. It did reduce the mape error of cross_validation by
two or three percent. I think additional regressor is useful because it provide more information about the data but it need tricks to find and quantize it)
Q-Qing
on 2 Mar 2019
Yeah, adding log-normal noise instead of normal noise would be more appropriate here. That sort of adjustment is not very easy to make right now because the noise model is specified in both the Stan and R/Py code. We're working right now on a refactor to put all of that in the Stan that will make it easier to tweak aspects like this of the model and try it out.
bletham
on 7 Mar 2019
Hello, has a way to choose the noise scheme been implemented since this conversation happened?
 rodrigo103
on 24 Apr 2020
rodrigo103
on 24 Apr 2020
Related issues
 datafool
·
3Comments
datafool
·
3Comments
 GretaShi3084
·
3Comments
GretaShi3084
·
3Comments
 dsvrsec
·
3Comments
dsvrsec
·
3Comments
 ahash52
·
3Comments
ahash52
·
3Comments
 kimhale
·
3Comments
kimhale
·
3Comments
Most helpful comment
@Q-Qing in this case it looks like the noise distribution has a lot of upward skew. Prophet uses a normal noise model. When you take a log transform, this significantly reduces the skew in the transformed space, and so the normal noise model becomes a lot more appropriate and the model fit is a lot better.
To be clear, this is about the distribution of the noise and not the level of the noise per-se: If the noise were actually normal and did not have skew, then you wouldn't need the log transform regardless of the magnitude of the variance.
More generally, the Prophet model has
where regressors include seasonality or other regressors that have been added. Trend is fit from the data. You the user must specify which regressors to use (i.e., which seasonalities, or adding extra regressors) and then the effect sizes for those regressors are fit from the data. Trend and regressors are the only things that are useful for prediction - the noise term implies variance in
y(t)that is not modeled as a function of t and so will just be present as constant error in the forecast.If the variance is high, then probably a lot of it will be captured by the noise term. That is the case here (the shaded band). The "errors" that you see in the past data points you will expect to see in the future ones too.
The only way to do better is to give the model some way to know that the variance in those points is not just random noise, but rather is due to some external factor that you know of. You do this by including that external factor as an extra regressor. For instance, if you choose any point near the top of the shaded band and any point near the bottom of the shaded band, the factor that is the source of the difference between those points needs to be included as an extra regressor.