Prophet: How to deal with a large drop in a time series
Hi All,
I am struggling to get a good fit to a time series that has a large drop in the trend - due to a change in the way the values were recorded.
BASE model
With the base model code in R for daily volumes I get this ->
m <- prophet(daily.seasonality = FALSE, weekly.seasonality=TRUE, holidays=holidays_events, holidays.prior.scale = 0.05)
m <- add_seasonality(m, name='monthly', period=30.5, fourier.order=20)
m <- fit.prophet(m, df)
future <- make_future_dataframe(m, periods = 330, freq ="day" )
forecast <- predict(m, future)
plot(m, forecast)
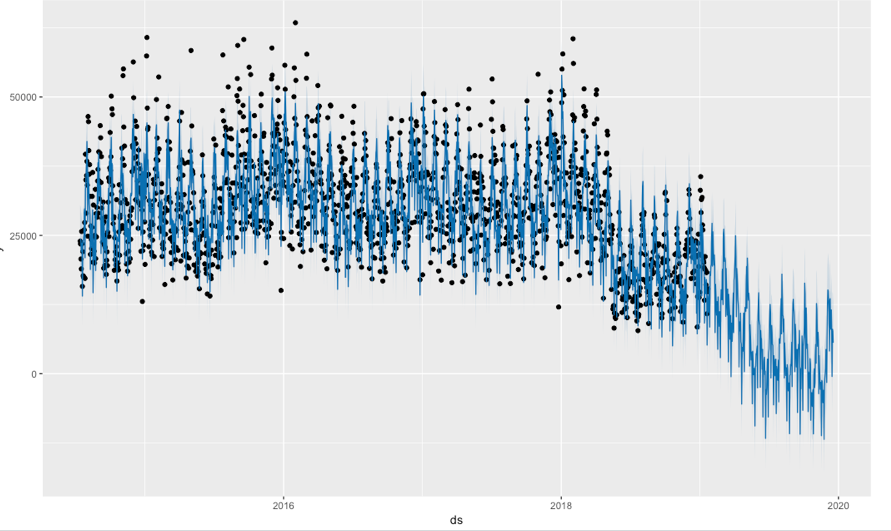
Which is clearly incorrect.
The change occurred around May 2018 - and the values should be consistently lower but in a similar pattern.
Manual change point
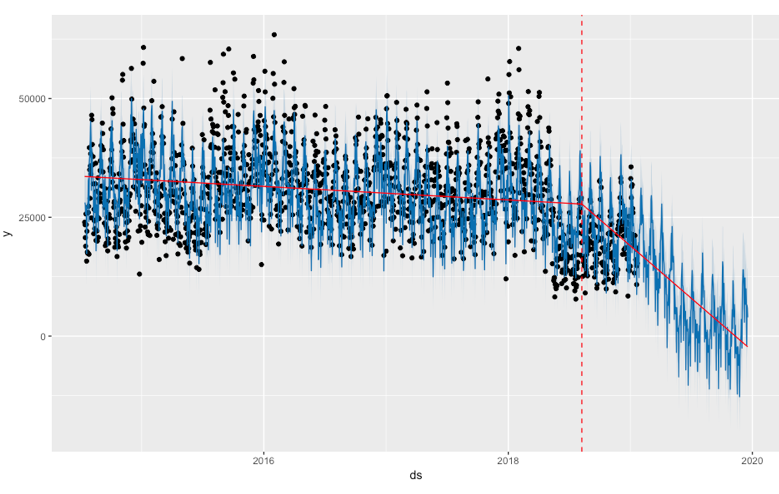
If i input a change point manually and play around with the change point scale I get something like this
pattern_change <- c(as.Date("10/05/2018", format ="%d/%m/%Y"))
m <- prophet(daily.seasonality = FALSE, weekly.seasonality=TRUE, changepoints = pattern_change, changepoint.prior.scale = 0.005, holidays=holidays_events, holidays.prior.scale = 0.05)
m <- add_seasonality(m, name='monthly', period=30.5, fourier.order=20)
m <- fit.prophet(m, df)
future <- make_future_dataframe(m, periods = 330, freq ="day" )
forecast <- predict(m, future)
plot(m, forecast)
It's better but is still overestimating the current values.
Auto change point
m <- prophet(daily.seasonality = FALSE, weekly.seasonality=TRUE, n.changepoints = 1, changepoint.range = 0.9, changepoint.prior.scale = 0.02)
Regressor
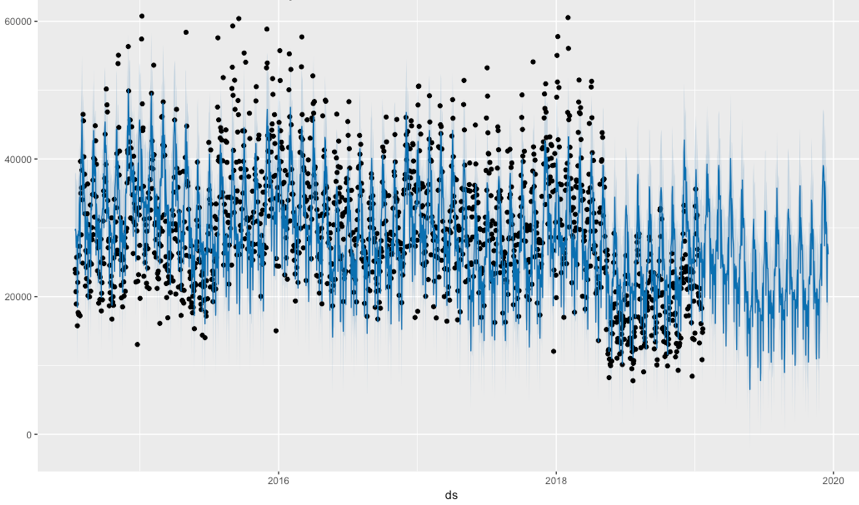
I thought I had found the answer with adding a regressor with the value of 0 before the date and 1 after the date
df_regressor <- df %>% mutate(tipping = case_when(call_data_daily$ds < as.Date("10/05/2018", format ="%d/%m/%Y") ~ 0, ds >= as.Date("10/05/2018", format ="%d/%m/%Y") ~ 1))
df <- df_regressor
m <- prophet(daily.seasonality = FALSE, weekly.seasonality=TRUE, holidays=holidays_events, holidays.prior.scale = 0.05)
m <- add_regressor(m, "tipping") #, prior.scale= 1)
m <- add_seasonality(m, name='monthly', period=30.5, fourier.order=20)
m <- fit.prophet(m, df)
future <- make_future_dataframe(m, periods = 330, freq ="day" ) %>% mutate(tipping=1)
forecast <- predict(m, future)
plot(m, forecast)
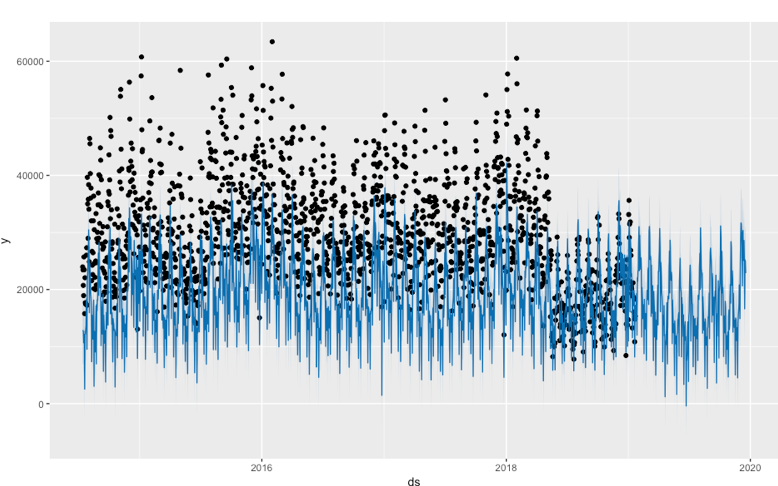
Boo! I tried playing around with the regressor mode, and prior.scale but no luck.
Help please before I bang my head against the wall.
THANKS!
 TarynLeeMorris
All 2 comments
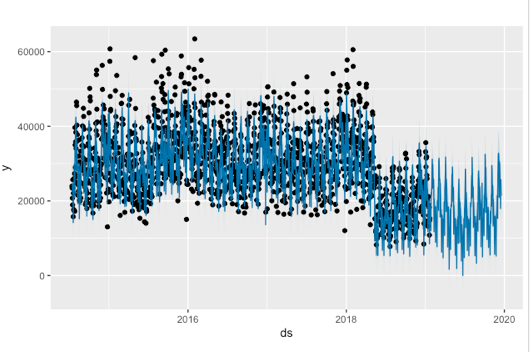
It sounds like since this is a change in data recording, the extra regressor approach that you proposed is the right thing to do. The reason it looks so bad is because of this:
future <- make_future_dataframe(m, periods = 330, freq ="day" ) %>% mutate(tipping=1)
make_future_dataframe will by default include the 330 future days requested, as well as every date in the history. If you look at future, you will see that it has both the history and future dates, but tipping is being set to 1 for all of them. So what it is actually producing and thus plotting is a forecast of what the past would have been had tipping=1 for all of the past dates. If you apply to future the same function for computing tipping that you applied to df, then I expect that it is actually working.
As a side note, you'll definitely want multiplicative seasonality for this time series based on how the magnitude of seasonal effects drops in post-adjustment phase.
 bletham
on 1 Feb 2019
bletham
on 1 Feb 2019
Have I told you lately that I love you! (Van Morrison ~ 1981).
THANK YOU!!!!!!!!!!!!!!
Now that you say it. It seems fairly obvious. I didnt look at setting up the future data frame properly. I just focused on setting up the model.
A few more tweaks on some prior scales and I am A Away!
Thanks a million again!
TarynLeeMorris
on 2 Feb 2019
Related issues
 robertdknight
·
3Comments
robertdknight
·
3Comments
 ChaymaeHarfoush
·
3Comments
ChaymaeHarfoush
·
3Comments
 dsvrsec
·
3Comments
dsvrsec
·
3Comments
 germayneng
·
3Comments
germayneng
·
3Comments
 rev3ks
·
3Comments
rev3ks
·
3Comments
Most helpful comment
Have I told you lately that I love you! (Van Morrison ~ 1981).
THANK YOU!!!!!!!!!!!!!!
Now that you say it. It seems fairly obvious. I didnt look at setting up the future data frame properly. I just focused on setting up the model.
A few more tweaks on some prior scales and I am A Away!
Thanks a million again!