Prophet: Automatic changepoint detection, then add some custom changepoint.
This chart's data is produced by prophet.
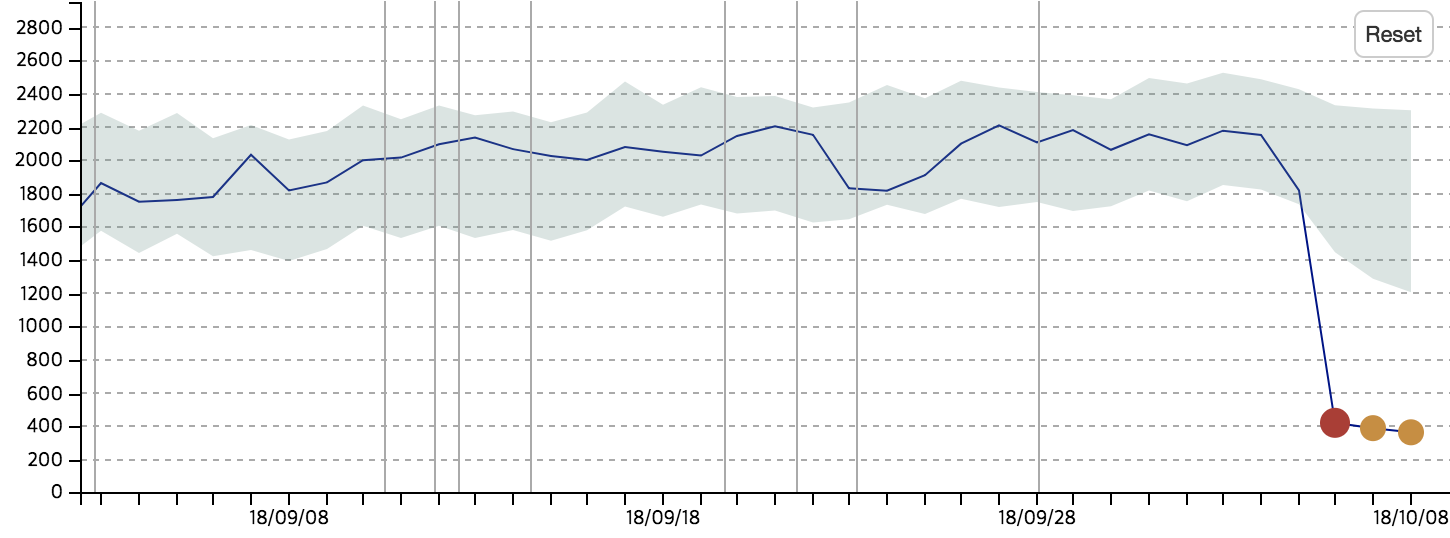
Value is significantly dropped at 2018/10/06 then keep the dropped level for several days.
My problem is, the value dropping is expected situation(and it will keep the changed level) because of the service change.
So in prophet model, I expect trend change should be happen at 2018/10/06 by some specific value.
How can I set the model trend changed at 2018/10/06?
If I give custom changepoints to model, model never detect changepoints automatically.
I imagine automatic changepoint detection, then add some custom changepoint but it's not possible now.
 jeesim2
All 10 comments
Adding custom changepoints in addition to the automatically generated is not possible.
Maybe you could try increasing the number of changepoints and increasing the changepoint.range so that automatically generated changepoints would capture you level drop.
 vhpietil
on 16 Oct 2018
vhpietil
on 16 Oct 2018
Maybe I can add a little clarity about how the automatic changepoint detection works.
Prophet by default will generate a grid of potential changepoints; the first figure of https://facebook.github.io/prophet/docs/trend_changepoints.html shows an example. All of these changepoints are included in the model, but only some of them will be fitted to have significant changes; that is what is meant by automatic changepoint selection.
When you specify a list of custom changepoints, they are treated in the same way: All of them are included in the model, but the actual change at any of them will be fitted with a sparse prior and may be 0.
So you can get what you want by taking your known changepoint, and then just adding to it a grid of other potential changepoints, like the one in the documentation figure. If you pass all of these into Prophet with the changepoints argument, it will do the automatic selection on that grid as usual, plus your added point. Does that make sense?
 bletham
on 17 Oct 2018
bletham
on 17 Oct 2018
@vhpietil @bletham I think I understand what you guys telling me.
I organized my thought again.
How about this.
Actually what I want is,
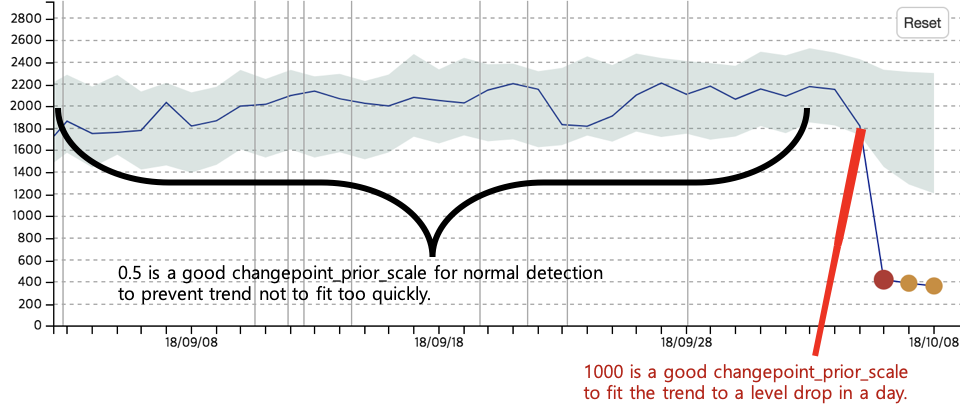
When there are multiple changepoints and each have same changepoint_prior_scale(e.g 0.5),
If I want count specific level drop as 'normal or,, almost normal', I need to that changepoint have super large changepoint_prior_scale(e.g 1000) to make trend(and yhat) also dropped in a very shot period.
If I can give different changepoint_prior_scale to specific day.
jeesim2
on 17 Oct 2018
I know that I am not answering your question but this might help :)
If you know that your data has a sudden drop, you might try putting a holiday (e.g. ”early_level”) on every day from the beginning to the day before the drop. Prophet might basically be able to estimate the drop without utilizing the changepoints. For a sudden drop you would need two large parameters (two changepoints). With holiday regressor you would need only one.
vhpietil
on 17 Oct 2018
@vhpietil Right, that is of course a good idea when drop happen many times...
If sudden drop repeated, I can utilize holiday parameters.
I am not sure, how to deal only one time sudden drop.
Is single holiday input detect the sudden drop that not repeated?
jeesim2
on 18 Oct 2018
An equivalent thing to what @vhpietil suggested would be to add an extra regressor that has value 0 for all days prior to the drop, and then value -1 for all dates after the drop. Basically you are then telling the model that there is a drop on that date (the actual magnitude of the drop would be fit from the data), and that drop would continue on as long as you had the extra regressor set to -1.
bletham
on 18 Oct 2018
@bletham @vhpietil extra regressor seems what I am looking for! Thank you all for the persistent replies!!
jeesim2
on 18 Oct 2018
This chart's data is produced by prophet.
Value is significantly dropped at 2018/10/06 then keep the dropped level for several days.
My problem is, the value dropping is expected situation(and it will keep the changed level) because of the service change.
So in prophet model, I expect trend change should be happen at 2018/10/06 by some specific value.How can I set the model trend changed at 2018/10/06?
If I give custom changepoints to model, model never detect changepoints automatically.
I imagine automatic changepoint detection, then add some custom changepoint but it's not possible now.
I think you can use codes in source as below:
cp_indexes = (
np.linspace(0, hist_size - 1, self.n_changepoints + 1)
.round()
.astype(np.int)
)
self.changepoints = (
self.history.iloc[cp_indexes]['ds'].tail(-1)
)
This is how he generated.
 svjack
on 27 Apr 2020
svjack
on 27 Apr 2020
So you can get what you want by taking your known changepoint, and then just adding to it a grid of other potential changepoints, like the one in the documentation figure. If you pass all of these into Prophet with the
changepointsargument, it will do the automatic selection on that grid as usual, plus your added point. Does that make sense?
model = Prophet()
model.fit(df).predict(model.make_future_dataframe(12))
model.changepoints
yields
1    2018-08-01
2    2018-09-01
3    2018-10-01
4    2018-11-01
5    2018-12-01
6    2019-01-01
7    2019-02-01
8    2019-03-01
9    2019-04-01
10   2019-05-01
11   2019-06-01
12   2019-07-01
13   2019-08-01
14   2019-09-01
15   2019-10-01
16   2019-11-01
Name: ds, dtype: datetime64[ns]
whereas
model = Prophet(changepoints = ['2018-08-02'])
model.fit(df).predict(model.make_future_dataframe(12))
model.changepoints
yields
DatetimeIndex(['2018-08-02'], dtype='datetime64[ns]', freq=None)
It appears as though setting changepoints wipes out the changepoint grid.
Is there any mechanism to just add more changepoints to the changepoint grid generated by Prophet.set_changepoints()?
 zachlefevre
on 1 May 2020
zachlefevre
on 1 May 2020
@zachlefevre No, but it's pretty easy to construct that grid yourself. This is the code fbprophet uses to construct that grid:
https://github.com/facebook/prophet/blob/3ccbd0e0e95d04bbadf94486a7418644347a275f/python/fbprophet/forecaster.py#L399-L406
where self.history is just the input dataframe and
https://github.com/facebook/prophet/blob/3ccbd0e0e95d04bbadf94486a7418644347a275f/python/fbprophet/forecaster.py#L389-L390
This pulls the grid based on the observations in the history in case there are large gaps in the history, but if you have regularly spaced data you can also just use pd.date_range(start=history['ds'].min(), end=history['ds'].max(), periods=25) to generate a grid, and then add your custom changepoint to that list.
bletham
on 5 May 2020
Related issues
 triciascully
·
26Comments
triciascully
·
26Comments
 pjebs
·
23Comments
pjebs
·
23Comments
 kdubovikov
·
19Comments
kdubovikov
·
19Comments
 gith77
·
130Comments
gith77
·
130Comments
 msoedov
·
33Comments
msoedov
·
33Comments
Most helpful comment
An equivalent thing to what @vhpietil suggested would be to add an extra regressor that has value 0 for all days prior to the drop, and then value -1 for all dates after the drop. Basically you are then telling the model that there is a drop on that date (the actual magnitude of the drop would be fit from the data), and that drop would continue on as long as you had the extra regressor set to -1.