Prophet: Questions about negative values in weekly plot and missing dates in df
Hello,
I'm using Prophet in R to make forecast and catch seasonality for my project. I have some questions regarding to the plot I got from 'prophet_plot_components'.
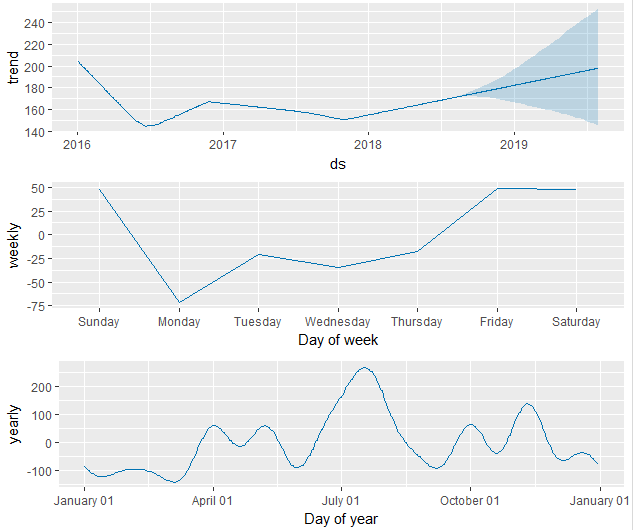
On the weekly plot, there are a lot negative values which don't make sense to me. The data I used doesn't have any negative values and also shouldn't have negative values in reality. So I'm wondering what the y axis represents. Does it represent the value of 'y' in the data frame or represent any trend? Besides, I don't have any data on Saturdays and Sundays, but the plot gave me high values on weekends. I'm not sure why this happens, and I'm wondering if I should put in zeros for all the missing dates.
I appreciate if anyone can answer my questions below or share any useful links of any information I missed.
- What are the y axis represent in the weekly and yearly plot? And why did negative numbers showed in my plot? Is there anyway to get rid of all the negatives?
- Since I don't have any data on weekends in my 'df', why are there large values on weekends in the weekly plot?
- My data is not continuous in my 'df', should I fill in all the missing dates and assign them as 0 instead of have nothing on those dates?
 Adelaic
All 6 comments
- y-axis in the weekly and yearly plot represent how much the time of the year and day of week affect the prediction. Those values are added to the trend component. So in your case mondays are predicted ~50 lower that tuesdays. And in late July predictions are about 350 higher than in January. Weekly and yearly components sum to zero, thats why there are always some negative and some positive values
- Since you don't have any data on weekends, prophet is free to estimate any effect on weekends. There is no data that gives information about the weekends or contradicts with the large values.
- There is no need to fill the missing dates with zeros, unless you think that the "real" values should be zeros and you just haven't observed them. If you are interested in predicting only monday-friday, feel free to just remove the saturday/sunday predictions.
 vhpietil
on 13 Sep 2018
vhpietil
on 13 Sep 2018
Hi Vhpietil, thank you for answering my questions! It's really clear.
I will need to remove the weekend predictions as my next step. However, I'm not sure how to remove them. I have read the 'data with regular gap' section, but I don't know how to write the R code to read dates and separate weekends out. Could you give me any suggestions or share any links might be helpful?
Thanks!
Adelaic
on 14 Sep 2018
I think lubridate-package and wday-function will do the trick
vhpietil
on 14 Sep 2018
Thanks! Just one more question.
Is the 'yhat' in the forecast table the actual prediction of the data?
Adelaic
on 14 Sep 2018
Just a follow up with my question regarding to 'yhat'.
If 'yhat' is the predicted value, is it possible to make it non-negative? Since the data in my case can never be negative, I expected the lowest predicted value to be zero. However, I got a few negative numbers in 'yhat' now. So I'm wondering if there is any way not to get negatives in the prediction. Thanks!
Adelaic
on 14 Sep 2018
There isn't a way to entirely avoid negative values for the prediction of yhat, other than to rectify them after the prediction, with something like
forecast$yhat[forecast$yhat < 0] = 0
If you use the logistic growth trend, then the trend component will always be positive. However the seasonal swings could potentially still push yhat to be negative. You do have to specify a capacity also, but it can just be a value larger than what you expect to see in the future. Issue #337 is what will be needed to get true only positive predictions; on the to-do list!
 bletham
on 25 Sep 2018
bletham
on 25 Sep 2018
Related issues
 Earththing
·
3Comments
Earththing
·
3Comments
 datafool
·
3Comments
datafool
·
3Comments
 arnaudvl
·
3Comments
arnaudvl
·
3Comments
 xiaoyaoyang
·
3Comments
xiaoyaoyang
·
3Comments
 dsvrsec
·
3Comments
dsvrsec
·
3Comments
Most helpful comment