Project-system: Analyzer dependencies showing as unresolved full paths
Steps to reproduce:
- Create a new .NET Core Console App
- Add a package reference to
xunit.analyzers - Build the solution
- Close the solution
- Re-open the solution
- Expand the project's dependencies node
- Notice there is no
Analyzersnode - Modify whitespace in the project file and save it (triggering a design-time build)
- Notice an
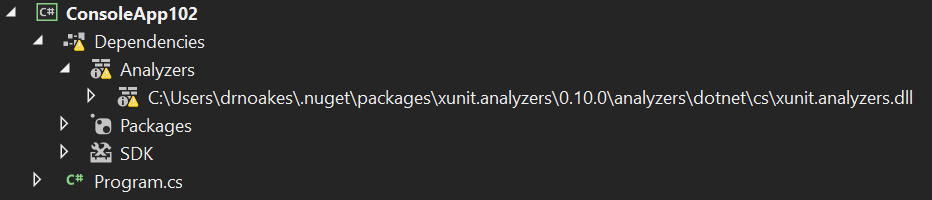
Analyzersnode appears with unresolved child, which is a full path rather than the analyzer's name
- Close and reopen the solution and the analyzers appear correctly
- Modify the project file again (stays resolved)
- Close and re-open the solution (stays resolved)
- Build from VS then close/re-open solution and notice
Analyzersnode is missing again
Open questions:
- Why is the
Analyzersnode not initially present? This seems to happen if the build before opening the solution happened within VS. - Why are analyzers appearing as paths and in unresolved state?
 drewnoakes
All 16 comments
As part of fixing this, add coverage of analyzers to the integration tests.
drewnoakes
on 5 Sep 2019
Some notes to capture findings of investigations.
- It doesn't appear to vary based on SDK version
- It does reproduce in 16.2.3
- It does NOT reproduce in 15.9.15
- It seems related to a restored cache of DTB data
(EDIT removed incorrect git bisect log as I'd misidentified the good commit)
drewnoakes
on 6 Sep 2019
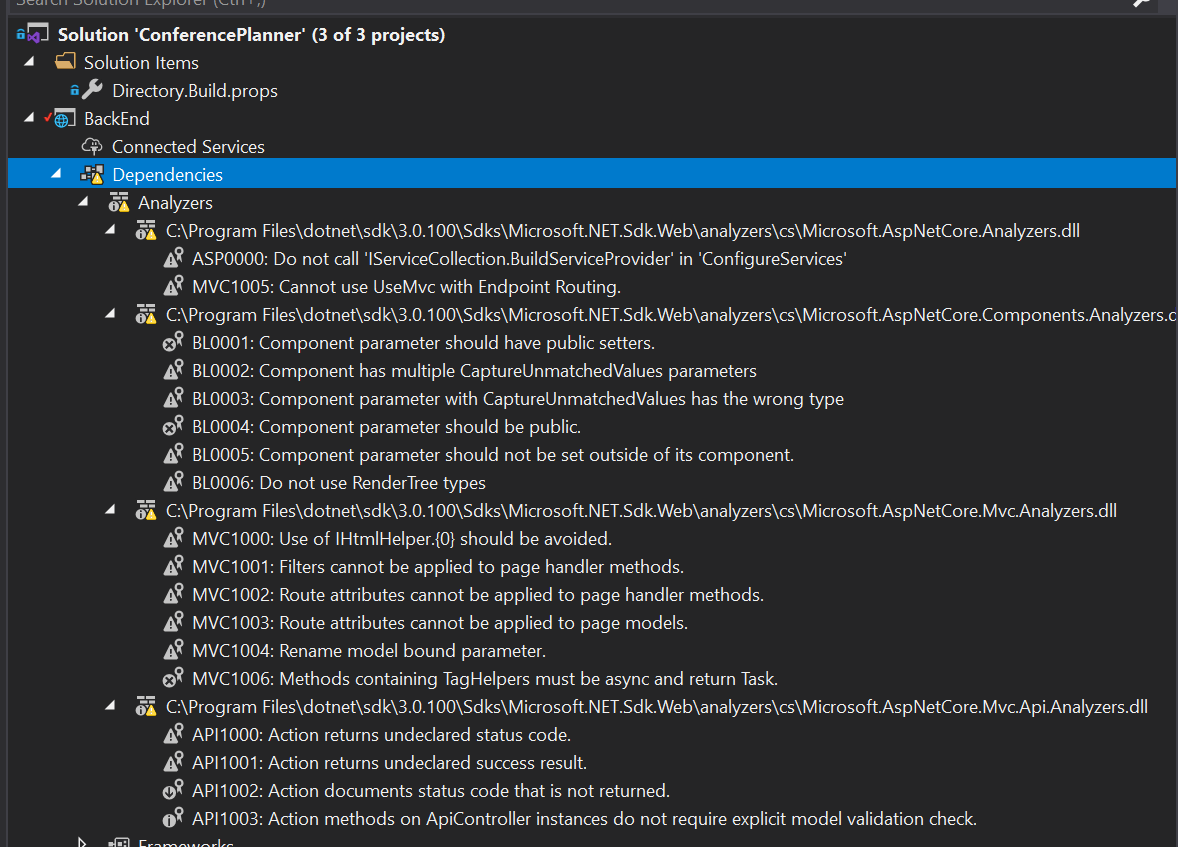
FYI still repros in 16.3.1 when working with ASP.NET Core projects:
 DamianEdwards
on 27 Sep 2019
DamianEdwards
on 27 Sep 2019
This is potentially caused by metadata filtering in the DTB cache for task items. From the (internal) ProjectServices repo:
MSBuild throws exceptions when we access path related properties on non-path items.
We try to prevent running into such frequent exceptions by detecting some common invalid path patterns.
This filtering applies when writing the cache, which fits with the above repro steps. My current hunch is that data needed by the Analyzers node is being filtered out by the cache, but this needs further investigation.
drewnoakes
on 8 Oct 2019
Paths are shown for unresolved analyzer references:
EDIT: This is a red herring. Roslyn creates the full _Analyzers_ node for legacy projects, but for this project system it only populates diagnostic items. We have similar logic however:
drewnoakes
on 6 Jan 2020
This can be reproduced more easily by:
- New ASP.NET Core Web Application (empty)
- Close solution
- Reopen solution
Deleting the .dtbcache file in the .vs folder between steps 2 and 3 fixes the problem, so the DTB caching in ProjectServices is looking like the culprit here.
EDIT The above worked for me five times in a row, but no longer does. It doesn't seem that deterministic. Running VS in the debugger makes it fail more often. Right now I'm Ctrl+F5'ing and can't repro it at all.
drewnoakes
on 10 Jan 2020
@drewnoakes really appreciate the persistence on this 👍
DamianEdwards
on 16 Jan 2020
@drewnoakes post helped me out! Thank you!
 ttaylor29
on 17 Jan 2020
ttaylor29
on 17 Jan 2020
Getting closer. This appears to be a race condition. If the VS instance is 'warm' (has previously had a solution open) then the problem triggers. The presence of the DTB cache factors in to the sequence of events, as it's much faster to read the cache than do a DTB. It also explains why using the debugger hasn't been helpful, as that changes timing too. I'm going to add some tracing to dig deeper.
drewnoakes
on 24 Jan 2020
This has been fixed and will be released in 16.5.
drewnoakes
on 28 Jan 2020
could be but 16.5 is not out yet
 AssafAuo
on 29 Jan 2020
AssafAuo
on 29 Jan 2020
This has been fixed and will be released in 16.5.
I just updated Visual studio to 16.4.4 and the issue was resolved.
The reference is fixed and no more yellow triangle.
Thanks.
 keserwan
on 31 Jan 2020
keserwan
on 31 Jan 2020
@keserwan glad it's working for you, but the fix is not present in that build. It will be in 16.5, and most likely in a preview.
drewnoakes
on 3 Feb 2020
I fixed this error by deleting the solution's .vs folder along with all bin and obj folders in all subprojects. All of these of course while VS was not running.
 arphox
on 2 Mar 2020
arphox
on 2 Mar 2020
@arphox Thanks alot. Your suggestion worked for me
 oboro-san
on 12 Mar 2020
oboro-san
on 12 Mar 2020
That will work until the next reload of the solution, the fix is in 16.5.
 davkean
on 13 Mar 2020
davkean
on 13 Mar 2020
Related issues
 BillHiebert
·
3Comments
BillHiebert
·
3Comments
 MBulli
·
3Comments
MBulli
·
3Comments
 aL3891
·
3Comments
aL3891
·
3Comments
 abpiskunov
·
4Comments
davkean
·
4Comments
abpiskunov
·
4Comments
davkean
·
4Comments
Most helpful comment
This has been fixed and will be released in 16.5.