Plots.jl: latex: failed to create a dvi file
using Plots, LaTeXStrings

x = range(-pi,stop=pi,length=101)
plot(
      x,cos.(x),
      xlabel = L"$\alpha$"      #works if commented out
)
savefig("ASecondPlot.png")
gives a warning message latex: failed to create a dvi file, creates a number of garbage (?) files in the same folder - and actually also the desired png file. Somewhat annoying. This worked well a few weeks ago.
Julia 1.4.1, Windows 10, 64
Plots 1.2.0
MiKTeX in the system path
EDIT: this seems to be GR issue 300
EDIT 2: still there after updating to Plots 1.2.1 and GR 0.49.0
 PaulSoderlind
All 40 comments
Not sure if it is relevant, but the L macro already pads $s by default. So L"\alpha" should be enough.
 BeastyBlacksmith
on 3 May 2020
BeastyBlacksmith
on 3 May 2020
Correct. However, it's a habit I have from strings like L"This is $\alpha$ and then comes $\beta$"
PaulSoderlind
on 3 May 2020
The same problem as Paul: julia> latex: failed to create a dvi file
I'm using: Julia 1.4.2, Atom 1.47.0 x 64, Plots v1.3.3., LaTeXStrings 1.1.0. MiKTeX working OK.
Everything worked fine in Julia 1.3.1, the same Atom version, and Plots 0.29.6, LatexStrings 1.1.0.
I think that in the past I solved a similar problem by ]build Plots or ]build GR. Not anymore.
I think the new version of Plots changed somehow. I have a lot of plots that used to come out perfectly OK, which now require some minor changes. But the LateXStrings' problem is really annoying.
I think the problem is with the GR backhand. I have just used LaTeXStrings with pyplot() and the plots come out well. The only problem is that the mathematical symbols in pyplot() look really horrible. Not very useful at all.
 VivaldoMendes
on 26 May 2020
VivaldoMendes
on 26 May 2020
Since all affected people are on Windows and I can't confirm on MacOS, this is probably related to Windows.
Meanwhile give the pgfplotsx-backend a try. It has also native rendering of LaTeXStrings.
BeastyBlacksmith
on 26 May 2020
By the way,
I have just been able to produce plots with the L macro, by firstly build LaTeXStrings. The only problem is that there is still a bunch of garbage popping up in the REPL. How can we get rid of this garbage?
VivaldoMendes
on 26 May 2020
What garbage?
BeastyBlacksmith
on 26 May 2020
Despite producing the plot more or less OK (there is still a small problem with subscripts, but we can turn around this), in the REPL we get a lot output like this, every time a plot is produced:
Julia> latex: failed to create a dvi file
latex: failed to create a dvi file
latex: failed to create a dvi file
latex: failed to create a dvi file
latex: failed to create a dvi file
latex: failed to create a dvi file
latex: failed to create a dvi file
latex: failed to create a dvi file
latex: failed to create a dvi file
latex: failed to create a dvi file
latex: failed to create a dvi file
latex: failed to create a dvi file
latex: failed to create a dvi file
latex: failed to create a dvi file
latex: failed to create a dvi file
latex: failed to create a dvi file
latex: failed to create a dvi file
latex: failed to create a dvi file
latex: failed to create a dvi file
latex: failed to create a dvi file
latex: failed to create a dvi file
latex: failed to create a dvi file
VivaldoMendes
on 26 May 2020
You meant pgfplots() not pgfplotsx(). I have PGFPlots 3.2.1 installed but Julia crashes now (I tried twice, it crashed twice). It did not use to in my former settings, whenever I used the pgfplots backend.
VivaldoMendes
on 26 May 2020
I meant the new pgfplotsx-backend, which needs PGFPlotsX
BeastyBlacksmith
on 26 May 2020
Both pgfplotsx and pyplot handle LaTeX text. Good choices, both.
PaulSoderlind
on 26 May 2020
Thanks' a lot. The pgfplotsx backend looks immaculate. I was not aware of this specific backend and I think I checked on the wrong website.
VivaldoMendes
on 26 May 2020
In the meantime, I have found out that the pgfplotsx() backend, despite producing a perfect output using LaTeXStrings, shows a very annoying side: it is more than 20 times slower than the usual gr() backend. For some purposes, when LaTeXStrings will have to be used, and time is a critical element, the pgfplotx() is not a suitable solution.
In my previous settings (mentioned in an entry above) I did not have this problem, neither the latex: failed to create a dvi file issue. Plots is such a wonderful package that it's a pity if we do not solve this issue in Windows 10. It used to work OK with Julia 1.3.1 and Plots 0.29.6. There must some minor intricacy with Julia 1.4.2 and Plots v1.3.3. Atom and LaTexStrings remain the same versions, and the problem does not vanish if I use Jupyter notebook.
VivaldoMendes
on 8 Jun 2020
Since all affected people are on Windows and I can't confirm on MacOS, this is probably related to Windows.
@BeastyBlacksmith I am on Win 10 (using MiKTeX). Anything I can do to help you debug this?
PaulSoderlind
on 17 Jun 2020
I'm glad to see that Paul is ready to help.
In the meantime, I have done a kind of migration into PGFPlotsX.jl directly, without using Plots and the pgfplotsx() backend. With simple plots, PGFPlotsX is more than 100 times faster than Plots+gr(). In 3-D plotting, the former is around 3 times faster than Plots+pgfplotsx(), and its output looks a little bit more clear than in the PLots+pgfplotsx() version.
The only problem with PGFPlotsX.jl is that it is still a thin layer to PGFPLOTS TEX, and many features of the latter powerful package are still to be implemented in PGFPlotsX.jl. Moreover, using Plots is still much easier and more intuitive than using PGFPlotsX.
All this in a Windows 10 machine, the latest version of Julia and Atom.
VivaldoMendes
on 17 Jun 2020
is https://github.com/JuliaPlots/Plots.jl/issues/2774 the same issue? This is enough to generate the warning message latex: failed to create a dvi file
using Plots, LaTeXStrings
p1 = plot(1:10,cos.(1:10),
    xlab="s " *L" [h^{-1}Mpc]",
    ylab=L"|x_s^2\xi_l^{bisector ,(2)}(s)/\xi_l^{pp}(s)|")
display(p1)
Is there any way to go around this issue? I'm using GR and can't really move to another backend since I already have some plots from GR in my work. Maybe going back to some older version works?
For me this problem happens only when trying to save the figure to PDF, in VS Code or GSK it plots fine...
 masenka31
on 2 Jul 2020
masenka31
on 2 Jul 2020
does saving as .png work?
BeastyBlacksmith
on 3 Jul 2020
This "works" with both png and pdf, in the sense of actually creating the file. The placement of the LaTeX elements is a bit off, but it works. _However_, warning messages latex: failed to create a dvi file are issued and a number of intermediate files (with names like e and 5) are left in the folder. They appear to be LaTeX files. My guess is that GR/plots does not cooperate well with MiKTeX.
using Plots, LaTeXStrings

x = range(-pi,stop=pi,length=101)
plot(
      x,cos.(x),
      xlabel = L"$\alpha$"      #no warnings if commented out
)
savefig("MyPlot.png")
#savefig("MyPlot.pdf")
I think saving as png didn't work yesterday, but somehow works now... But pdfs still don't include the label with latex string:

using Plots, LaTeXStrings
x,y = rand(100),rand(100)
scatter(x,y,label=L"\alpha")
savefig("some.pdf")
latex: failed to create a dvi file
@masenka31 Which version of Plots, GR and julia is that?
Also @jheinen: Does the native LaTeX renderer work for legend entries (on windows, it works for me on macOS)?
BeastyBlacksmith
on 3 Jul 2020
I'm using
LaTeXStrings v1.1.0
Plots v1.5.2
GR v0.50.1
with 1.5.0-rc1, but I'm using the same with Julia 1.4.2
masenka31
on 3 Jul 2020
@masenka31 I can confirm your finding (Win 10, Julia 1.4.2, Plots 1.5.2). label=L"\alpha" does not show anything. (But, xlabel=L"\alpha" does.)
PaulSoderlind
on 3 Jul 2020
Did anyone solve this issue?
 c-a-rigo
on 5 Jul 2020
c-a-rigo
on 5 Jul 2020
I installed latex and dvipng on my system (I am using Ubuntu 18.04), and this error was fixed!
sudo apt-get install texlive-latex-extra
sudo apt-get install dvipng
The original issue is about windows, install these two packages there and give it a try again!
 siddharthlal25
on 6 Jul 2020
siddharthlal25
on 6 Jul 2020
Quite interesting that when I have more labels and at least one of them is not a latex string, then the PDF created looks okay. It still produces the warning about latex: failed to create a dvi file.

masenka31
on 9 Jul 2020
With recent versions of both GR (0.50.1) and Plots (1.5.3) everything should work fine (without a local LaTeX installation) on all platforms.
 jheinen
on 10 Jul 2020
jheinen
on 10 Jul 2020
@jheinen I just tried (with GR 0.50.1 and Plots 1.5.4) and I still get the warning message latex: failed to create a dvi file.
I do have a local MiKTeX installation (and it's in the system path). Could it be that Plots tries that before falling back on the built-in LaTeX?
PaulSoderlind
on 10 Jul 2020
Everything worked fine in Julia 1.3.1, Plots 0.29.6, LatexStrings 1.1.0, don't recall which GR version I had. Now with Julia 1.4.2, GR 0.50.1, Plots 1.54, LaTeXStrings 1.1.0, LaTex strings become unworkable, for three reasons: the plot does not come out well, the REPL become full of latex: failed to create a dvi file and the Project folder becomes populated with a lot of useless files with funny names.
The problem seems to be somehow related to the GR backend, because if we plot with the pgfplotsx() or pyplots() backends, Plots is capable of producing a perfect output with the LaTeX code correctly interpreted, and no collateral files or messages.
The fact is that the gr() is really much faster than the pgfplotsx() -- the latter takes around 5 seconds to produce each plot (and I am not talking about the first time plot thing) -- is a terribly important issue when Latex strings + time are crucial elements. I am teaching a course where students take their exams within the notebook facility. They have the problems in LaTeX, they have to answer using LaTeX code and they have to do a lot of plotting, in which LaTeXStrings becomes extremely useful in the plotting parts of the answers (parameter values). In an exam, time is a crucial element and it is complicated to wait for 5s for a simple plot to come out, by using the pgfplotsx(), vs 0.14s with the gr(). Julia needs a good GUI, Plots is wonderful, and we have to be grateful to all of you guys that are putting a lot of your time and effort into developing these computational tools. But I just get nuts when I see my Matlab colleagues joking at me.
VivaldoMendes
on 10 Jul 2020
I forgot to mention: I and most of my students are using Windows 10.
VivaldoMendes
on 10 Jul 2020
If you did already the GR run-time update (ENV["GRDIR"] = ""; ] build GR) and the problem is still there, please provide a MWE.
Often such problems are caused by an outdated GR Run-time. I feel I need to automate and/or simplify this part of the GR installation.
jheinen
on 10 Jul 2020
Well, I have tried a lot of ways, but either there is something wrong with my commands, or with the GR interaction with MiKTeX. I have the MiKTeX up to date.
I have indeed tried what you suggest (which is very clearly put in the GRUtils website):
julia> ENV["GRDIR"] = ""# Am I supposed to insert any command between the double prime on the right-hand side ""? I left it exactly as it is on the website: no fill.
Then I took the second step:
(@v1.4) pkg> build GR
Everything looked OK.
I leave you with the status of my Julia packages related to this issue:
(@v1.4) pkg> st Plots GR LaTeXStrings
Status C:\Users\Utilizador\.julia\environments\v1.4\Project.toml
[28b8d3ca] GR v0.50.1
[b964fa9f] LaTeXStrings v1.1.0
[91a5bcdd] Plots v1.5.4 #master (https://github.com/JuliaPlots/Plots.jl.git)
And I provide the simplest possible working example:
using Plots , LaTeXStrings
plot(x->x^2, -2:0.01:2, xlabel = L"x", ylabel = L"y")
the output of which comes out as
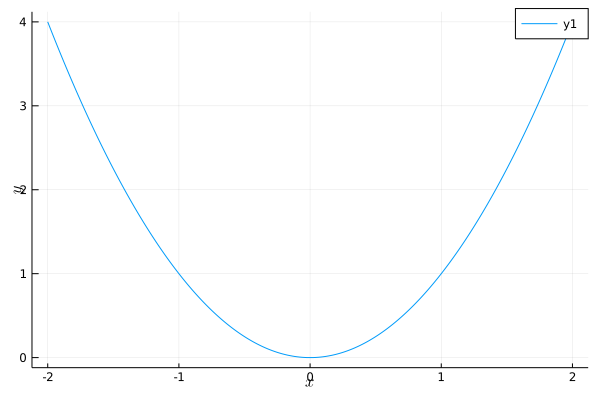
As it can be easily seen the LaTeX strings are in the wrong place, there are collateral problems as well (which I mentioned above), and in more sophisticated examples the LaTeX strings just get mad.
In case this information may help, the versioninfo() is the following:
julia> versioninfo()
Julia Version 1.4.2
Commit 44fa15b150* (2020-05-23 18:35 UTC)
Platform Info:
OS: Windows (x86_64-w64-mingw32)
CPU: Intel(R) Core(TM) i7-7700K CPU @ 4.20GHz
WORD_SIZE: 64
LIBM: libopenlibm
LLVM: libLLVM-8.0.1 (ORCJIT, skylake)
Environment:
JULIA_EDITOR = "C:\Users\Utilizador\AppDataLocal\atom\app-1.48.0\atom.exe" -a JULIA_NUM_THREADS = 4
Finally, I tried the same example with GRUtils and the same problem remained.
VivaldoMendes
on 10 Jul 2020
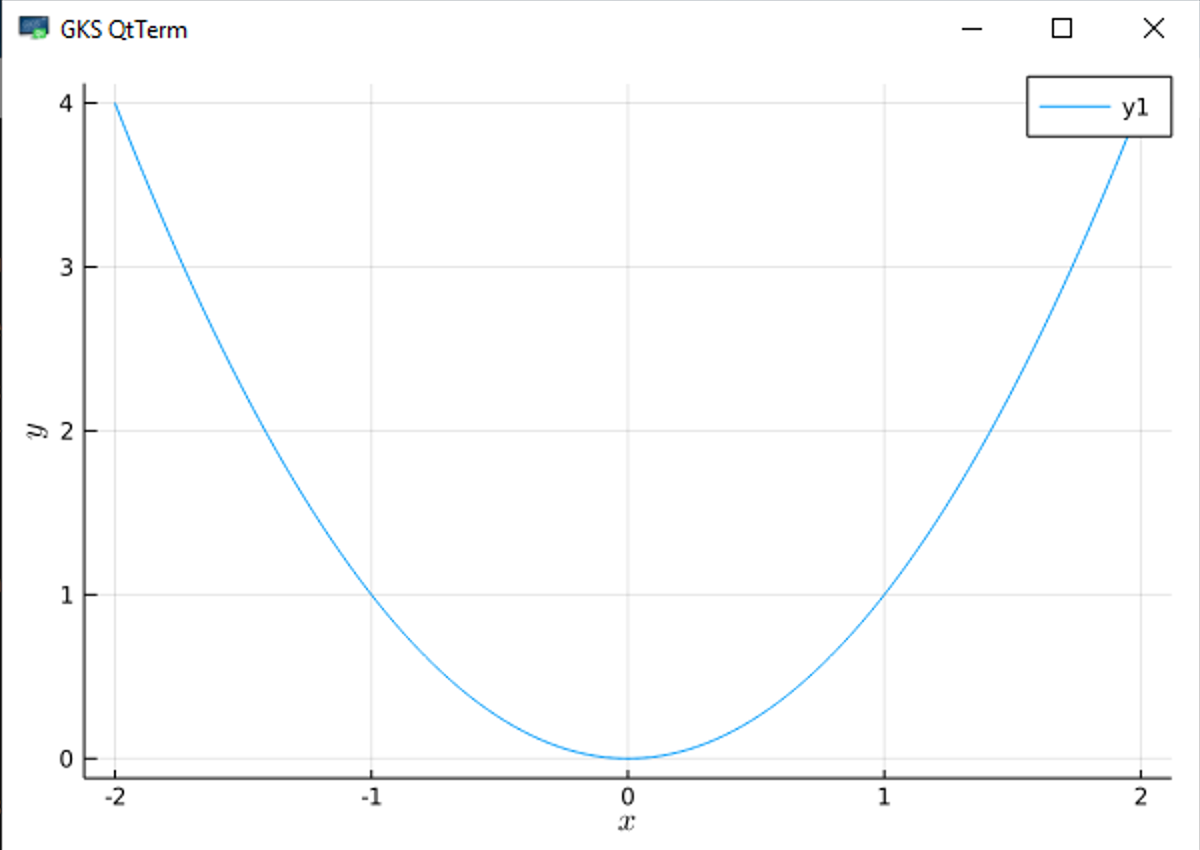
That's strange - that's what I get:

Without any local LaTeX installed ...
jheinen
on 10 Jul 2020
I really do not have a clue about what is happening. As mentioned before, I still have an older version of Plots and GR (and Julia) in one laptop which produces the plot exactly like yours ... with a local MiKTex installation. The same local MiKTeX installation, in the same computer, with different GR versions produces the correct plot, and the distorted one. Is it the case that you are using MacOS while I am using Windows 10? In an hour or so, I will get back and tell which version of GR works fine.
VivaldoMendes
on 10 Jul 2020
This is on Windows 10:
Could you pls check the version of the GR run-time:
using Plots
Plots.GR.version()
Here it goes:
using Plots
Plots.GR.version() "0.50.0"
Funny, when I check the status I get
GR v0.50.1.
I have ]build everything: Plots, GR, LaTeXStrings.
VivaldoMendes
on 10 Jul 2020
Maybe this helps.
ln my wife's laptop, last December it was installed Julia 1.3.0, and the packages that we may find below:
v1.3) pkg> st
  Status `C:\Users\diana\.julia\environments\v1.3\Project.toml`
  [c52e3926] Atom v0.12.15
  [336ed68f] CSV v0.5.20
  [a93c6f00] DataFrames v0.20.0
  [31c24e10] Distributions v0.21.11
  [7073ff75] IJulia v1.20.2
  [e5e0dc1b] Juno v0.7.2
  [b964fa9f] LaTeXStrings v1.1.0+ #master (https://github.com/stevengj/LaTeXStrings.jl.git)
  [91a5bcdd] Plots v0.28.4
  [2913bbd2] StatsBase v0.32.0
  [f3b207a7] StatsPlots v0.13.0
  [37e2e46d] LinearAlgebra
  [2f01184e] SparseArrays
  [10745b16] Statistics
She did not install the GR.jl package, just Plots 0.28.4, and LaTeXStrings 1.1.0 (what is that + after v1.1.0?). But the GR.jl package installed/not installed does not seem to be the problem, as we can see further below. I can easily play around with LaTeX strings like in the following code (the latest version of a local MiKTex installation is also working well):
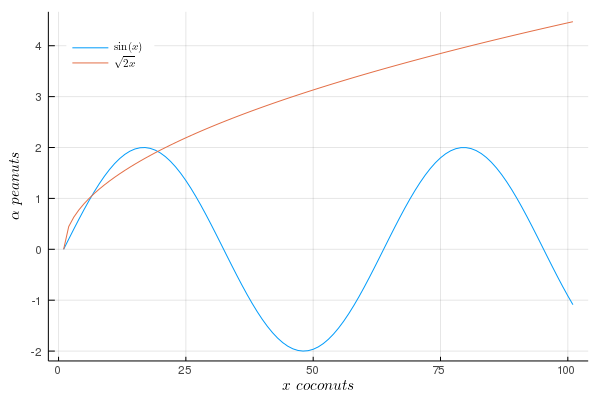
using Plots
using LaTeXStrings
Zed = vcat([[2sin(i)  sqrt(2i)]  for i in 0:0.1:10]...)
plot(Zed,
xlabel = L"x \ coconuts", ylabel = L"\alpha \ peanuts",
label = [L"\sin(x)"  L"\sqrt{2x}"],
fg_legend = :transparent, legend = :topleft )
The figure without any problems looks like this:
In case it helps, the system information is:
julia> versioninfo()
Julia Version 1.3.0
Commit 46ce4d7933 (2019-11-26 06:09 UTC)
Platform Info:
  OS: Windows (x86_64-w64-mingw32)
  CPU: Intel(R) Core(TM) i7-10510U CPU @ 1.80GHz
  WORD_SIZE: 64
  LIBM: libopenlibm
  LLVM: libLLVM-6.0.1 (ORCJIT, skylake)
Environment:
  JULIA_EDITOR = "C:\Users\diana\AppData\Local\atom\app-1.48.0\atom.exe"  -a
  JULIA_NUM_THREADS = 4
Notice that the very same piece of code above, used in this very same computer, using a new version of Julia 1.4.2 and with an updated version of Plots.jl (from v0.28.4 to v1.4.4), with the LaTeXStrings.jl remaining (apparently) the same in both environments, and without having the GR.jl installed
(@v1.4) pkg> st Plots GR LaTeXStrings
Status C:\Users\diana\.julia\environments\v1.4\Project.toml
[b964fa9f] LaTeXStrings v1.1.0
[91a5bcdd] Plots v1.4.4
will produce a distorted version of the plot above.
VivaldoMendes
on 11 Jul 2020
Sorry, but I copied the wrong status commands in the last piece of code in my previous comment. Because the GR.jl is not installed (to avoid the usual message "Error: the following packages ....", it should look like this:
(@v1.4) pkg> st Plots  LaTeXStrings
Status C:\Users\diana\.julia\environments\v1.4\Project.toml
[b964fa9f] LaTeXStrings v1.1.0
[91a5bcdd] Plots v1.4.4
Hi,
The suggestion by @jheinen solves my problem:
If you did already the GR run-time update (
ENV["GRDIR"] = ""; ] build GR) and the problem is still there, please provide a MWE.Often such problems are caused by an outdated GR Run-time. I feel I need to automate and/or simplify this part of the GR installation.
I am using Windows 10; Julia 1.4.2; Plots v1.5.4 with a local texlive installation. My GR runtime version is
julia> Plots.GR.version()
"0.50.0.post33"
 neversakura
on 12 Jul 2020
neversakura
on 12 Jul 2020
The suggestion by @jheinen solves my problem too:
ENV["GRDIR"] = ""
] build GR
(I have tested several machines, with both Julia 1.4.2 and 1.5.0-rc1.0.)
Thanks
PaulSoderlind
on 12 Jul 2020
I can confirm that
ENV["GRDIR"] = ""
] build GR
works fine for me as well, in different machines.
I had tried it before and it did not work, don't know what kind of mistake I was making then.
VivaldoMendes
on 12 Jul 2020
Related issues
 tbenst
·
3Comments
tbenst
·
3Comments
 nebuta
·
3Comments
nebuta
·
3Comments
 cortner
·
4Comments
cortner
·
4Comments
 Krastanov
·
3Comments
Krastanov
·
3Comments
 lstagner
·
5Comments
lstagner
·
5Comments
Most helpful comment
In the meantime, I have found out that the
pgfplotsx()backend, despite producing a perfect output using LaTeXStrings, shows a very annoying side: it is more than 20 times slower than the usualgr()backend. For some purposes, when LaTeXStrings will have to be used, and time is a critical element, the pgfplotx() is not a suitable solution.In my previous settings (mentioned in an entry above) I did not have this problem, neither the
latex: failed to create a dvi fileissue. Plots is such a wonderful package that it's a pity if we do not solve this issue in Windows 10. It used to work OK with Julia 1.3.1 and Plots 0.29.6. There must some minor intricacy with Julia 1.4.2 and Plots v1.3.3. Atom and LaTexStrings remain the same versions, and the problem does not vanish if I use Jupyter notebook.