Plots.jl: GKS: Rectangle definition is invalid in routine SET_WINDOW
Ploting a basic array with floats failes.
I can't plot some one dimensional arrays filled with Float64 numbers.
I'm getting multiple errors like
GKS: Rectangle definition is invalid in routine SET_WINDOW.
The problem occurs on my Linux (x86_64-pc-linux-gnu) and Windows 10 machines.
Here is how to reproduce the problem:
Running with REPL
using Plots

z = [0.6551724137931031
     0.6551724137931038
     0.6551724137931031
     0.6551724137931038
     0.6551724137931031
     0.6551724137931038
     0.6551724137931031
     0.6551724137931038
     0.6551724137931031
     0.6551724137931038]

plot(z)
returns
julia> using Plots
julia> z = [0.6551724137931031
            0.6551724137931038
            0.6551724137931031
            0.6551724137931038
            0.6551724137931031
            0.6551724137931038
            0.6551724137931031
            0.6551724137931038
            0.6551724137931031
            0.6551724137931038]
10-element Array{Float64,1}:
 0.6551724137931031
 0.6551724137931038
 0.6551724137931031
 0.6551724137931038
 0.6551724137931031
 0.6551724137931038
 0.6551724137931031
 0.6551724137931038
 0.6551724137931031
 0.6551724137931038

julia> plot(z)
GKS: Rectangle definition is invalid in routine SET_WINDOW
GKS: Rectangle definition is invalid in routine SET_WINDOW
GKS: Rectangle definition is invalid in routine SET_WINDOW
GKS: Rectangle definition is invalid in routine SET_WINDOW
My (Windows) system is:
julia> versioninfo(verbose=true)
Julia Version 1.0.2
Commit d789231e99 (2018-11-08 20:11 UTC)
Platform Info:
  OS: Windows (x86_64-w64-mingw32)
      Microsoft Windows [Version 10.0.14393]
  CPU: Intel(R) Core(TM) i7-6700 CPU @ 3.40GHz:
              speed         user         nice          sys         idle          irq
       #1  3408 MHz     121125            0       156921      1894796        16906  ticks
       #2  3408 MHz      70281            0        46718      2055703          843  ticks
       #3  3408 MHz     111359            0        60250      2001093          484  ticks
       #4  3408 MHz     102656            0        37437      2032609          468  ticks
       #5  3408 MHz     160375            0        95843      1916484          359  ticks
       #6  3408 MHz      57000            0        28359      2087343          437  ticks
       #7  3408 MHz     135609            0        67500      1969593          453  ticks
       #8  3408 MHz      80375            0        51859      2040468          687  ticks

  Memory: 15.887237548828125 GB (11202.3828125 MB free)
  Uptime: 2172.6541138 sec
  Load Avg:  0.0  0.0  0.0
  WORD_SIZE: 64
  LIBM: libopenlibm
  LLVM: libLLVM-6.0.0 (ORCJIT, skylake)
Environment:
  JULIA_EDITOR = "C:\Users\aheuermann1\AppData\Local\atom\app-1.33.0\atom.exe" -a
  JULIA_NUM_THREADS = 4
  ATOM_HOME = C:\Users\aheuermann1\.atom
  GKS_FILEPATH = C:\Users\USERNAME\AppData\Local\Temp\jl_9463.tmp.png
  GKS_FONTPATH = C:\Users\USERNAME\.julia\packages\GR\wFd9A\src\..\deps\gr
I found issue https://github.com/jheinen/GR.jl/issues/176
but it seems not to be related to this problem.
 AnHeuermann
All 14 comments
It's the difference between the numbers that is too small.
 mkborregaard
on 6 Dec 2018
mkborregaard
on 6 Dec 2018
Here's a clean reproduction of the problem:
plot([0; 1.0], [ 0.12000000000; 0.12000000003] , ylims=(0.12000000000,0.12000000002) )
leads to the error:
GKS: Rectangle definition is invalid in routine SET_WINDOW
and the plot fails. In other words, Plots can't plot a difference of 12 significant digits of precision.
but alternatively
plot([0; 1.0], [ 0.1200000000; 0.1200000003] , ylims=(0.1200000000,0.1200000002) )
works fine. In other words, Plots can handle a difference of 11 significant digits of precision but cannot handle a difference of 12 significant digits of precision.
Many thanks for your efforts. Plots is my fave.
 damonturney
on 4 Feb 2020
damonturney
on 4 Feb 2020
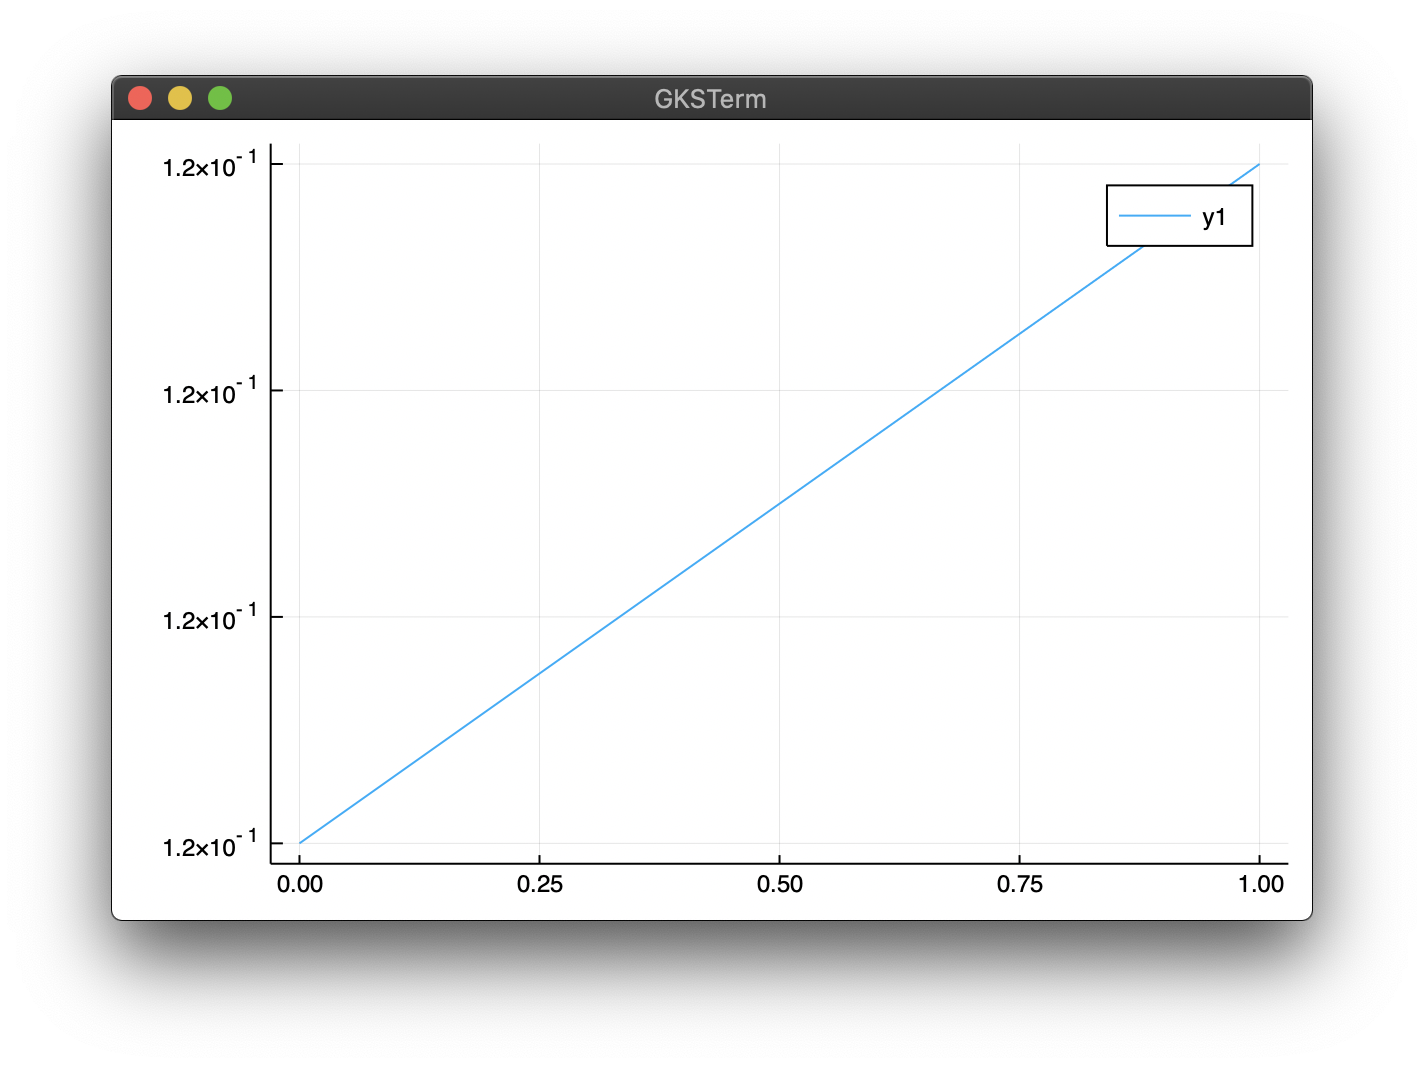
Is this related to Windows? Just tried on macOS X and it works:
using Plots
plot([0; 1.0], [ 0.12000000000; 0.12000000003])
 jheinen
on 4 Feb 2020
jheinen
on 4 Feb 2020
No, also works on Windows 10 (for me):
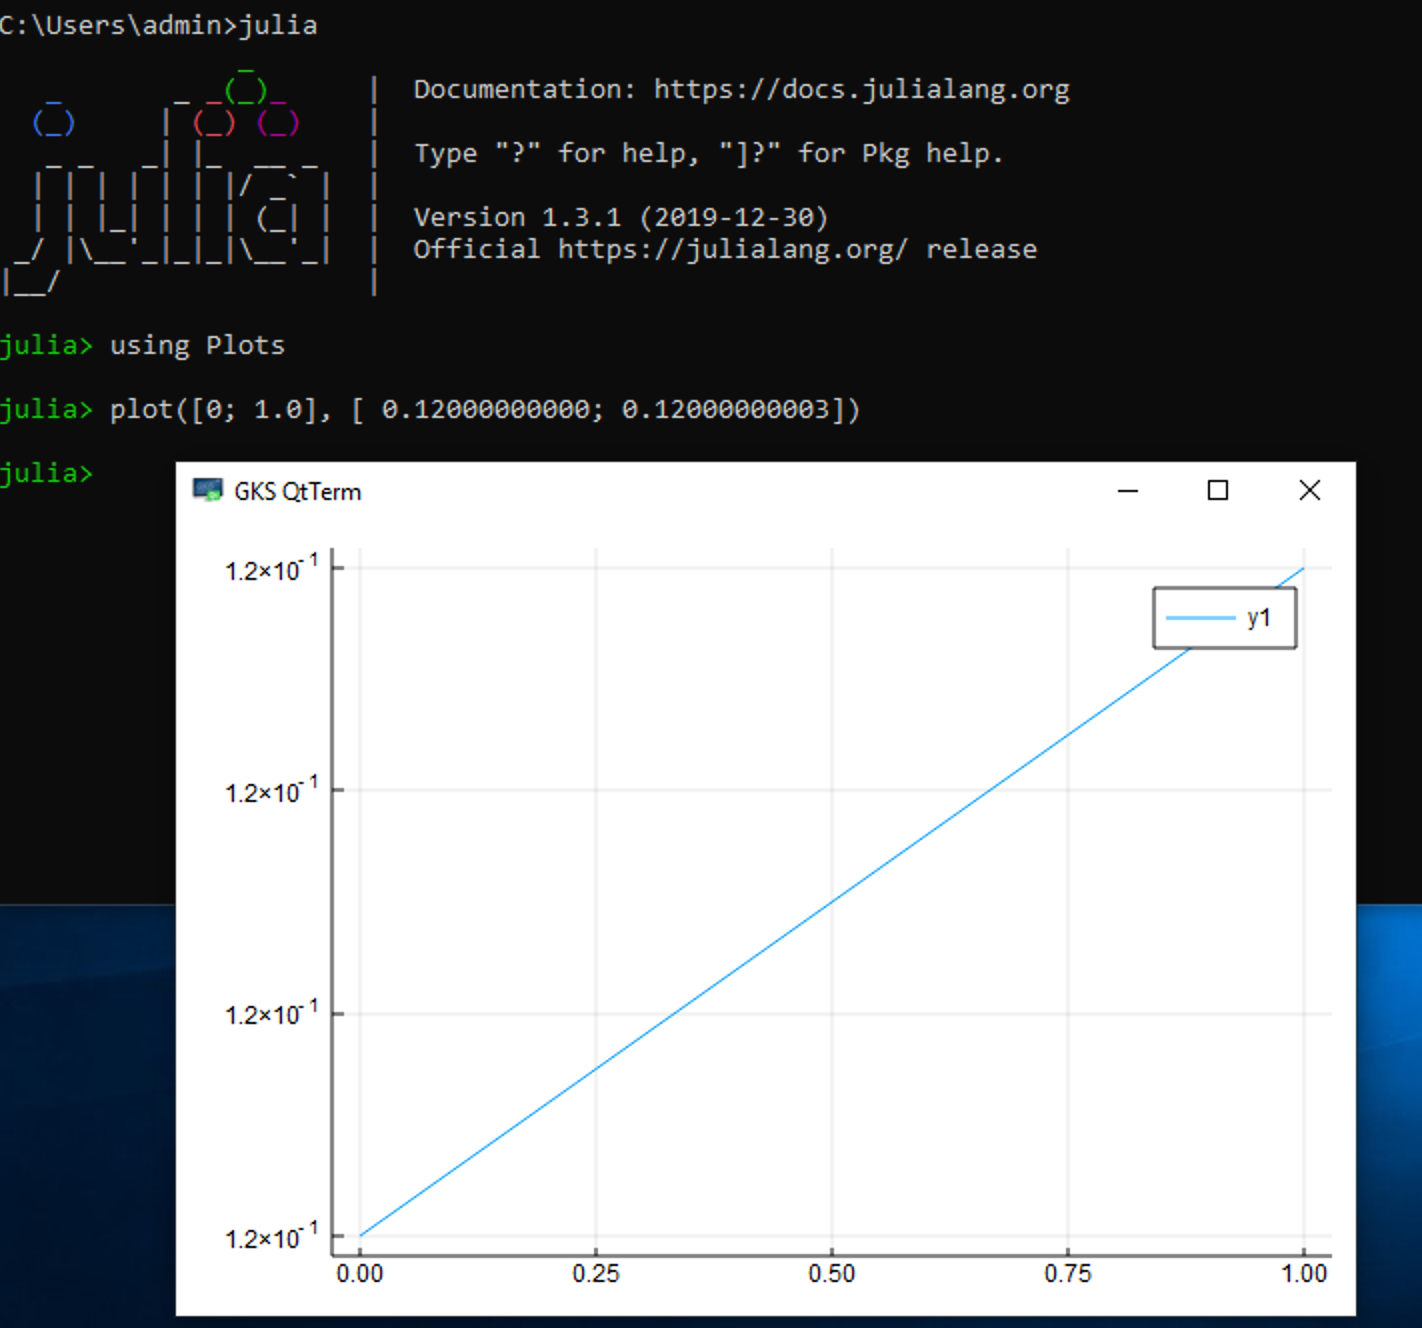
jheinen
on 4 Feb 2020
I think this might actually have been a bug in the MWE of @damonturney, which was
plot([0; 1.0], [ 0.12000000000; 0.12000000003] , ylims=(0.12000000000,0.12000000002) )
Notice that the ylims are off (only contains a single point). Editing to
plot([0; 1.0], [ 0.12000000000; 0.12000000003] , ylims=(0.12000000000,0.12000000003) )
makes this work.
The original MWE at the top of this post still reproduces the error for me in MacOS X with GR, but semiworks in pyplot. Can you try that @jheinen ?
mkborregaard
on 4 Feb 2020
Yes. This really fails. But, to be honest, I don't know how to increase the number of significant digits within GR without producing other side-effects. We had a similar discussion with developers in our outstation some months ago and we didn't find a (stable) solution.
This is the reminder (comment) in my source code (gks.c):
/* Check whether the given coordinate range does not lead
to loss of precision in subsequent GKS functions. It must
be ensured that there are at least 4 significant digits
when applying normalization or device transformations */
In principle, this check prevents strange errors and/or incorrect results in subsequent plot operations.
jheinen
on 4 Feb 2020
@jheinen Your version of the MWE worked because you eliminated the ylims=(0.12000000000,0.12000000002).
Here's a more appropriate version of the MWE:
plot([0; 1.0], [ 0.12000000000; 0.12000000002])
doesn't work, but
plot([0; 1.0], [ 0.12000000000; 0.12000000003])
works.
damonturney
on 4 Feb 2020
So you see that Julia's Plots can only plot ~11 significant digits of precision.
I don't want to sound rude (because I super appreciate the work you all do), but just for the sake of context please note python's matplotlib can plot 15 significant digits of precision (which is what you'd expect from a double-precision platform).
damonturney
on 4 Feb 2020
The ylims=(0.12000000000,0.12000000002) is an important piece of the MWE because it seems the underlying bug is in the rectangle definition in the SET_WINDOW subroutine, which is most clearly illustrated by the bug's dependence on which values ylims is set to (or which values are default automatically set via the data you are trying to plot).
damonturney
on 4 Feb 2020
Just for the record. There's no doubt that matplotlib is a more complete platform. It has age/maturity, userbase, a big developer team and massive funding (e.g. from the Chan-Zuckerberg foundation).
mkborregaard
on 4 Feb 2020
Totally appreciate that fact, and all your hard work.
The only reason I compared it to matplotlib was to see if it's technically possible to do this plot. Because for all I knew it might have been impossible.
damonturney
on 5 Feb 2020
I changed the behaviour in GR#master, but the labeling is incorrect (as in Plots). In Matplotlib it doesn't look much better. Only MATLAB provides a reasonable axis display, although, with more than 13 significant digits MATLAB also produces identical ticks due to rounding errors.
jheinen
on 5 Feb 2020
BTW: You will now get one(!) warning message (GKS: Possible loss of precision in routine SET_WINDOW). Once the labeling problem is solved (in GR), I will raise the threshold for this warning.
jheinen
on 5 Feb 2020
The problem should be fixed in GR master - it can't be, that MPL is better than GR here 😂😂😂
using GR

setwsviewport(0, 0.16, 0, 0.12)
setwswindow(0, 1, 0, 0.75)
setviewport(0.175, 0.975, 0.075, 0.7)
setwindow(0, 1, 0.12000000000, 0.12000000002)
setcharheight(0.015)
settextfontprec(1, 0)

axes2d(0.04, 1.0000000000000002e-12, 0.0, 0.12, 5, 5, 0.0075)
grid(0.04, 1.0000000000000002e-12, 0, 0, 5, 5)
polyline([0, 1], [0.12000000000, 0.12000000002])
updatews()
As soon as this functionality works stable, I will also remove the warnings again. Will improve the viewport size in a future step ...

The above solution is "close" to the MATLAB result.
jheinen
on 6 Feb 2020
Related issues
 PallHaraldsson
·
4Comments
PallHaraldsson
·
4Comments
 Cody-G
·
3Comments
Cody-G
·
3Comments
 pkofod
·
3Comments
pkofod
·
3Comments
 jebej
·
4Comments
jebej
·
4Comments
 lstagner
·
5Comments
lstagner
·
5Comments
Most helpful comment
The problem should be fixed in GR master - it can't be, that MPL is better than GR here 😂😂😂
As soon as this functionality works stable, I will also remove the warnings again. Will improve the viewport size in a future step ...

The above solution is "close" to the MATLAB result.