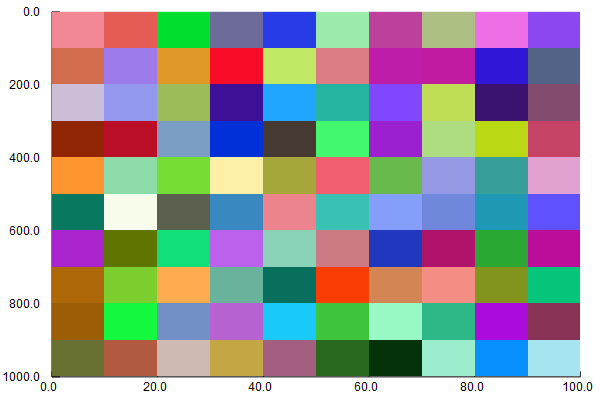
The original idea was to plot an RGB image.
This lead to these:
using Plots, Images
img = colorview(RGB, rand(3, 100,100))
# these work:
plot(img)
heatmap(img)
x = 1:100
y = 1:100
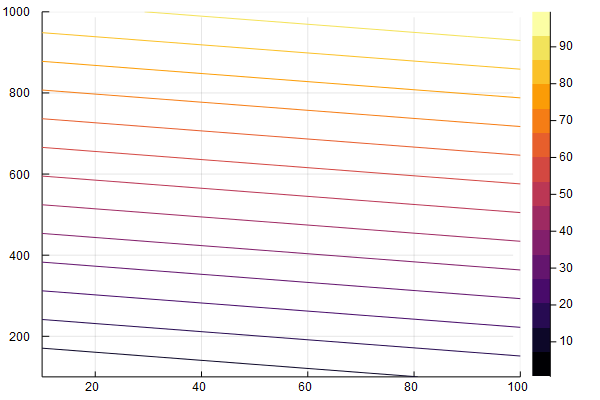
# this draws lines, instead of changing the scale of the axis:
plot(x, y, img)
# this changes the colomap, instead of changing the scale of the axis:
heatmap(x, y, img)
 yakir12
All 25 comments
There is a section in the documentation that shows which scales are supported in which backends. They are set using symbols. See here
 rand5
on 28 Nov 2017
rand5
on 28 Nov 2017
I assume you are referring to my comment about the scales of the axis. I'm sorry to have mislead you. I didn't mean scales as in logarithmic or linear. I meant that if I plot an image, the x and y axis will denote the pixel locations. But if I want to change that to some other specific x and y (e.g. 3:6:600) then it seems natural to me that heatmap(x, y, img) should work (or instead of heatmap use some other dedicated plotting function intended for images). But it doesn't.
yakir12
on 29 Nov 2017
The range of the axes is set via xlim and ylim, for example heatmap(img,xlim=(1,50)) or plot(img,xlim=(1,50)). If you want to plot every nth pixel, the most straight forward to do this is to down-sample the input data, i.e. heatmap(img[1:5:end,1:5:end]). Axes are addressed here in the docs. The behavior of heatmap(x, y, img) is the intended behavior.
rand5
on 29 Nov 2017
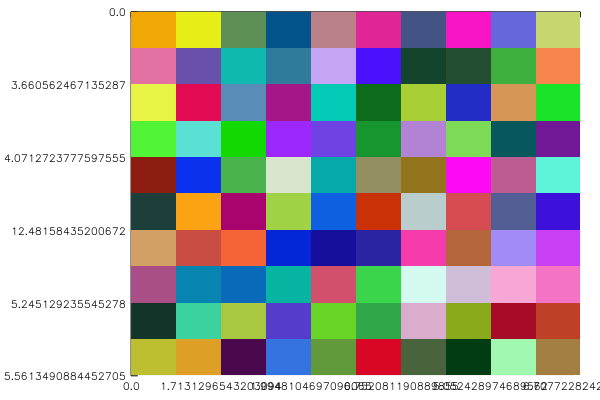
I see what you are expecting @yakir12.
You'd like
using Plots, Images
img = colorview(RGB, rand(3, 10,10))
plot(10:10:100, 100:100:1000, img)
to produce something like this, right?:
I did this with plot(img, xformatter = x -> 10x, yformatter = y -> 100y)
That is not possible right now, because in the image recipe the x and y values are fixed to 1:m, 1:n here https://github.com/JuliaPlots/Plots.jl/blob/master/src/series.jl#L328
On the one hand, I see your point that your expected behavior would be natural (it works with heatmap without images: heatmap(10:10:100, 100:100:1000, rand(10, 10)) and I don't understand the image that is produced instead:
On the other hand, I'm not really sure what such images should look like, if the vectors x and y you want to pass are not ranges, but arbitrary vectors (like rand(10)) instead. After all, x and y denote the the discrete positions of the pixels to be colored in a matrix. So maybe using formatter or passing ticks = (locations, labels) is the cleaner solution?
 daschw
on 29 Nov 2017
daschw
on 29 Nov 2017
img = colorview(RGB, rand(3, 10,10))
FWIW you don't need to use this 2-step process to generate random images.
julia> img = rand(RGB, 10, 10)
10×10 Array{RGB{Float64},2}:
[...]
 Evizero
on 29 Nov 2017
Evizero
on 29 Nov 2017
You are correct @daschw. Thank you!
The x and y should only be ranges, no need for random locations (not sure what that would mean either). So your xformatter = x -> 10x solution is cool! So for an offset I'd just do xformatter = x -> 10x + x_offset.
yakir12
on 29 Nov 2017
So I tried it a bit and the problem now is the number of digits after the decimal point when the formatter includes fractional numbers. So something like this:
plot(img, xformatter = x -> rand()*x, yformatter = y -> 3*rand()*y)
looks like this:
yakir12
on 2 Dec 2017
You could just use round in the formatter:
plot(img, xformatter = x -> round(rand()*x, 2), yformatter = y -> round(3*rand()*y, 2))
🤦
yakir12
on 3 Dec 2017
@rand5: the approach you suggests seems to currently be broken if one wants to the y-axis to go from negative below to positive above, e.g. doing something like ylim=(90.0,-90.0) on a world-map to set the correct Longitudes gives me ylim scaled from 90.00 (on top) to 91.00 (on the bottom), i.e. the direction is still wrong...
 natschil
on 14 Mar 2018
natschil
on 14 Mar 2018
@natschil Could you post a minimum working example?
 BA1437
on 14 Mar 2018
BA1437
on 14 Mar 2018
@BA1437 The image I'm currently using is a bit large, but if you have some image file the following fails for me:
using FileIO
image = load("path_to_image.tif")
plot(image, ylim=(90.0,-90.0))
The y-coordinate is always increasing when going down (I should probably add that I am using the GR backend).
natschil
on 14 Mar 2018
BA1437
on 14 Mar 2018
ylim always is a tuple (ymin, ymax) with ymin < ymax. If ymin >= ymax, Plots sets ymax = ymin + 1. The ymin value just appears above the ymax value for images because yflip is set true in that case.
So in your case @natschil ylim = (-90, 90) should do what you expect, right?
daschw
on 15 Mar 2018
@natschil If you want the image to be flipped vertically you can do yflip = false, If you only want the tick labels to be changed from negative to positive and vice versa you can do yformatter = x -> -x
daschw
on 15 Mar 2018
@daschw I don't want the image to be flipped vertically, but the coordinates used by Plots.jl (i.e. I want scatter!(xs,ys) to correctly show up on top of the image). If yflip = false is supposed to do this then there is a bug somewhere (it has absolutely no affect as far as I can tell on GR)
natschil
on 16 Mar 2018
using Plots
using TestImages
img = testimage("lighthouse")

# plot the image reversing the first dimension and setting yflip = false
plot([-π, π], [-1, 1], img[end:-1:1, :], yflip = false)
# plot other data
plot!(sin, -π, π, lw = 3, color = :red)
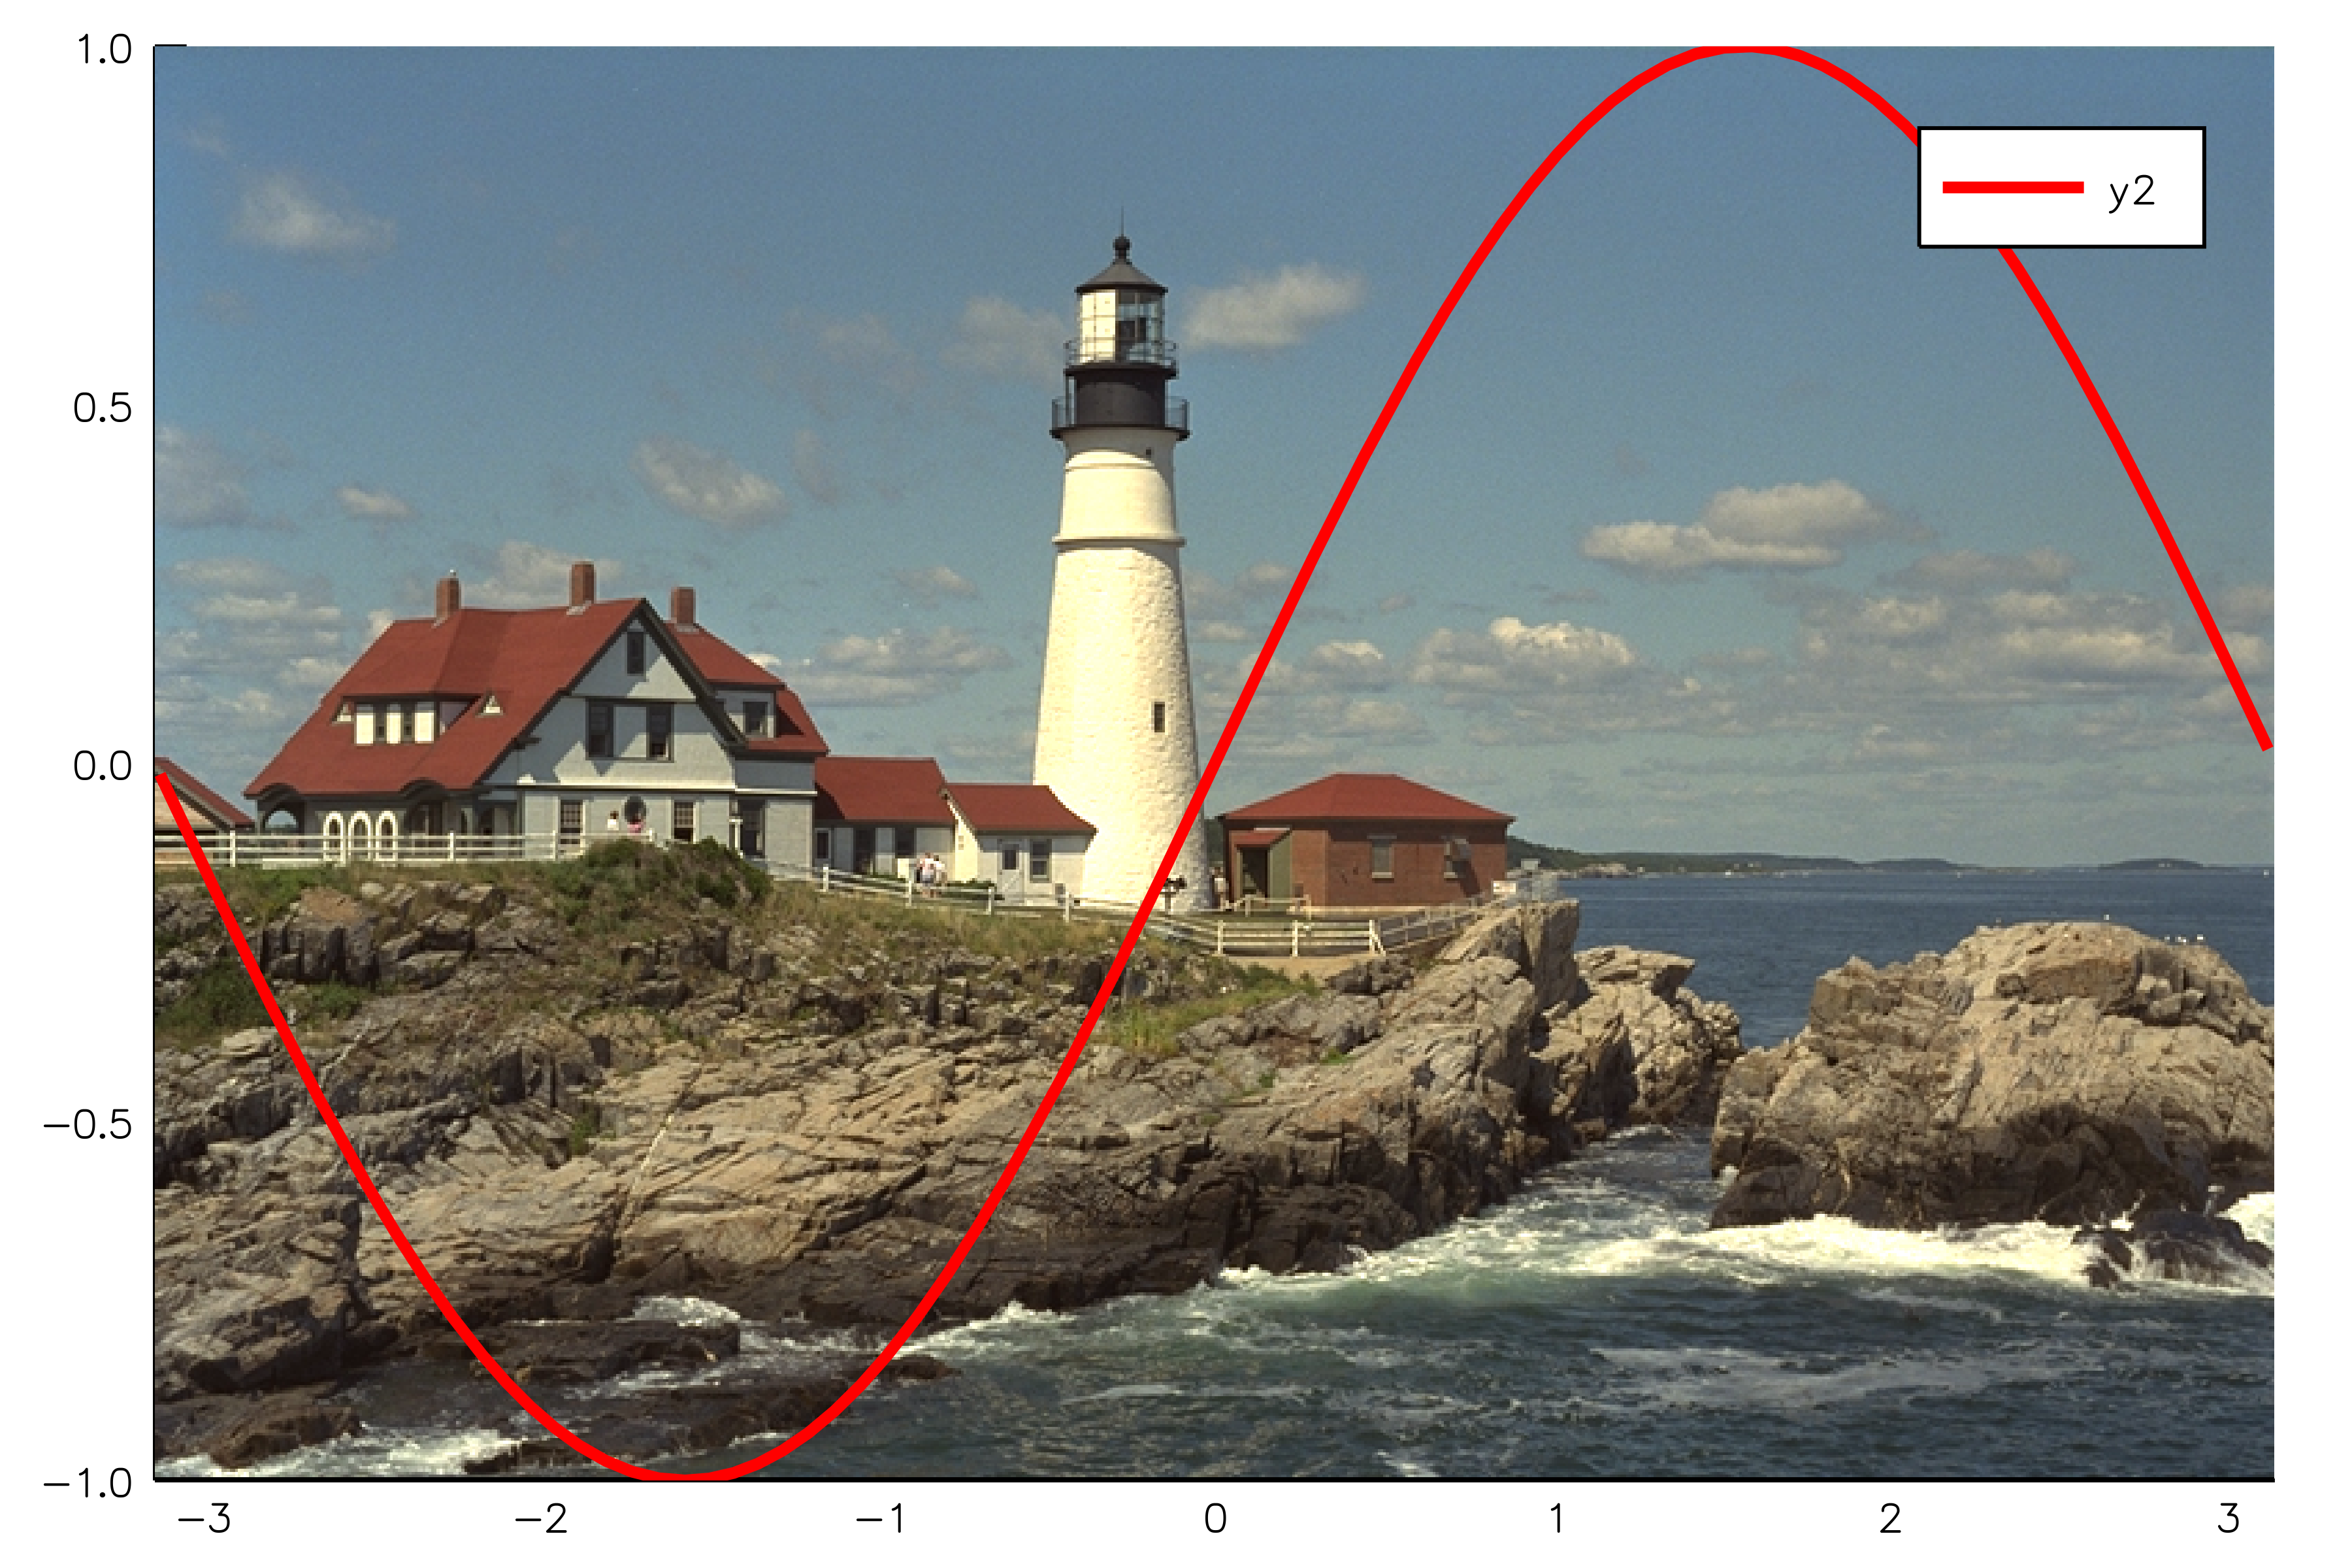
daschw
on 16 Mar 2018
This is broken in 1.0, running the code above results in the following image:

natschil
on 27 Aug 2018
Wow, thanks for reporting. So, the plot(img[end:-1:1,:], yflip = true) actually works in itself, it's adding the axes that makes it fail
 mkborregaard
on 27 Aug 2018
mkborregaard
on 27 Aug 2018
Yes. Do you know what could be causing this/whether there is a workaround?
natschil
on 26 Nov 2018
Hello, any update on this? It worked for me a few months ago, but now it’s not working again.
 logankilpatrick
on 11 Mar 2019
logankilpatrick
on 11 Mar 2019
no updates, sorry.
mkborregaard
on 11 Mar 2019
It used to work for me in Julia v0.7, without selecting a backend. Now it does not work. Any work arounds?
logankilpatrick
on 11 Mar 2019
Could you try the plotly backend? That used to be the default.
mkborregaard
on 11 Mar 2019
Should be fixed in #1951.
daschw
on 12 Mar 2019
Related issues
 dancsi
·
4Comments
dancsi
·
4Comments
 crstnbr
·
3Comments
crstnbr
·
3Comments
 nebuta
·
3Comments
nebuta
·
3Comments
 Cody-G
·
4Comments
Cody-G
·
4Comments
 Krastanov
·
3Comments
Krastanov
·
3Comments
Most helpful comment
FWIW you don't need to use this 2-step process to generate random images.