Plots.jl: scientific format doesn't work from v0.12.3 (GR)
10^i along y axis is not properly formatted from Plots.jl v.0.12.3 (GR).
Please see the following code:
using Plots
gr()
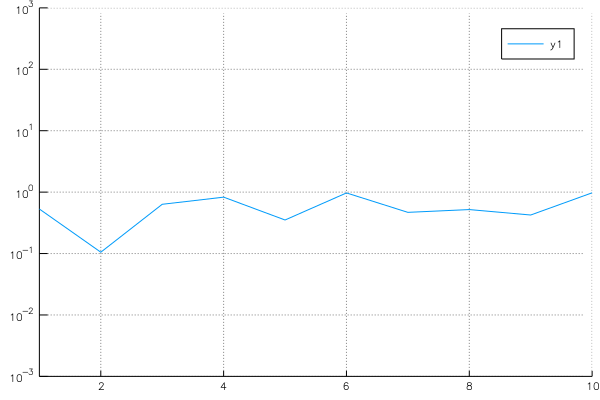
plot(abs(rand(10)), yaxis=(:log10, (1e-3,1e3)))
savefig("gr.png")
v0.12.2:
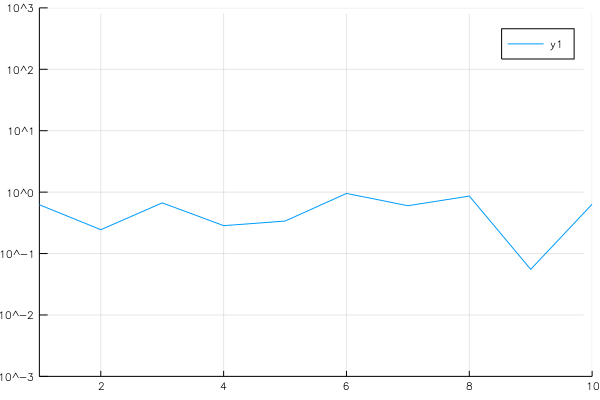
v0.12.3:
Thank you for your development,
 y-nkt
y-nkt
All 5 comments
I'm very sorry that I missed the following:
"GR no longer automatically handles _ and ^ in texts"
https://github.com/JuliaPlots/Plots.jl/releases/tag/v0.12.3
Could you suggest how to automatically handle the scientific format >v0.12.3 ?
y-nkt
on 24 Oct 2017
This is a bug created by that change. Thanks for reporting.
 mkborregaard
on 24 Oct 2017
mkborregaard
on 24 Oct 2017
A hacky way would be to add "\\ " to the end of every tick so that it gets dispatched to GR.textext() instead of GR.text().
 apalugniok
on 15 Nov 2017
apalugniok
on 15 Nov 2017
👍3
not too hacky I think
mkborregaard
on 15 Nov 2017
I'll try it out and see how it behaves.
apalugniok
on 15 Nov 2017
Was this page helpful?
0 / 5 - 0 ratings
Related issues
 tbreloff
·
45Comments
tbreloff
·
45Comments
 floswald
·
53Comments
floswald
·
53Comments
 mauro3
·
46Comments
mauro3
·
46Comments
 rolfdstoll
·
36Comments
rolfdstoll
·
36Comments
 ChrisRackauckas
·
37Comments
ChrisRackauckas
·
37Comments
Most helpful comment
A hacky way would be to add "\\ " to the end of every tick so that it gets dispatched to
GR.textext()instead ofGR.text().