Plots.jl: Cannot view plots in Plots pane in Juno for JuliaPro 0.6.0.1
I am getting an error similar to TheFourSymbols. I am on Juno for JuliaPro 0.6.0.1. When I execute the following command in the console:
using Plots
plot(rand(4,4))
I get :
Any[4]
PyObject
PyObject
PyObject
PyObject
and nothing in the Plot pane.
If I add"gui()" to the above commands, I get "
No current plot/subplot
in gui at Plots\src\output.jl:134
in current at Plots\srcplot.jl:15"
Can someone please tell me what I am doing wrong? Here is a screenshot:
image

 sindhujapr
All 13 comments
Executing the whole script does not produce any plot, however, if I run the plot line only, a plot comes up on the pane. (You didn't set any backend, so by default Plots.jl takes gr(). Notice that gr() and plotlyjs() are not giving any plot pane with the gui() call so far. https://github.com/JuliaPlots/Plots.jl/issues/581)
You could try doing (https://github.com/JuliaPlots/Plots.jl/issues/537):
using Plots
plt = plot(rand(4,4))
display(plt)
It worked for me.
 lnacquaroli
on 11 Oct 2017
lnacquaroli
on 11 Oct 2017
Thanks for your quick reply, Inacquaroli. The commands you gave me, again does not show the plot. Instead I get this:
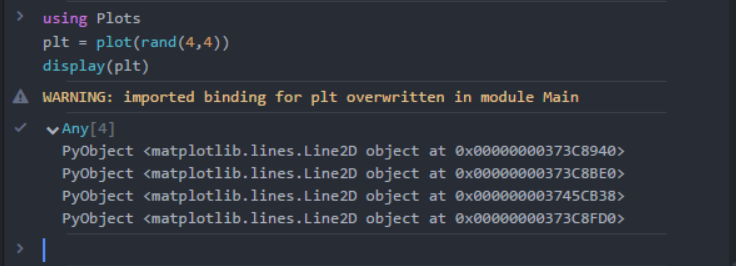
Is the warning relevant in this scenario? The console shown here is the Atom console. Are there any setting I am missing?
Thanks in advance.
sindhujapr
on 11 Oct 2017
Try setting one backend at least after using Plots. Depending which one you have installed: pyplot(), plotlyjs(), gr().
lnacquaroli
on 11 Oct 2017
Yes, I had tried that earlier, but it didn't help:
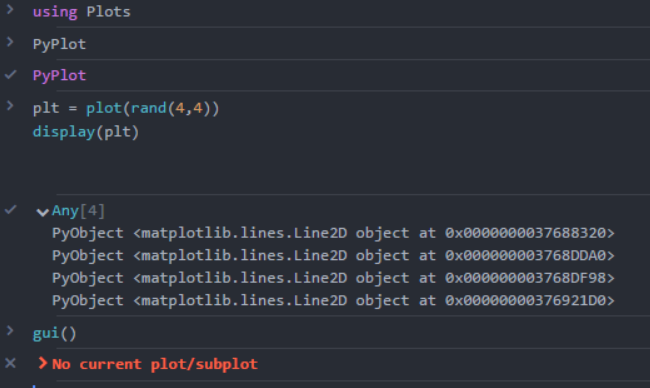
I feel like I am missing something basic.
sindhujapr
on 11 Oct 2017
The correct syntax is
using Plots
pyplot()
With this backend gui() should do.
lnacquaroli
on 11 Oct 2017
Oh sorry about that mess up! But this still won't work :(

sindhujapr
on 11 Oct 2017
It looks like you have a using PyPlot somewhere earlier. Try to open a new session and post all the code you're typing.
 mkborregaard
on 11 Oct 2017
mkborregaard
on 11 Oct 2017
Ok, I opened a new session and typed:
using Plots
pyplot()
WARNING: Couldn't initialize pyplot. (might need to install it?)
INFO: To do a standard install of pyplot, copy and run this:
if !Plots.is_installed("PyPlot")
Pkg.add("PyPlot")
end
withenv("PYTHON" => "") do
Pkg.build("PyPlot")
end
now restart julia!
InitError: PyCall.PyError("ccall(@pysym(:PyImport_ImportModule), PyPtr, (Cstring,), name)", PyCall.PyObject(Ptr{PyCall.PyObject_struct} @0x000000005c9a23e0), PyCall.PyObject(Ptr{PyCall.PyObject_struct} @0x0000000035869e48), PyCall.PyObject(Ptr{PyCall.PyObject_struct} @0x0000000000000000))
plt = plot(rand(4,4))
display(plt)
WARNING: Couldn't initialize pyplot. (might need to install it?)
INFO: To do a standard install of pyplot, copy and run this:
if !Plots.is_installed("PyPlot")
Pkg.add("PyPlot")
end
withenv("PYTHON" => "") do
Pkg.build("PyPlot")
end
now restart julia!
PyError (ccall(@pysym(:PyImport_ImportModule), PyPtr, (Cstring,), name))
if !Plots.is_installed("PyPlot")
Pkg.add("PyPlot")
end
withenv("PYTHON" => "") do
Pkg.build("PyPlot")
end
INFO: Building Conda
INFO: Building PyCall
INFO: Using the Python distribution in the Conda package by default.
To use a different Python version, set ENV["PYTHON"]="pythoncommand" and re-run Pkg.build("PyCall").
WARNING:
Compat.UTF8String is deprecated, use String instead.
likely near C:\Users\sparimal\AppData\Local\JuliaPro-0.6.0.1pkgs-0.6.0.1\v0.6\PyCall\deps\build.jl:184
INFO: PyCall is using C:\Users\sparimal\AppData\Local\JuliaPro-0.6.0.1pkgs-0.6.0.1\v0.6\Conda\deps\usrpython.exe (Python 2.7.13) at C:\Users\sparimal\AppData\Local\JuliaPro-0.6.0.1pkgs-0.6.0.1\v0.6\Conda\deps\usrpython.exe, libpython = C:\Users\sparimal\AppData\Local\JuliaPro-0.6.0.1pkgs-0.6.0.1\v0.6\Conda\deps\usrpython27
INFO: C:\Users\sparimal\AppData\Local\JuliaPro-0.6.0.1pkgs-0.6.0.1\v0.6\PyCall\deps\deps.jl has not changed
INFO: C:\Users\sparimal\AppData\Local\JuliaPro-0.6.0.1pkgs-0.6.0.1\v0.6\PyCall\deps\PYTHON has not changed
pyplot()
plt = plot(rand(4,4))
display(plt)
WARNING: redefining constant pycolors
WARNING: redefining constant pypath
WARNING: Couldn't initialize pyplot. (might need to install it?)
INFO: To do a standard install of pyplot, copy and run this:
if !Plots.is_installed("PyPlot")
Pkg.add("PyPlot")
end
withenv("PYTHON" => "") do
Pkg.build("PyPlot")
end
now restart julia!
PyError (ccall(@pysym(:PyImport_ImportModule), PyPtr, (Cstring,), name))
Plots
Git
GitHub (preview)
Initialize this project directory with a git repository
Create repository
Looks like pyplot() is not installed properly.
sindhujapr
on 11 Oct 2017
Ok, so I restarted Julia and it works now! Thank you!
I am a beginner to using Julia and the IDE. So, jsut out of curiosity, why does "using PyPlots" prevent "pyplot"? Does it clash with "using Plots"?
sindhujapr
on 11 Oct 2017
Plots make use of the backends calling them in a different way than in their standalone versions.
Refer to the docs for further reference.
lnacquaroli
on 11 Oct 2017
Ok, thank you!
sindhujapr
on 11 Oct 2017
I am not sure if I should open a new issue for this. If I wanted to plot a histogram:
https://gist.github.com/gizmaa/7214002#histogram
how can I visualize that?
I require "using PyPlot" for the histogram, but then if I use plot for any other figure in that code, it won't get displayed as now "plot" from "Plots" and "PyPlot" interfere with each other. (cause of my original issue).
sindhujapr
on 13 Oct 2017
x = randn(1000)
using Plots
histogram(x)
Related issues
 tbenst
·
3Comments
tbenst
·
3Comments
 nebuta
·
3Comments
nebuta
·
3Comments
 pkofod
·
3Comments
pkofod
·
3Comments
 Cody-G
·
4Comments
Cody-G
·
4Comments
 kersulis
·
5Comments
kersulis
·
5Comments
Most helpful comment
Executing the whole script does not produce any plot, however, if I run the
plotline only, a plot comes up on the pane. (You didn't set any backend, so by defaultPlots.jltakesgr(). Notice thatgr()andplotlyjs()are not giving any plot pane with thegui()call so far. https://github.com/JuliaPlots/Plots.jl/issues/581)You could try doing (https://github.com/JuliaPlots/Plots.jl/issues/537):
using Plotsplt = plot(rand(4,4))display(plt)It worked for me.