Plots.jl: How to plot contourf with GR?
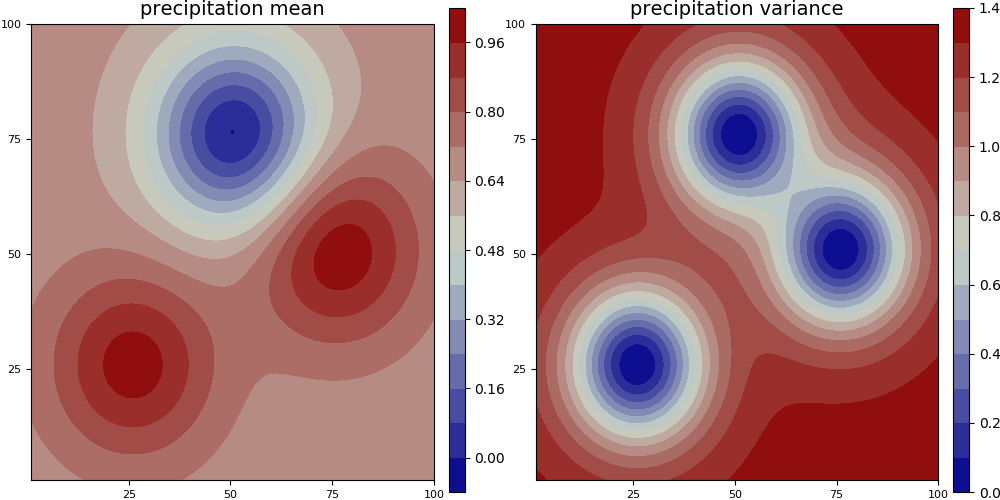
When I specify the seriestype :contourf with PyPlot and PlotlyJS, I get a nice colored contour map:
With GR, the contours don't show up:

but I know that GR is capable of drawing these colored contours, see the illustration in the homepage: https://gr-framework.org
 juliohm
All 23 comments
cc: @jheinen
juliohm
on 19 Aug 2017
This looks weird, is it screenshots or based on savefig?
 mkborregaard
on 31 Aug 2017
mkborregaard
on 31 Aug 2017
@mkborregaard these are screenshots, and I think I have read other threads for which I don't have the URLs unfortunately where people discuss the difference between heatmaps, contour plots and etc. in GR and other backends. It would be nice to have GR working here, I am trying to rely on it the most in my package and tutorials.
juliohm
on 31 Aug 2017
Can you post an MWE to replicate? It makes it easier to troubleshoot.
mkborregaard
on 31 Aug 2017
I have one tutorial that is working with the master branch, but it may break soon, as I am trying to transition the problem definitions to a separate package: https://github.com/juliohm/GeoStats.jl/blob/master/examples/EstimationProblems.ipynb
juliohm
on 31 Aug 2017
I'm currently busy, but I'll check this ASAP. Kind of a color quantization in GR might help ...
 jheinen
on 31 Aug 2017
jheinen
on 31 Aug 2017
@juliohm : where is GeoDataFrame defined?
# inform the coordinates of the data
geodata = GeoDataFrame(df, [:x,:y])
ERROR: UndefVarError: GeoDataFrame not defined
Hi Josef, it should be in GeoStats.jl master branch, I can check it
tomorrow...
On Aug 31, 2017 11:00 PM, "Josef Heinen" notifications@github.com wrote:
@juliohm https://github.com/juliohm : where is GeoDataFrame defined?
inform the coordinates of the data
geodata = GeoDataFrame(df, [:x,:y])
ERROR: UndefVarError: GeoDataFrame not defined—
You are receiving this because you were mentioned.
Reply to this email directly, view it on GitHub
https://github.com/JuliaPlots/Plots.jl/issues/1024#issuecomment-326496228,
or mute the thread
https://github.com/notifications/unsubscribe-auth/ADMLbbwljIFbw6idnLTE2V9ELZB3Z46eks5sd52TgaJpZM4O8YTq
.
juliohm
on 1 Sep 2017
I'm already on GeoStats master - will try another MWE ...
jheinen
on 1 Sep 2017
Sorry, I may have corrupted the master branch with the transitions to
GeoStatsBase.jl. Any plot recipe with contourf reproduces the issue though.
Thank you again for looking into this, I'm going to bed, but will double
check tomorrow morning where the GeoDataFrame ended up.
On Aug 31, 2017 11:05 PM, "Josef Heinen" notifications@github.com wrote:
I'm already on GeoStats master - will try another MWE ...
—
You are receiving this because you were mentioned.
Reply to this email directly, view it on GitHub
https://github.com/JuliaPlots/Plots.jl/issues/1024#issuecomment-326496798,
or mute the thread
https://github.com/notifications/unsubscribe-auth/ADMLbapaEUS1N9i7iXAj4X0MgWbqrVneks5sd56UgaJpZM4O8YTq
.
juliohm
on 1 Sep 2017
Color quantization produces pixelated results - we have to implement a dedicated function in GR. So there is no short-time solution - I put it onto our TODO list ;-)
jheinen
on 1 Sep 2017
Thank you @jheinen, whenever you find time :-)
juliohm
on 1 Sep 2017
I want this feature so much :sob: @jheinen from what I understood there is no function in the GR framework at the moment for filled contour plots, is that correct? I would try to wrap the function myself if it was already there waiting to be called.
juliohm
on 27 Nov 2017
The glvisualize backend has it :) admittedly, I only recently got around to create a color legend but only in Makie, though :(
 SimonDanisch
on 27 Nov 2017
SimonDanisch
on 27 Nov 2017
Nice @SimonDanisch, it is great that we have so many options at our disposal. I will switch to Makie when plot recipes are in place and working smoothly. I see the huge benefit of adding interactivity and I am looking forward to see the package mature.
juliohm
on 27 Nov 2017
Apparenly this has been resolved in GR
https://github.com/jheinen/GR.jl/issues/165#issuecomment-438518409
Is there anything that should be done to make it work on Plots.jl?
 aramirezreyes
on 5 Jan 2019
aramirezreyes
on 5 Jan 2019
Yes, the Plots GR backend needs to actually call GR's contourf function for the contourf seriestype. I think @jheinen looked into this?
mkborregaard
on 6 Jan 2019
I made a PR (#1880) to support the new contourf function.
jheinen
on 6 Jan 2019
Awesome!
mkborregaard
on 6 Jan 2019
There is still some problem with the contour routines in GR. Will fix them soon and tag a new GR release next week ...
jheinen
on 6 Jan 2019
What problems @jheinen ? They seem to be working wonderfully now :heart:
juliohm
on 8 Jan 2019
I fixed it yesterday - was a problem in v0.36.0+ versions.
jheinen
on 8 Jan 2019
Thanks for the good work!
On Jan 8, 2019, at 10:28 AM, Josef Heinen notifications@github.com wrote:
I fixed it yesterday - was a problem in v0.36.0+ versions.
—
You are receiving this because you commented.
Reply to this email directly, view it on GitHub https://github.com/JuliaPlots/Plots.jl/issues/1024#issuecomment-452402559, or mute the thread https://github.com/notifications/unsubscribe-auth/AGqzeYV71f1iqFaSlzsnOPzV-zwPauHcks5vBONRgaJpZM4O8YTq.
aramirezreyes
on 8 Jan 2019
Related issues
 dancsi
·
4Comments
mkborregaard
·
3Comments
dancsi
·
4Comments
mkborregaard
·
3Comments
 jebej
·
4Comments
jebej
·
4Comments
 apalugniok
·
3Comments
apalugniok
·
3Comments
 lstagner
·
5Comments
lstagner
·
5Comments
Most helpful comment
I made a PR (#1880) to support the new
contourffunction.