Pinpoint: Pinpoint with SpringBoot with embedded Tomcat 8 captures only first request
Description
I'm trying to integrate pinpoint with my Spring Boot 1.5.2 and 1.5.4 application deployed on embedded tomcat. As per the different post and issues, I've set profiler.tomcat.conditional.transform=false and also profiler.applicationservertype=TOMCAT. Setting this property allowed my application to be shown in the pinpoint web UI, but what I noticed is only the first request to my application (REST API) is traced and subsequent calls are not traced/collected. Below screenshot shows my application vm args on how javaagent is configured

Also the call stack for the first and only capture request doesn't include the Spring component/resources involved int the call. (see below screenshot)
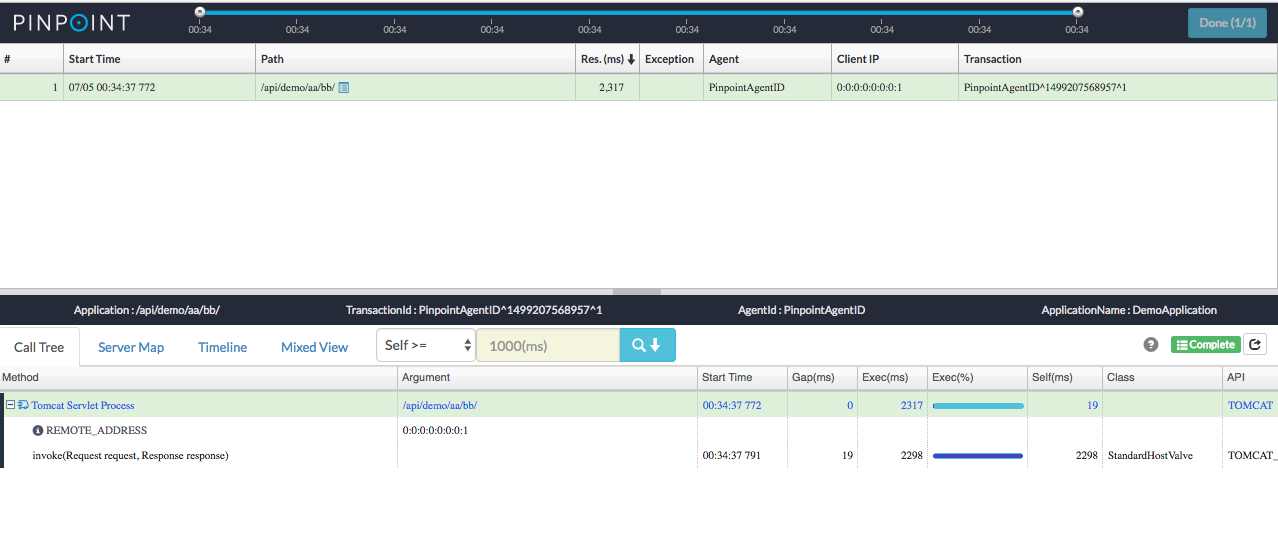
Is there anything which I'm missing in configuration or is this a known bug or something?
Environment
- Pinpoint version: 1.6.2
- OS: macos Sierra & Ubuntu 16.04
- Additional details (e.g. how your collector/web is set up): Deployed pinpoint-web (as ROOT) and pinpoint-collector on Tomcat 8
Additional Info
 jaykhimani
All 2 comments
hi jaykhimani
please check you're profiler.sampling.rate option in pinpoint.config
profiler.sampling.rate option governs how often the agent traces transactions. If you set this option to 2 the agent will trace once every 2 transactions (50% sampling), if you set it to 10 it'll trace once every 10 transaction (10% sampling) and default is 20. (5% sampling).
 koo-taejin
on 5 Jul 2017
koo-taejin
on 5 Jul 2017
Awesome, Thanks. It worked like a charm.
jaykhimani
on 5 Jul 2017
Related issues
 sarakavi
·
6Comments
sarakavi
·
6Comments
 xulongju
·
3Comments
xulongju
·
3Comments
 ing-arriola
·
4Comments
ing-arriola
·
4Comments
 CHENTIANHAO123
·
4Comments
CHENTIANHAO123
·
4Comments
 geniuszhe
·
3Comments
geniuszhe
·
3Comments
Most helpful comment
hi jaykhimani
please check you're profiler.sampling.rate option in pinpoint.config
profiler.sampling.rate option governs how often the agent traces transactions. If you set this option to 2 the agent will trace once every 2 transactions (50% sampling), if you set it to 10 it'll trace once every 10 transaction (10% sampling) and default is 20. (5% sampling).