Picongpu: Manual plotting
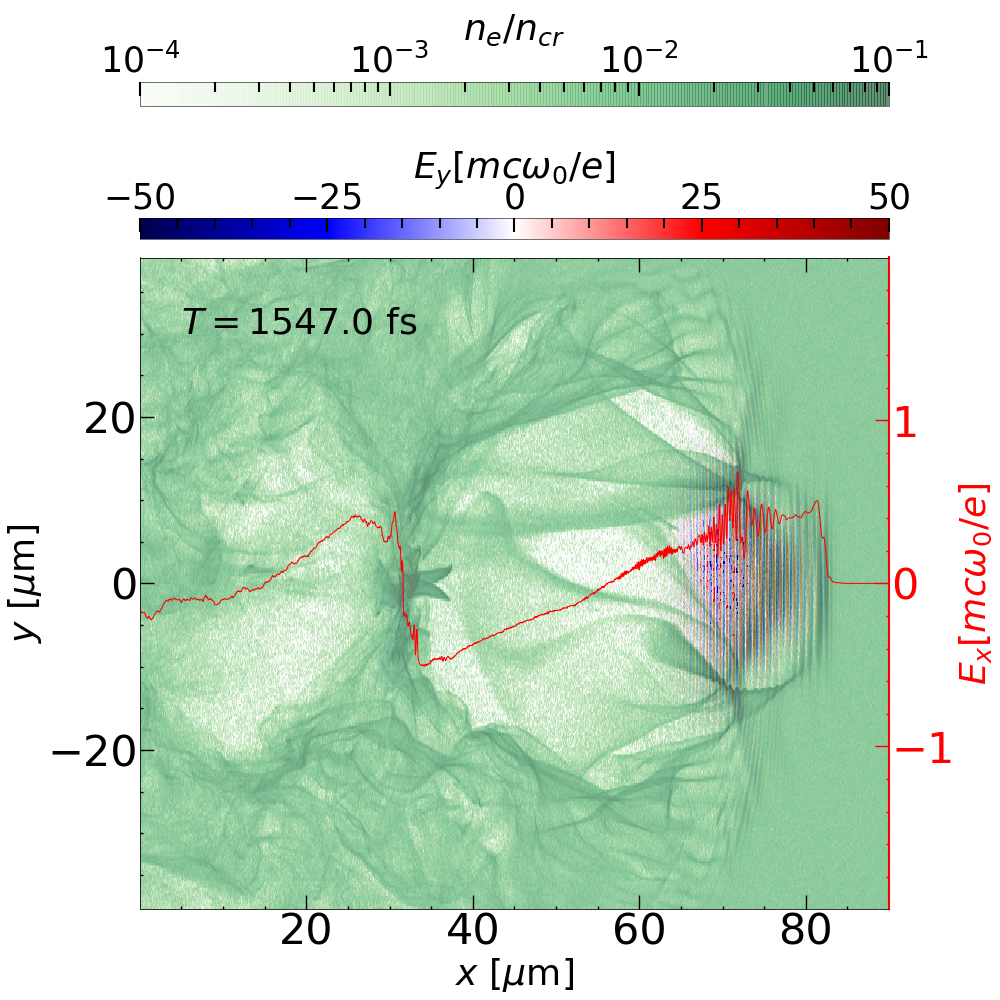
Hi, I used openPMD viewer to visualize the time series and it look great with all unitSI ready. However, I would like to plot something else, such as the combination of field+density+lineout in a single picture. How could I do that?
 StevE-Ong
All 8 comments
There are many post-processing options in PIConGPU and most of them are, as you already found, automatizable and scriptable via Python workflows.
https://picongpu.readthedocs.io/en/latest/postprocessing/python.html
Specific openPMD-viewer questions would be ideally directed in its repo: https://github.com/openPMD/openPMD-viewer/ This is probably the fastest option towards what you try to achieve.
Otherwise you can also use openPMD-api to read the data manually and plot it with matplotlib. Or even more low-level, read via the h5py or adios python API.
Our plugins for HDF5 and ADIOS, the latter with some limitations currently, support the openPMD-standard which standardizes the data. For plotting, you are free to use what you prefer (e.g. matplotlib).
 ax3l
on 5 Oct 2019
ax3l
on 5 Oct 2019
Thank you for @ax3l replies. I can plot with imshow with y-axis horizontal. But the axis is on grid value. I have been looking for where to find the grid information so that i can do X, Y = np.meshgrid(grid_x,grid_y) and turn to micron. Or is there any method I can do so in openPMD but I yet to find it out?
StevE-Ong
on 5 Oct 2019
To get grid information using the API follow this example https://openpmd-api.readthedocs.io/en/latest/usage/firstread.html to open a mesh record, in this case the electric field:
 # record
E = i.meshes["E"]
then you can convert an array index to meters in the following way:
( E.grid_global_offset + E.grid_spacing * cell_index_to_convert) * E.grid_unit_SI
Also, to get the tics on axes in si units rather than in cells, you can set the range with the extent parameter.
 pordyna
on 7 Oct 2019
pordyna
on 7 Oct 2019
Thanks for @pordyna reply. May I know what is the cell_index_to_convert? Is it a function in opempmd or i have to replaced by something?
StevE-Ong
on 8 Oct 2019
@StevE-Ong I believe @pordyna meant the index in a dataset in question. So his equation describes transforming the index space (which you can query for) into the physical coordinate space - the transformation which you have been wondering about, if I understood it right.
 sbastrakov
on 8 Oct 2019
sbastrakov
on 8 Oct 2019
@sbastrakov Sorry, I still do not get it. I am not familiar with the language and I can't find any example. The reasons I am doing this instead of using the prepared script is that I want to stop twisting my neck. I am not sure if we can initialize laser in X,if so, it would be great.
So far I could dig out the following:
[('axisLabels', array([b'z', b'y', b'x'], dtype='|S2')),
 ('dataOrder', b'C'),
 ('fieldSmoothing', b'none'),
 ('geometry', b'cartesian'),
 ('gridGlobalOffset', array([    0.        , 11339.09495759,     0.        ])),
 ('gridSpacing', array([11.118882 ,  2.0847757, 11.118882 ], dtype=float32)),
 ('gridUnitSI', 2.1079007306896e-08),
 ('timeOffset', 0.0),
 ('unitDimension', array([ 1.,  1., -3., -1.,  0.,  0.,  0.]))]
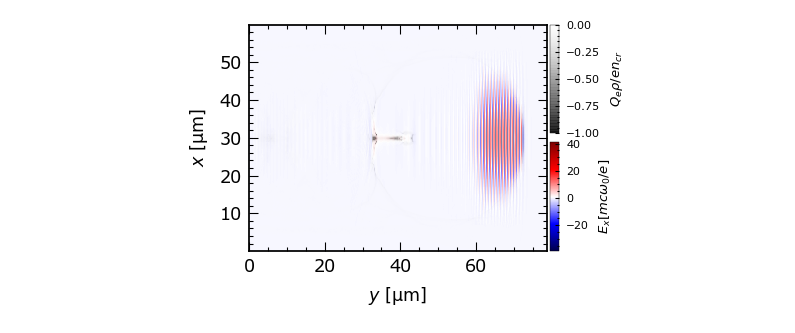
For the picture in the first thread (from other pic code), I could find where is the grid and its name:
Grid_slice <class 'sdf.BlockPlainMesh'> [2049,  257,    7]
Grid_slice_mid <class 'sdf.BlockPlainMesh'> [2048,  256,    6]
So that I could do the following when plotting and proceed to add more plots
 x  = data['Grid/Grid_mid'].data[0]/1.0e-6
 y  = data['Grid/Grid_mid'].data[1]/1.0e-6
X, Y = np.meshgrid(x, y)
I am appreciated if someone could show me some examples which I could have missed somewhere. Thanks.
StevE-Ong
on 11 Oct 2019
@StevE-Ong
If I understand your question correctly, I think that it could be done rather easily through openPMD-viewer: for instance:
Ex, info = ts.get_field('E', 'x')
X, Y = np.meshgrid( info.x, info.y, indexing='ij' )
Does that answer your question?
 RemiLehe
on 11 Oct 2019
RemiLehe
on 11 Oct 2019
@RemiLehe Thank you for your reply. With your suggestion I got the following:
---------------------------------------------------------------------------
AttributeError                            Traceback (most recent call last)
<ipython-input-230-7a5487485102> in <module>
      1 Ex, info = ts.get_field('E', 'x')
----> 2 X, Y = np.meshgrid( info.x, info.y, indexing='ij' )
      3 X = X*1e6
      4 Y=Y*1e6
      5 extent = np.min(X), np.max(X), np.min(Y), np.max(Y)

AttributeError: 'FieldMetaInformation' object has no attribute 'y'
Instead, I did the following:
step_x=E.attrs["gridSpacing"][0]*E.attrs["gridUnitSI"]*1e6
step_y=E.attrs["gridSpacing"][1]*E.attrs["gridUnitSI"]*1e6
n_points_x = E_x.attrs["_global_size"][0]
n_points_y = E_x.attrs["_global_size"][1]

start_x = E_x.attrs["position"][0]*step_x
start_y = E_x.attrs["position"][1]*step_y

end_x = start_x + (n_points_x - 1) * step_x
end_y = start_y + (n_points_y - 1) * step_y

x =np.linspace(start_x, end_x, n_points_x, endpoint=True)
y =np.linspace(start_y, end_y, n_points_y, endpoint=True)

X, Y = np.meshgrid(y, x)
extent = np.min(X), np.max(X), np.min(Y), np.max(Y)
I obtained the grid without offset (which is OK for me at the moment).
StevE-Ong
on 14 Oct 2019
Related issues
 mikewang2000
·
3Comments
mikewang2000
·
3Comments
 berceanu
·
4Comments
ax3l
·
3Comments
berceanu
·
4Comments
ax3l
·
3Comments
 psychocoderHPC
·
4Comments
ax3l
·
4Comments
psychocoderHPC
·
4Comments
ax3l
·
4Comments