Pi-hole: Pi-Hole goes offline for several minutes after adding entry to whitelist
In raising this issue, I confirm the following: {please fill the checkboxes, e.g: [X]}
- [X] I have read and understood the contributors guide.
- [X] The issue I am reporting can be replicated.
- [X] The issue I am reporting isn't a duplicate (see FAQs, closed issues, and open issues).
How familiar are you with the the source code relevant to this issue?:
0/10
Expected behaviour:
Adding an entry to the whitelist has no effect on the responsiveness of Pi-Hole
Actual behaviour:
Adding an entry to the whitelist results in Pi-Hole becoming unresponsive and failing to respond to DNS query for several minutes.
Steps to reproduce:
- Go to Query Log
- Click "Whitelist" button beside a blocked request
- Wait a few seconds
- Attempt to load a web page or refresh the Pi-Hole admin interface
- Observe that the page will not respond until several minutes later
Debug token provided by uploading pihole -d log:
https://tricorder.pi-hole.net/7z28q0fqn0
Troubleshooting undertaken, and/or other relevant information:
Hardware: Raspberry Pi Zero W
This was not occurring before I updated to the latest version of Pi-Hole
 stewx
stewx
All 60 comments
Debug log looks fine, can you open an SSH session to the Pi-hole and run something like htop or top and see if the system utilization is spiking when you click "whitelist"? Or check uptime after things are responsive again and look at the load average: values.
 dschaper
on 22 Jun 2020
dschaper
on 22 Jun 2020
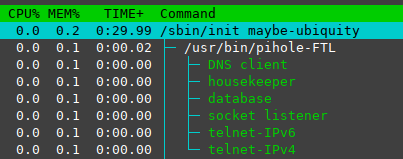
Pi-Hole uses almost 100% of CPU after I add a domain to the whitelist:
[image: image.png]
On Mon, 22 Jun 2020 at 15:42, Dan Schaper notifications@github.com wrote:
Debug log looks fine, can you open an SSH session to the Pi-hole and run
something like htop or top and see if the system utilization is spiking
when you click "whitelist"? Or check uptime after things are responsive
again and look at the load average: values.—
You are receiving this because you authored the thread.
Reply to this email directly, view it on GitHub
https://github.com/pi-hole/pi-hole/issues/3507#issuecomment-647704721,
or unsubscribe
https://github.com/notifications/unsubscribe-auth/ABVJTOZ2GUHGCZB7OVLSOL3RX6Q2BANCNFSM4OEQOGOQ
.
stewx
on 22 Jun 2020

stewx
on 22 Jun 2020
I also get the same high CPU usage when removing an entry from the whitelist
On Mon, 22 Jun 2020 at 15:45, Stewart Rand stewartrand@gmail.com wrote:
Pi-Hole uses almost 100% of CPU after I add a domain to the whitelist:
[image: image.png]
On Mon, 22 Jun 2020 at 15:42, Dan Schaper notifications@github.com
wrote:Debug log looks fine, can you open an SSH session to the Pi-hole and run
something like htop or top and see if the system utilization is spiking
when you click "whitelist"? Or check uptime after things are responsive
again and look at the load average: values.—
You are receiving this because you authored the thread.
Reply to this email directly, view it on GitHub
https://github.com/pi-hole/pi-hole/issues/3507#issuecomment-647704721,
or unsubscribe
https://github.com/notifications/unsubscribe-auth/ABVJTOZ2GUHGCZB7OVLSOL3RX6Q2BANCNFSM4OEQOGOQ
.
stewx
on 22 Jun 2020
Can you enable some of the debugging configuration flags and we can see if there are any abnormalities being logged. See https://docs.pi-hole.net/ftldns/configfile/#debugging-options for the options.
dschaper
on 22 Jun 2020
I added debugging and did pihole restartdns. Now when I add or remove entries from the whitelist, there is no performance issue.
stewx
on 22 Jun 2020
@DL6ER If you get a chance?
dschaper
on 22 Jun 2020
The debug options always only add output, they do not make anything go faster. Can you try again with all debug options disabled if you can get again the slow behavior?
For htop it will be interesting to see which of the FTL components is using the 100%.
Use F5 to get into tree view mode and then use F2 Arrow Down (Display options) +
 DL6ER
on 22 Jun 2020
DL6ER
on 22 Jun 2020
I have turned off debug logs and tried again. I can't reproduce the issue anymore. Running pihole restartdns the first time seems to have fixed whatever the problem was. To reproduce it, perhaps you would need to upgrade from the previous version on a Pi Zero W and inspect the process/debug logs without running the restart command.
stewx
on 23 Jun 2020
@stewx I have experienced a similar issue on my own setup, on a Raspberry Pi 3 Model B, it seems to have started happening when I upgraded from v4 to v5. If I whitelist an entry from the query log, DNS requests will time-out and stall sometimes for 10-30 seconds. I haven't checked CPU usage at that time - I'm afraid I'm not super adept at Linux/etc. yet. - but I was able to run the htop command and see this, @DL6ER:
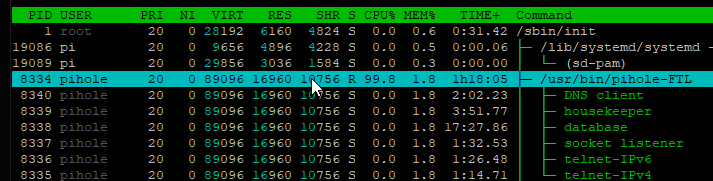
Unfortunately it doesn't seem like the CPU usage is high on the child processes, but on the main pihole-FTL one?
 nicholashead
on 30 Jun 2020
nicholashead
on 30 Jun 2020
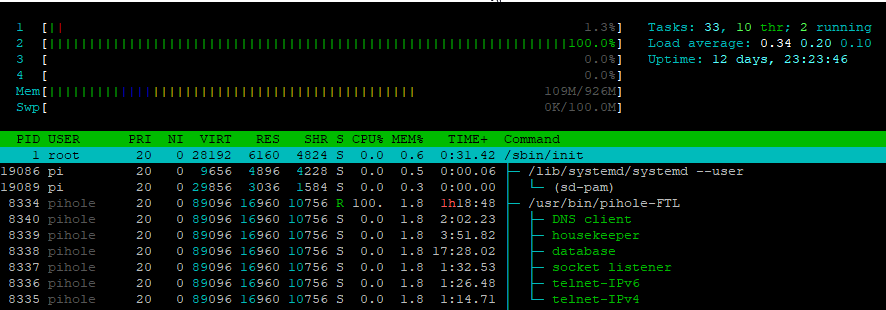
Here's what happened when I removed the whitelisted entry:
nicholashead
on 30 Jun 2020
Just to be clear: The lag goes away after those 10-30 seconds and everything returns to normal operation, right? And this happens again when you whitelist the next item?
Could you share snippets from /var/log/pihole.log and /var/log/pihole-FTL.log around the time you see such a stall?
DL6ER
on 30 Jun 2020
@DL6ER yes, after like 20-30 seconds (max usually), the pihole seems to serve DNS requests again properly.
I enabled DEBUG_ALL=true and then restarted FTL - and now it's not delaying when I add/remove entries, similar to what stewx reported above.
So it may be something like a memory leak or something that gets worse the longer FTL is running?
I'll let it run for a bit like this and see if I can get it to stall again, with the debug logging going.
nicholashead
on 30 Jun 2020
Very strange, thanks for keeping an eye on it. I'm frequently running my entire Pi-hole through the memory checker valgrind to ensure there are no memory leaks, but I cannot catch all possible config combinations, of course. Nevertheless, I don't think there is a memory leak here as the memory usage in your htop screenshots is still low (~ 1%) so this cannot really cause a slowdown.
The debug details should tell us more what is keeping your FTL busy on/during reloading. Thanks!
DL6ER
on 30 Jun 2020
@DL6ER not sure if this helps - but I started to notice at least 4-5 seconds of lag now - and so I posted my FTL logs: https://gist.github.com/nicholashead/fe09c65b515492b597b09a48162cb5fc
Hopefully it can point in some direction. I started an operation to remove a blocklist item around 10:13:45, and then around 10:13:53 I could receive a result again.
To my untrained eye, it looks like this op is taking a short while:
[2020-07-02 10:13:46.264 25705] Querying count of distinct domains in gravity database table vw_gravity
[2020-07-02 10:13:49.796 25705] Querying count of distinct domains in gravity database table vw_regex_blacklist
and then this:
[2020-07-02 10:13:49.930 25705] Compiled 5 whitelist and 0 blacklist regex filters in 134.4 msec
[2020-07-02 10:13:53.458 25705] Waiting for lock in _FTL_new_query() (src/dnsmasq_interface.c:428)
[2020-07-02 10:13:53.458 25705] Obtained lock for _FTL_new_query() (src/dnsmasq_interface.c:428)
nicholashead
on 2 Jul 2020
I have what I think is the same issue. It also happens when clicking Enable/Disable on the interface.
I've posted my logs here: https://pastebin.com/kVGAdhes
The logs start from when I click the button.
You can see that:
After
[2020-07-06 10:09:39.923 10740] Querying count of distinct domains in gravity
database table vw_gravity
there are no logs for ~20 seconds.After
[2020-07-06 10:10:01.130 10740] 0 / 4 upstream server host names resolvedthere are no longs for ~12 seconds.After
[2020-07-06 10:10:13.820 10740] Compiled 0 whitelist and 0 blacklist regex
filters in 332.4 msec
there are no logs for ~12 seconds.After
[2020-07-06 10:10:40.312 10740] Removed lock in process_request()
(src/api/request.c:38)
there are no logs for ~5 seconds.
From the start of the logs until 10:10:45 the CPU was at 100%, and queries were not being resolved. I agree with reports that the problem goes away for some time after restarting (e.g. to enable debug logging).
 jstockwin
on 6 Jul 2020
jstockwin
on 6 Jul 2020
This issue has been mentioned on Pi-hole Userspace. There might be relevant details there:
https://discourse.pi-hole.net/t/dns-resolution-unexpectedly-stops-after-upgrade-to-5-0/34678/31
 pralor-bot
on 6 Jul 2020
pralor-bot
on 6 Jul 2020
@nicholashead @jstockwin @stewx Please try
pihole checkout ftl tweak/gravity_counting_logging
@DL6ER Thanks for the quick turnaround. I'm now running from that branch, and it works fine. However, I'll need to try it in a few days/weeks to confirm it's worked since it's always better after a restart.
jstockwin
on 6 Jul 2020
Have the same issue, since about two weeks Pi-hole is not responding for about 30 seconds when temporarily disabling or changing the filters. v5 was working fine for about 1 month since upgrading from v4.
100% CPU, Pi 3.
 martijnb92
on 8 Jul 2020
martijnb92
on 8 Jul 2020
https://github.com/pi-hole/FTL/pull/829 likely fixes this issue and will be included in Pi-hole v5.1
DL6ER
on 8 Jul 2020
@DL6ER I still seem to have the same issue (having switched to that branch).
The logs are here: https://pastebin.com/B77KxWCm
Again, I tried to insert whitespace when nothing seemed to be happening to make it clearer. The log starts when I click disable.
After
[2020-07-06 10:09:39.923 10740] Querying count of distinct domains in gravity
database table vw_gravity
there is a ~20 second gap.After
[2020-07-06 10:10:01.130 10740] 0 / 4 upstream server host names resolvedthere is a ~12 second gap.After
[2020-07-06 10:10:13.820 10740] Compiled 0 whitelist and 0 blacklist regex
filters in 332.4 msec
there is a ~9 second gapAfter
[2020-07-06 10:10:40.312 10740] Removed lock in process_request()
(src/api/request.c:38)
there is a ~5 second gap.
During all of the above the CPU was at 100%.
jstockwin
on 14 Jul 2020
@jstockwin We are already one step further into the right direction (hopefully). Please update your Pi-hole to receive the latest version of this custom branch. Everything included here (except some extra logging) will also be included in Pi-hole v5.1
DL6ER
on 14 Jul 2020
Same behaviour with 5.1.1. It became unusable since I upgraded to V5...
 fl0wfr
on 27 Jul 2020
fl0wfr
on 27 Jul 2020
@fl0wfr have you tried the most recent version of release/v5.1.1 ? If you're unsure, please check out the meanwhile existing release/v5.2
DL6ER
on 27 Jul 2020
I just want to say I still have this issue anytime I turn Pi-Hole blocking temporarily, like for 5 minutes. Once the time elapses, the Pi-Hole goes offline for quite a while and I can't browse. I will try the new version soon
stewx
on 6 Aug 2020
I am running 5.1.1 and appear to still have the problem, for what it's worth. Glad to help debug any further as needed. Thanks for all the help so far, devs!
nicholashead
on 6 Aug 2020
Same behaviour with v5.1.1. I can't update Pi-Hole to v5.2, pihole -up only sees v5.1.1 as latest version.
fl0wfr
on 6 Aug 2020
I also am still experiencing this on 5.1.1. let me know if more logs are
helpful at this stage...
On Thu, 6 Aug 2020, 21:51 fl0wfr, notifications@github.com wrote:
Same behaviour with v5.1.1. I can't update Pi-Hole to v5.2, pihole -up
only sees v5.1.1 as latest version.—
You are receiving this because you were mentioned.
Reply to this email directly, view it on GitHub
https://github.com/pi-hole/pi-hole/issues/3507#issuecomment-670185481,
or unsubscribe
https://github.com/notifications/unsubscribe-auth/AB6YXL3TXOOSEG2W5P3K4BLR7MJTZANCNFSM4OEQOGOQ
.
jstockwin
on 6 Aug 2020
dschaper
on 6 Aug 2020
You may be experiencing a different issue. The fix which worked for a few other users has been merged 16 days ago into release/v.5.1.1. @dschaper is right, please try
pihole checkout ftl release/v5.2
to get the latest version code now. If you still see delays, we have to start a new special branch for you where we add a ton of debug messages. The delay is likely somewhere in the details of the algorithms...
Can you already share a few information bits like which device are you running Pi-hole on, how many domains on the block lists, how many black/whitelist entries, how many of them are regex, how many clients do you typically have in your networks and how many queries over 24 hrs on average?
DL6ER
on 7 Aug 2020
You may be experiencing a different issue. The fix which worked for a few other users has been merged 16 days ago into
release/v.5.1.1. @dschaper is right, please trypihole checkout ftl release/v5.2to get the latest version code now. If you still see delays, we have to start a new special branch for you where we add a ton of debug messages. The delay is likely somewhere in the details of the algorithms...
Can you already share a few information bits like which device are you running Pi-hole on, how many domains on the block lists, how many black/whitelist entries, how many of them are regex, how many clients do you typically have in your networks and how many queries over 24 hrs on average?
Running on a NanoPi Neo2 1GB, Ubuntu 18.04.4 LTS.
477k domains on blocklist, 159 whitelisted domains (3 are regex), 5 blacklisted domains (2 are regex). I have 13 clients in my network and around a million queries per day.
fl0wfr
on 7 Aug 2020
a million queries per day.
Wow. That's a lot with 13 clients...
 yubiuser
on 7 Aug 2020
yubiuser
on 7 Aug 2020
a million queries per day.
Wow. That's a lot with 13 clients...
Well, most of the queries come from a Zabbix and an Observium hosts, and these queries are cached.
fl0wfr
on 7 Aug 2020
@fl0wfr Thanks for the info. Do the clients with the many queries mostly request the same domain or are they querying different domains?
Can you also provide the output of
ls -lh /dev/shm/FTL-*
so we can get a feeling for the size of the clients/domains and cache memory sizes?
DL6ER
on 8 Aug 2020
@fl0wfr Thanks for the info. Do the clients with the many queries mostly request the same domain or are they querying different domains?
Can you also provide the output ofls -lh /dev/shm/FTL-*so we can get a feeling for the size of the clients/domains and cache memory sizes?
-rw------- 1 pihole pihole 324K Aug 8 09:04 /dev/shm/FTL-clients
-rw------- 1 pihole pihole 144 Aug 7 18:17 /dev/shm/FTL-counters
-rw------- 1 pihole pihole 80K Aug 8 11:45 /dev/shm/FTL-dns-cache
-rw------- 1 pihole pihole 192K Aug 8 11:38 /dev/shm/FTL-domains
-rw------- 1 pihole pihole 56 Aug 7 18:17 /dev/shm/FTL-lock
-rw------- 1 pihole pihole 44K Aug 7 18:17 /dev/shm/FTL-overTime
-rw------- 1 pihole pihole 4.0K Aug 7 18:17 /dev/shm/FTL-per-client-regex
-rw------- 1 pihole pihole 48M Aug 8 11:45 /dev/shm/FTL-queries
-rw------- 1 pihole pihole 12 Aug 7 18:17 /dev/shm/FTL-settings
-rw------- 1 pihole pihole 168K Aug 8 11:44 /dev/shm/FTL-strings
-rw------- 1 pihole pihole 4.0K Aug 7 18:17 /dev/shm/FTL-upstreams
fl0wfr
on 8 Aug 2020
The last fix increased the performance of the cache cleaning. However, the cache is very small in your case,
80K Aug 8 11:45 /dev/shm/FTL-dns-cache
so this explains why our previous fix didn't work for you. I'll come up with a special branch for you where we can again monitor what is causing the delay. I'll come back to you.
DL6ER
on 8 Aug 2020
The last fix increased the performance of the cache cleaning. However, the cache is very small in your case,
80K Aug 8 11:45 /dev/shm/FTL-dns-cache
so this explains why our previous fix didn't work for you. I'll come up with a special branch for you where we can again monitor what is causing the delay. I'll come back to you.
Sure, let me know ;)
fl0wfr
on 8 Aug 2020
By the way, I upgraded to 5.2 and the issue is still present.
fl0wfr
on 30 Aug 2020
So nothing improved or is there at least some improvement but still too slow?
DL6ER
on 30 Aug 2020
So nothing improved or is there at least some improvement but still too slow?
Hi, unfortunately nothing improved...
fl0wfr
on 30 Aug 2020
@fl0wfr I also saw your other posts in #3667 and also your comment about that v4.x was more stable. Well, in general, this does not seem to be the case, the vast majority of users if more happy with v5.x. We currently have only a few "real" bugs open we're trying to pin down. There is a major difference between v4 and v5 (causing the major version jump) that is that we introduced a database backend with the latest version. But the other major change was the per-client blocking which was an often-requested feature.
Unfortunately, I guess you expect that, this new flexibility made the code more complex in a few places. My last improvements targeted a possible delay down at systems with many clients + many different domains. So your cause lies somewhere else.
I know I wrote
I'll come up with a special branch for you where we can again monitor what is causing the delay. I'll come back to you.
and it is entirely my fault to not have done this by now. I forgot about it, even when this still on the top of my TODO list. Well, real life came in my way and I haven't looked at this list in a long time. I will keep this tab open and will address this tomorrow after I returned from work. Thanks for your patience. We will (somehow) get this bug squashed. Hopefully, it won't mean the NanoPi + a million queries is underpowered, however, I don't think so, yet.
DL6ER
on 30 Aug 2020
@fl0wfr I also saw your other posts in #3667 and also your comment about that v4.x was more stable. Well, in general, this does not seem to be the case, the vast majority of users if more happy with v5.x. We currently have only a few "real" bugs open we're trying to pin down. There is a major difference between v4 and v5 (causing the major version jump) that is that we introduced a database backend with the latest version. But the other major change was the per-client blocking which was an often-requested feature.
Unfortunately, I guess you expect that, this new flexibility made the code more complex in a few places. My last improvements targeted a possible delay down at systems with many clients + many different domains. So your cause lies somewhere else.
I know I wrote
I'll come up with a special branch for you where we can again monitor what is causing the delay. I'll come back to you.
and it is entirely my fault to not have done this by now. I forgot about it, even when this still on the top of my TODO list. Well, real life came in my way and I haven't looked at this list in a long time. I will keep this tab open and will address this tomorrow after I returned from work. Thanks for your patience. We will (somehow) get this bug squashed. Hopefully, it won't mean the NanoPi + a million queries is underpowered, however, I don't think so, yet.
No worries, I'll be patient, in the meantime, I restart Pi-Hole everytime I whitelist a domain (and it doesn't happen a lot).
I really appreciate your help, when you will have some time to push a branch, I'll test it and let you know :)
fl0wfr
on 30 Aug 2020
So, first attempt already made:
pihole checkout ftl fix/fl0wfr_slowness
Please run this command and add a domain to your whitelist. The log file (/var/log/pihole-FTL.log) will be filled with some content, look for Reloading DNS cache which is marking the beginning. We can work from there and add further details into further functions when we found which is the slow part.
DL6ER
on 30 Aug 2020
So, first attempt already made:
pihole checkout ftl fix/fl0wfr_slownessPlease run this command and add a domain to your whitelist. The log file (
/var/log/pihole-FTL.log) will be filled with some content, look forReloading DNS cachewhich is marking the beginning. We can work from there and add further details into further functions when we found which is the slow part.
I just tried, here are the only 2 lines logged after adding or removing entry from whitelist:
[2020-08-30 22:05:11.284 18717M] Received: Real-time signal 0 (34 -> 0)
[2020-08-30 22:05:11.284 18717M]  Flushing message table
fl0wfr
on 30 Aug 2020
Problem is fixed for me after upgrading to 5.1.2.
martijnb92
on 30 Aug 2020
@fl0wfr Okay, so FTL gets stuck when working with the database. Please add
DEBUG_DATABASE=true
to your /etc/pihole/pihole-FTL.conf (create it if it does not exist), restart pihole-FTL and try again.
Are there more log lines this time?
DL6ER
on 31 Aug 2020
@fl0wfr Okay, so FTL gets stuck when working with the database. Please add
DEBUG_DATABASE=trueto your
/etc/pihole/pihole-FTL.conf(create it if it does not exist), restartpihole-FTLand try again.
Are there more log lines this time?
No more log lines. I noticed that if I added a domain in whitelist that I previously removed, the issue didn't happen.
Then I tried with some random domain and issue happens without more logs:
2020-08-31 07:51:47.613 30587M] Received: Real-time signal 0 (34 -> 0)
[2020-08-31 07:51:47.613 30587M]  Flushing message table
I carefully restarted Pi-Hole after adding DEBUG_DATABASE=true in config file.
fl0wfr
on 31 Aug 2020
@fl0wfr Please update once again. However, before you do this, add
DEBUG_LOCKS=true
Just an idea: Did you try out other branches before? Like new/mac_clients ?
DL6ER
on 31 Aug 2020
@fl0wfr Please update once again. However, before you do this, add
DEBUG_LOCKS=trueJust an idea: Did you try out other branches before? Like
new/mac_clients?
[2020-08-31 23:37:09.807 19797M] Received: Real-time signal 0 (34 -> 0)
[2020-08-31 23:37:09.808 19797M]  Flushing message table
[2020-08-31 23:37:09.808 19797M] Opening database
[2020-08-31 23:37:09.808 19797M] Locking database
[2020-08-31 23:37:32.115 19797/T19838] Waiting for lock in process_request() (/root/project/src/api/request.c:36)
[2020-08-31 23:37:32.115 19797/T19838] Obtained lock for process_request() (/root/project/src/api/request.c:36)
[2020-08-31 23:37:32.116 19797/T19838] Removed lock in process_request() (/root/project/src/api/request.c:38)
[2020-08-31 23:37:32.123 19797/T19838] Waiting for lock in process_request() (/root/project/src/api/request.c:50)
[2020-08-31 23:37:32.123 19797/T19838] Obtained lock for process_request() (/root/project/src/api/request.c:50)
[2020-08-31 23:37:32.123 19797/T19838] Removed lock in process_request() (/root/project/src/api/request.c:52)
[2020-08-31 23:37:32.166 19797/T19838] Waiting for lock in process_request() (/root/project/src/api/request.c:50)
[2020-08-31 23:37:32.166 19797/T19838] Obtained lock for process_request() (/root/project/src/api/request.c:50)
[2020-08-31 23:37:32.167 19797/T19838] Removed lock in process_request() (/root/project/src/api/request.c:52)
[2020-08-31 23:37:32.210 19797/T19838] Waiting for lock in process_request() (/root/project/src/api/request.c:57)
[2020-08-31 23:37:32.210 19797/T19838] Obtained lock for process_request() (/root/project/src/api/request.c:57)
[2020-08-31 23:37:32.211 19797/T19838] Removed lock in process_request() (/root/project/src/api/request.c:59)
[2020-08-31 23:37:32.256 19797/T19838] Waiting for lock in process_request() (/root/project/src/api/request.c:64)
[2020-08-31 23:37:32.256 19797/T19838] Obtained lock for process_request() (/root/project/src/api/request.c:64)
[2020-08-31 23:37:32.256 19797/T19838] Removed lock in process_request() (/root/project/src/api/request.c:66)
[2020-08-31 23:37:32.298 19797/T19838] Waiting for lock in process_request() (/root/project/src/api/request.c:78)
[2020-08-31 23:37:32.298 19797/T19838] Obtained lock for process_request() (/root/project/src/api/request.c:78)
[2020-08-31 23:37:32.299 19797/T19838] Removed lock in process_request() (/root/project/src/api/request.c:80)
[2020-08-31 23:37:45.069 19797/T19843] Waiting for lock in process_request() (/root/project/src/api/request.c:85)
[2020-08-31 23:37:45.070 19797/T19843] Obtained lock for process_request() (/root/project/src/api/request.c:85)
[2020-08-31 23:37:45.077 19797/T19843] Removed lock in process_request() (/root/project/src/api/request.c:87)
[2020-08-31 23:38:02.118 19797/T19850] Waiting for lock in process_request() (/root/project/src/api/request.c:36)
[2020-08-31 23:38:02.119 19797/T19850] Obtained lock for process_request() (/root/project/src/api/request.c:36)
[2020-08-31 23:38:02.119 19797/T19850] Removed lock in process_request() (/root/project/src/api/request.c:38)
[2020-08-31 23:38:02.128 19797/T19850] Waiting for lock in process_request() (/root/project/src/api/request.c:50)
[2020-08-31 23:38:02.128 19797/T19850] Obtained lock for process_request() (/root/project/src/api/request.c:50)
[2020-08-31 23:38:02.128 19797/T19850] Removed lock in process_request() (/root/project/src/api/request.c:52)
[2020-08-31 23:38:02.170 19797/T19850] Waiting for lock in process_request() (/root/project/src/api/request.c:50)
[2020-08-31 23:38:02.170 19797/T19850] Obtained lock for process_request() (/root/project/src/api/request.c:50)
[2020-08-31 23:38:02.171 19797/T19850] Removed lock in process_request() (/root/project/src/api/request.c:52)
[2020-08-31 23:38:02.214 19797/T19850] Waiting for lock in process_request() (/root/project/src/api/request.c:57)
[2020-08-31 23:38:02.215 19797/T19850] Obtained lock for process_request() (/root/project/src/api/request.c:57)
[2020-08-31 23:38:02.215 19797/T19850] Removed lock in process_request() (/root/project/src/api/request.c:59)
[2020-08-31 23:38:02.258 19797/T19850] Waiting for lock in process_request() (/root/project/src/api/request.c:64)
[2020-08-31 23:38:02.259 19797/T19850] Obtained lock for process_request() (/root/project/src/api/request.c:64)
[2020-08-31 23:38:02.259 19797/T19850] Removed lock in process_request() (/root/project/src/api/request.c:66)
[2020-08-31 23:38:02.302 19797/T19850] Waiting for lock in process_request() (/root/project/src/api/request.c:78)
[2020-08-31 23:38:02.302 19797/T19850] Obtained lock for process_request() (/root/project/src/api/request.c:78)
[2020-08-31 23:38:02.302 19797/T19850] Removed lock in process_request() (/root/project/src/api/request.c:80)
The issue appeared while using master branch. The only branches I used since the issue appeared were the 5.2 and the one you created for my tests.
fl0wfr
on 31 Aug 2020
Interesting, so it cannot obtain a lock on the database:
[2020-08-31 23:37:09.808 19797M] Locking database
This happens only very rarely and - so far - has always been correlated with a fatal error in the database on-disk. Can you search for the last occurrence of
Locking database: Success
and copy a few lines afterwards? There should hopefully be an SQL error message telling us what is going wrong. This would also show us if we can repair the database or if there is a more fundamental problem (such as file corruption).
DL6ER
on 1 Sep 2020
Unfortunately there's no success entries in log file. Maybe I should delete the database and start from a new one?
fl0wfr
on 1 Sep 2020
Yes, please try this
DL6ER
on 1 Sep 2020
That's weird, I deleted gravity.db, restarted Pi-Hole, ran pihole -g. Now the whitelist and blacklist are lost and there are only 2 adlists remaining.
I also noticed errors with SQLite DB structure:
2020-09-01 12:04:24.016 2139M] SQLite3 message: no such table: message in "DELETE FROM message;" (1)
[2020-09-01 12:04:24.018 2139M] ERROR: SQL query "DELETE FROM message;" failed: SQL logic error
[2020-09-01 12:04:24.018 2139M] ERROR: flush_message_table() failed!
2020-09-01 12:05:00.061 2139/T2144] SQLite3 message: no such table: network in "SELECT name FROM network WHERE id = (SELECT network_id FROM network_addresses WHERE ip = ?);" (1)
[2020-09-01 12:05:00.061 2139/T2144] getDatabaseHostname("127.0.0.1") - SQL error prepare: SQL logic error
fl0wfr
on 1 Sep 2020
You should have deleted /etc/pihole/pihole-FTL.db
Not gravity.db
I hope you mv instead of rm ?
Otherwise you can at least regenerate the pre-v5 state by running
pihole -g -r
My bad, I rm instead of mv...
And now with a new gravity.db, if I add an adlist, same behaviour and the adlist is never downloaded. So I'm stuck with the 2 default adlists... I guess I'm good for a fresh install, Pi-Hole is completely misbehaving...
fl0wfr
on 1 Sep 2020
I wouldn't go this far yet. Please try to mv the pihole.db database and run pihole restartdns
DL6ER
on 1 Sep 2020
I wouldn't go this far yet. Please try to
mvthepihole.dbdatabase and runpihole restartdns
I have a backup on another Pi-Hole instance. I removed all .db files, move back to master branch, checked out, imported my lists and it seems to work.
fl0wfr
on 1 Sep 2020
Don't mean to interrupt - but I wanted to chime in and say that I'm updated to latest (5.1.2 pihole, 5.1.1 web, 5.2 ftl) and still get weird locking/delays when adjusting my list.
Most notably right now I'm trying to clean up my whitelist -and I deleted like 10 entries in a row (in web UI). And now clicking on another entry just stalls and finally shows an error message saying database is locked. Not sure if it's related.
However my resolver seems to be still working during this locked DB time - so that's good, right?
nicholashead
on 3 Sep 2020
@nicholashead We take special care that any database issues cannot affect the resolver so connectivity doesn't get interrupted.
I think the issue you are seeing is caused by too many signals arriving (each time you press the button for adding or deleting a whitelist blacklist item on the dashboard) while other database operations are still ongoig. we solve this in the next version by usingan action queing system that ensures that new database operations are only done when the previous operations are finished.
DL6ER
on 3 Sep 2020
Related issues
 teckel12
·
63Comments
teckel12
·
63Comments
 silv3rr
·
41Comments
silv3rr
·
41Comments
 fsantiago07044
·
31Comments
fsantiago07044
·
31Comments
 ghost
·
36Comments
ghost
·
36Comments
 ghalfacree
·
32Comments
ghalfacree
·
32Comments
Most helpful comment
@nicholashead We take special care that any database issues cannot affect the resolver so connectivity doesn't get interrupted.
I think the issue you are seeing is caused by too many signals arriving (each time you press the button for adding or deleting a whitelist blacklist item on the dashboard) while other database operations are still ongoig. we solve this in the next version by usingan action queing system that ensures that new database operations are only done when the previous operations are finished.