Pi-hole: Webpage has no Data after update
In raising this issue, I confirm the following: {please fill the checkboxes, e.g: [X]}
- [X] I have read and understood the contributors guide.
- [X] The issue I am reporting can be replicated.
- [X] The issue I am reporting isn't a duplicate (see FAQs, closed issues, and open issues).
Not sure, but i dont have seen a simular
How familiar are you with the the source code relevant to this issue?:
{5}
Expected behaviour:
{See all data on the webpage}
Actual behaviour:
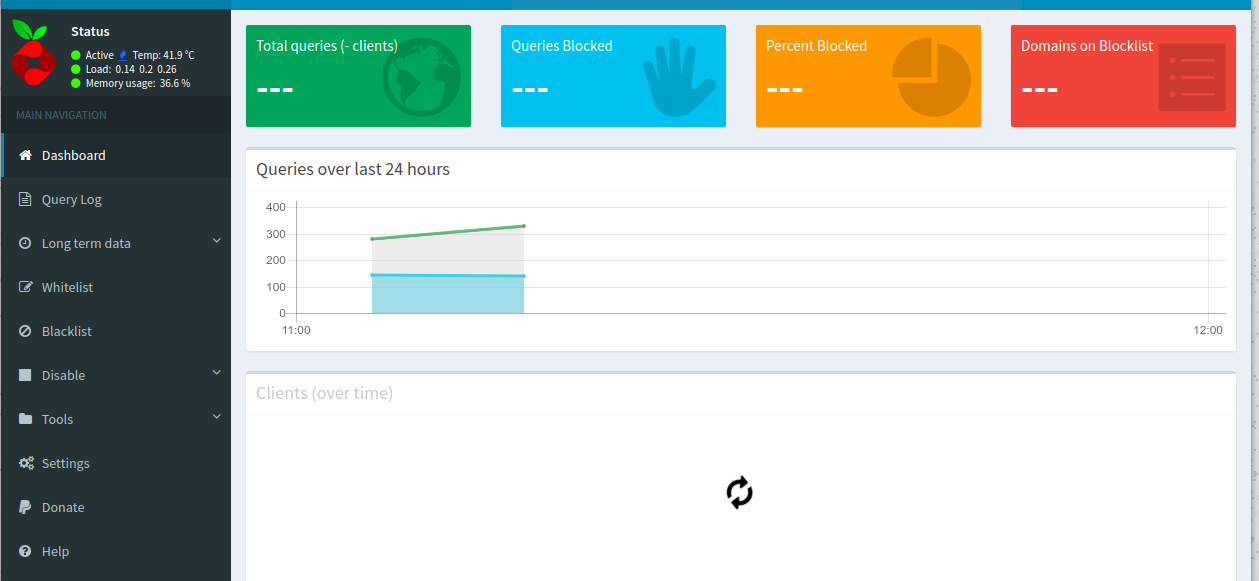
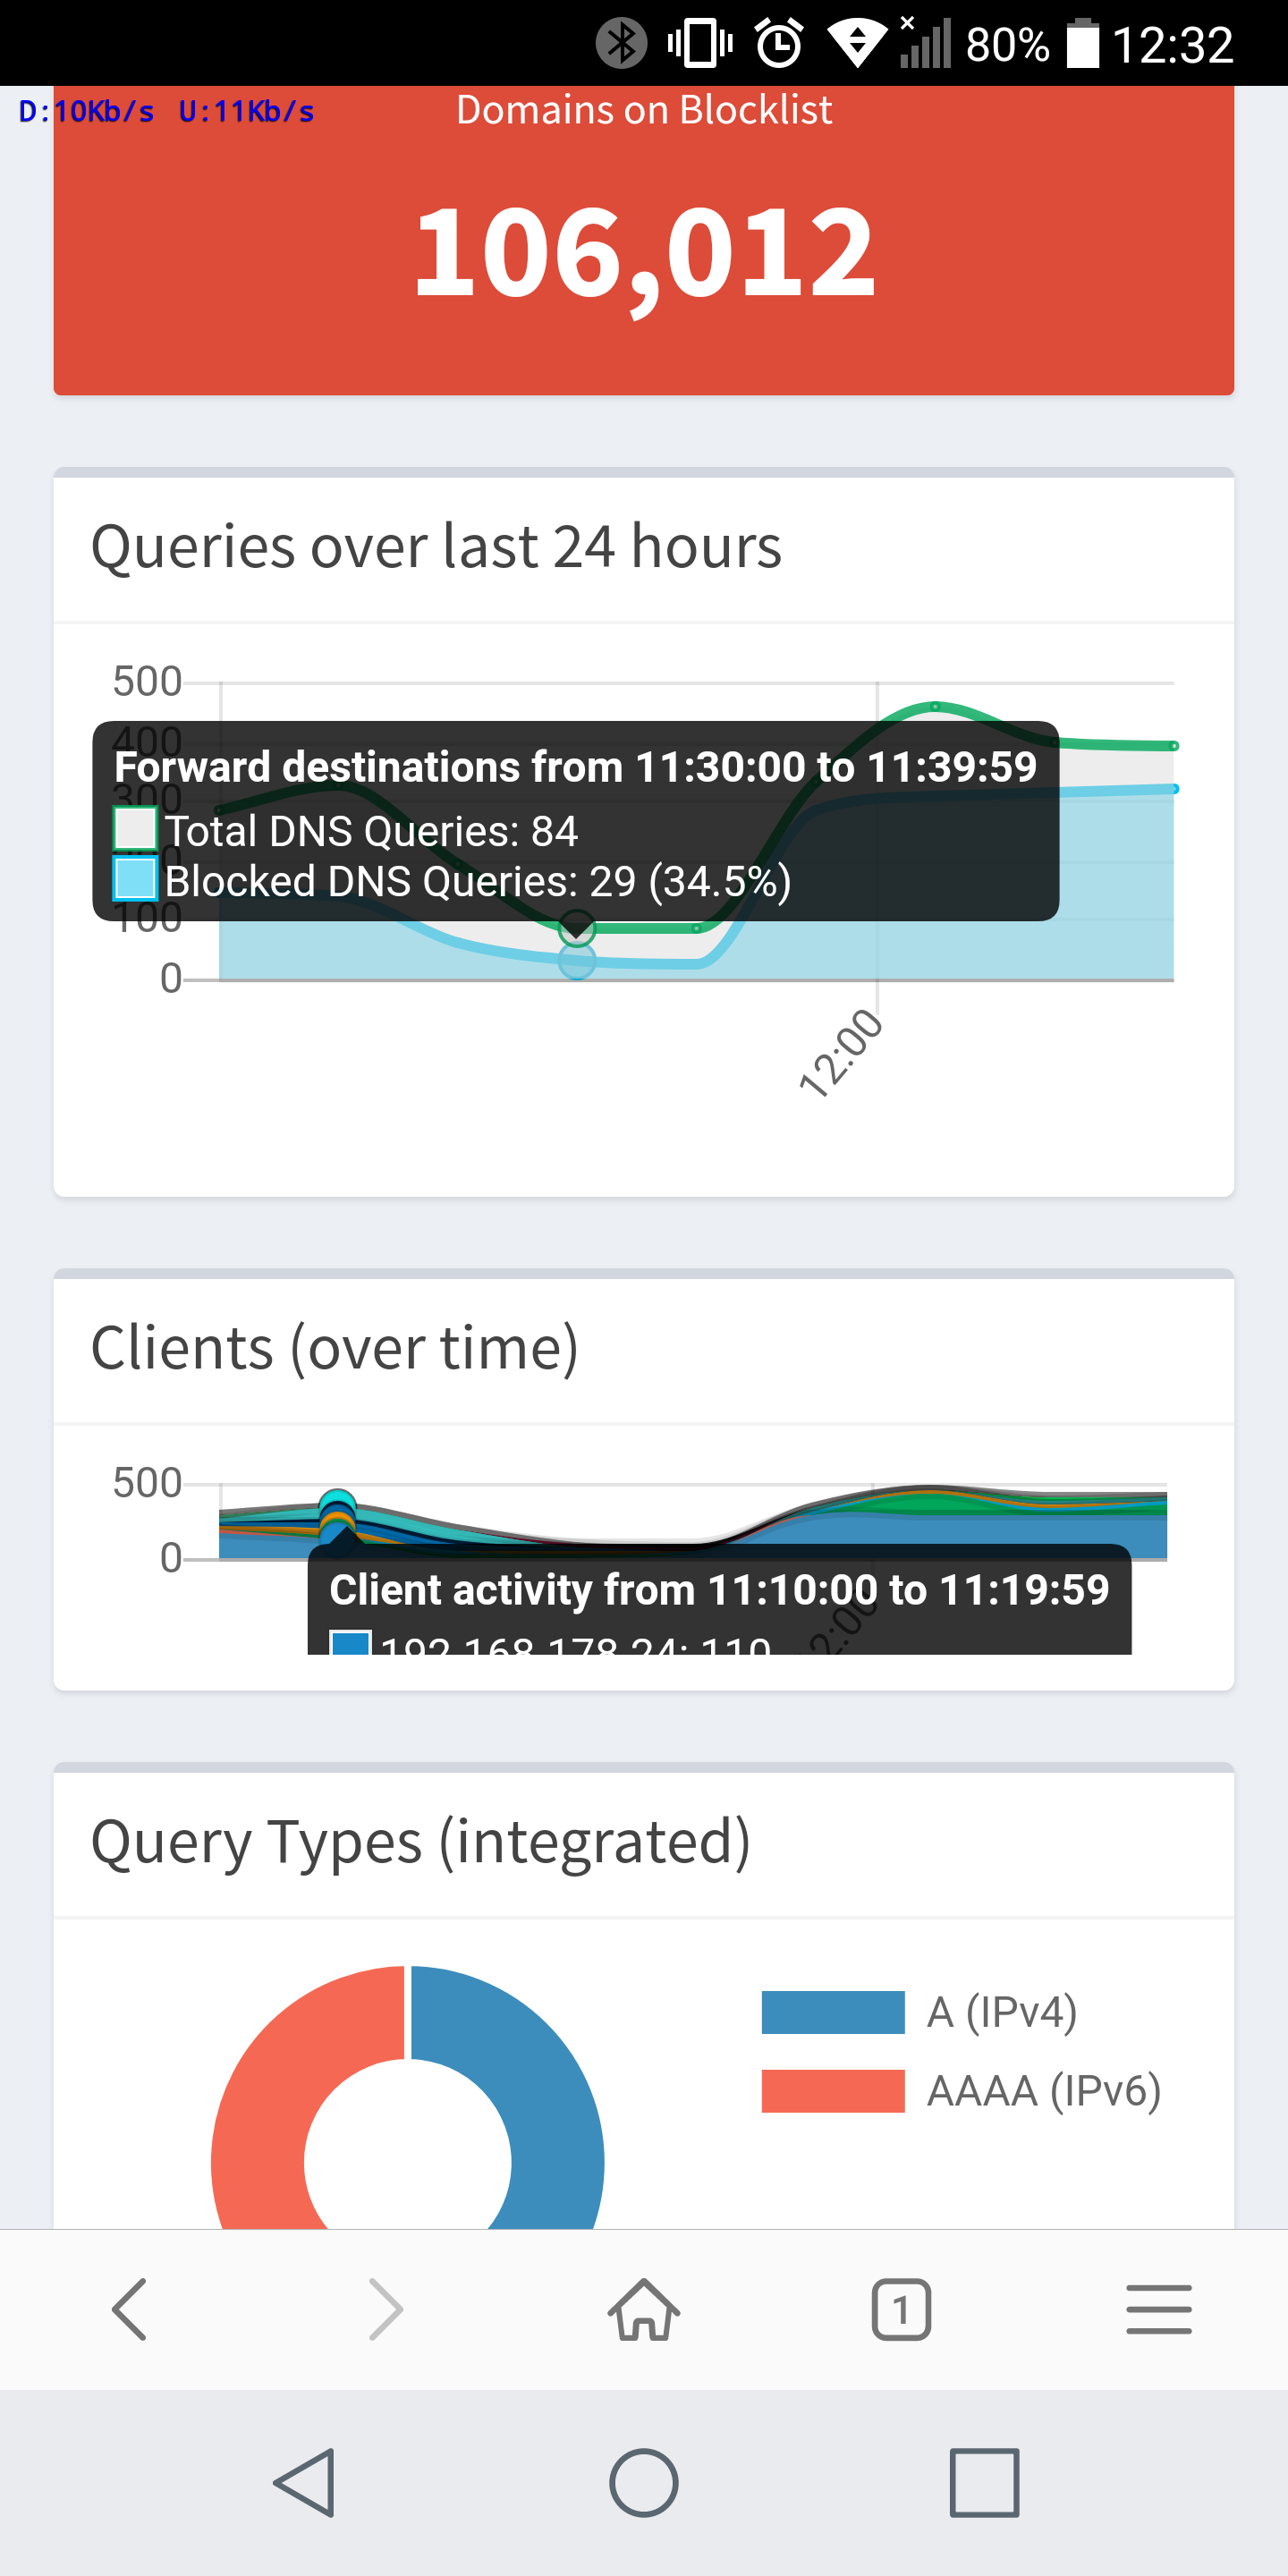
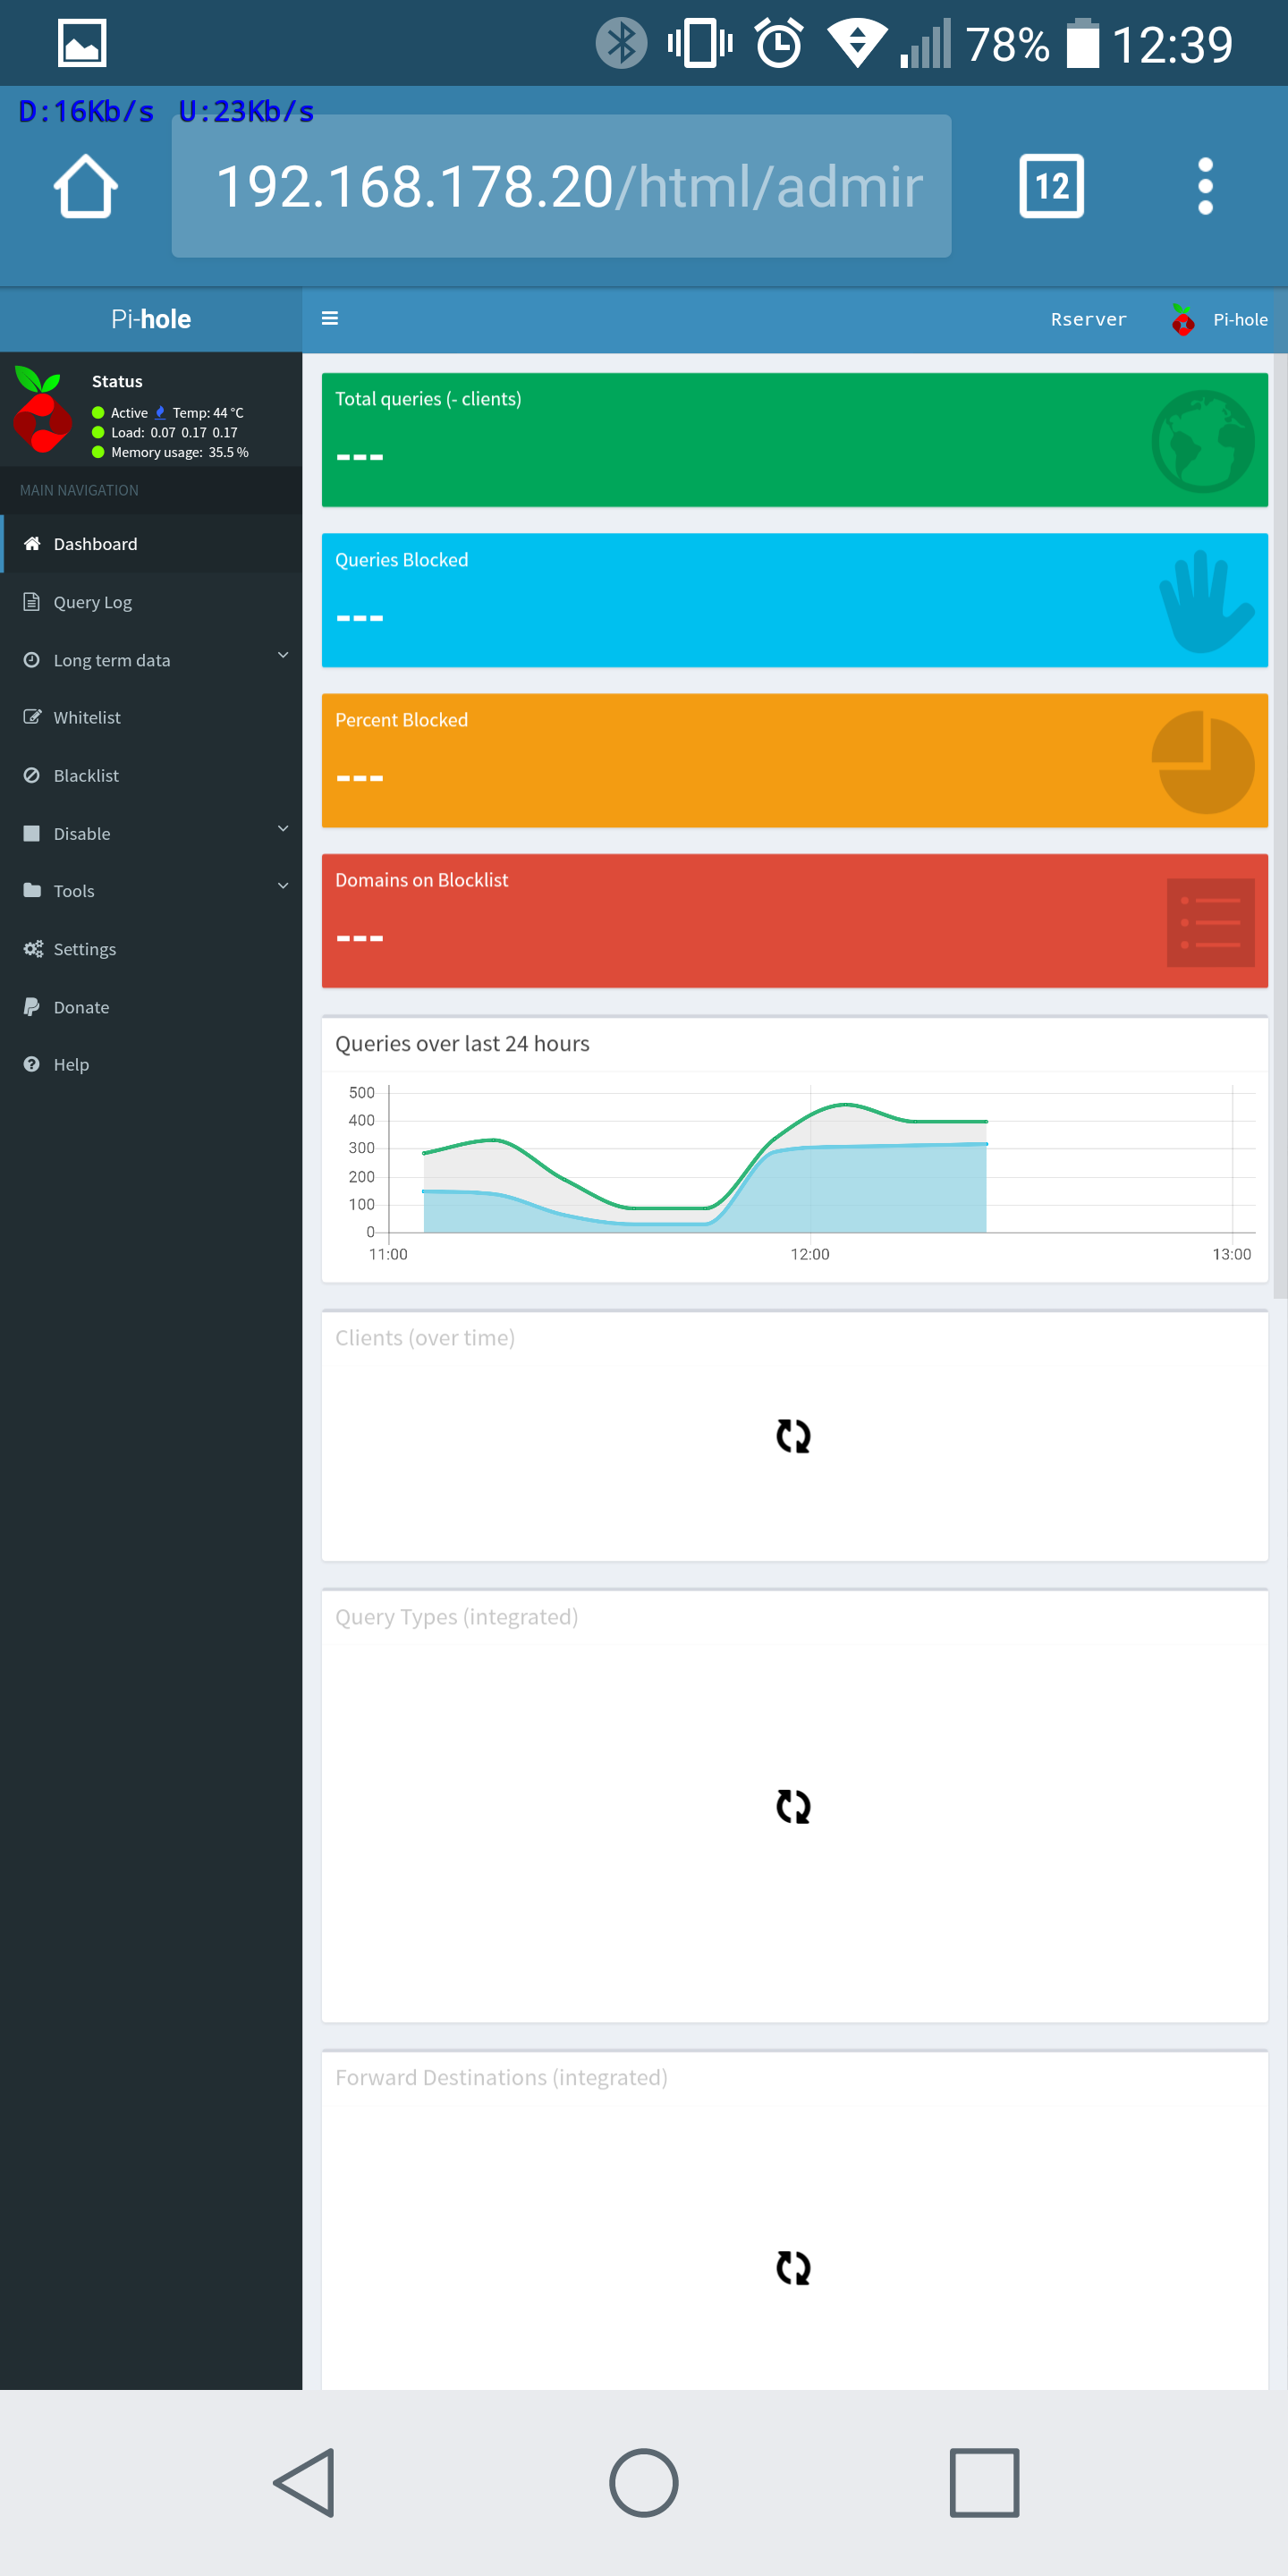
{i can only see the "Recent Queries" all other status are blank or in endles loading.}
Steps to reproduce:
{Start the webpage on /html/admin/index.php }
Debug token provided by uploading pihole -d log:
{hb0q4gd76s}
Troubleshooting undertaken, and/or other relevant information:
{I have installed an update than it appears. i have tryed "pihole -r" i have flushed the log with "pihole -flush" i have uninstalled pihole and reinstalled it. Nothing changed.}
 JobbeDeluxe
All 37 comments
This is something that keeps coming up after each release for a number of users and is almost always related to caching in your local browser. These issues fix themselves magically after some time. To fix it now, try Ctrl + F5 or Crtl + Shift + R (or whatever the Mac equivalent ist).
 DL6ER
on 10 Dec 2017
DL6ER
on 10 Dec 2017
Can confirm this is client based. Ctrl + F5 fixed my issue
 echaritos
on 10 Dec 2017
echaritos
on 10 Dec 2017
That will not work either. I tried from many browsers and devices.

JobbeDeluxe
on 10 Dec 2017
It is very strange that it loads partially for you (as all data is requested from the same source). Can you confirm that you have the most recent version of FTL ?
pihole-FTL version
Maybe you can try a restart of FTL in case the binary got updated but the service wasn't restarted
sudo service pihole-FTL restart
:~ $ pihole-FTL version
vDev-437af07
I have restarted the ftl service and the server as well. No change.
Bevor the update it was shown correctly.
JobbeDeluxe
on 10 Dec 2017
Can you confirm that you have the same problem when viewing the webpage on a PC/Mac? The screenshot seems to be from a mobile device
echaritos
on 10 Dec 2017
The first is from a laptop.
JobbeDeluxe
on 10 Dec 2017
But it seems to be a client problem. I just installed opera to be sure....
And there it will be displayed correctly
Before I was used chrome on both devices.
JobbeDeluxe
on 10 Dec 2017
Hmm, could you try the Request Desktop Site option on your Android device?
Which browser are you using on your Desktop? We test Vivaldi, Firefox, Chrome on Linux (partially on Win) as well as Safari on Mac during development, all in their most recent releases (regular releases, not development releases) and haven't seen such an issue.
DL6ER
on 10 Dec 2017
I tried Chrome on Linux and android.
The same problem on Android with desktop view.
JobbeDeluxe
on 10 Dec 2017
Okay, can you please open the developers tools on Chrome/Linux (press F12) and look for errors in the Console?
DL6ER
on 10 Dec 2017
Right now I'm going to lunch. I will do in half an hour.
JobbeDeluxe
on 10 Dec 2017
We test Vivaldi, Firefox, Chrome on Linux (partially on Win) as well as Safari on Mac during development, all in their most recent releases (regular releases, not development releases) and haven't seen such an issue.
I had the very same issue yesterday after updating from 3.1.4 to 3.2 with the FF 57.0.1 and Chromium 62.0.3202.94 on Linux.
The error console did not reveal any problems to me; however what helped in my case was flushing the logs (on the terminal, as the button on the website is broken right now). After doing that, it took about a minute until the statistics came back.
@JobbeDeluxe: Maby you can test it by moving your old logs to a backup folder?
 steffanson
on 10 Dec 2017
steffanson
on 10 Dec 2017
I tested on FF, this will display the Dashboard, longterm data is not avaliable, but this can be a problem of the log flush maybe.
On Chrome is no error in the console

JobbeDeluxe
on 10 Dec 2017
What does http://pi.hole/admin/api.php tell you?
DL6ER
on 10 Dec 2017
{"domains_being_blocked":106012,"dns_queries_today":4547,"ads_blocked_today":2420,"ads_percentage_today":53.221905,"unique_domains":302,"queries_forwarded":1174,"queries_cached":951,"clients_ever_seen":18,"unique_clients":18,"status":"enabled"}
Seems to be OK
JobbeDeluxe
on 10 Dec 2017
Seems to be OK
I agree. Could you try executing the following in your Console while you are on the dashboard?
updateSummaryData(true);
->updateSummaryData(true);
<-undefined
that what i get.
but the same i will get on FF
JobbeDeluxe
on 10 Dec 2017
Did the summary stats update?
 Mcat12
on 10 Dec 2017
Mcat12
on 10 Dec 2017
Nothing changed
JobbeDeluxe
on 10 Dec 2017
What versions of browsers are you using?
Mcat12
on 13 Dec 2017
I had this problem. To fix, you have to clear the cache in safari. Remember that iCloud will sync this, I cleared the cache (for my piholes IP address) from Mac OS safari, reloaded the page and all is well.
 teapleasenosugar
on 13 Dec 2017
teapleasenosugar
on 13 Dec 2017
I cleared my cache on mobile device and reloaded the page. This fixed the problem on my mobile, so I think it will do on laptop as well
JobbeDeluxe
on 13 Dec 2017
I had the very same problem with data not showing, but it turned out that graphs were not displayed due to SELinux, after fixing this graphs are OK. But I can't get stats to work, clearing caches etc is not helping at all, all what I get is "---" for each field. When I'll go to api.php, it gives
{"domains_being_blocked":2847358,"dns_queries_today":10331,"ads_blocked_today":4512,"ads_percentage_today":43.674377,"unique_domains":1024,"queries_forwarded":4606,"queries_cached":1172,"clients_ever_seen":1,"unique_clients":1,"status":0}
One thing that I noticed that might be causing the issue is this warning in php log:
PHP Warning: number_format() expects parameter 1 to be float, string given in /var/www/html/admin/api_FTL.php on line 39
 adi2k5
on 14 Dec 2017
adi2k5
on 14 Dec 2017
This morning i updated my version to the last one and i had this same dashboard blank(---) indicators on opera browser. I enter this issue and then reload the dashboard with ctrl+f5. Nothing changed. Luckly I have a firefox that i never use installed on a computer next to me. Work Great. I confirm, this is a client side browser cache related issue. Just seat tigth, wait longer enough so Opera make his own cache clear task
 vivasmaq
on 14 Dec 2017
vivasmaq
on 14 Dec 2017
@adi2k5 Have you modified that file, or are you on the latest version? It does not appear to call number_format:
https://github.com/pi-hole/AdminLTE/blob/master/api_FTL.php#L39
Mcat12
on 15 Dec 2017
@Mcat12 No, I haven't. To be sure I just wget copy from github and it's still the same. I've done some testing, and it seems that this warning comes from https://github.com/pi-hole/AdminLTE/blob/master/api_FTL.php#L55, as it stopped when I removed 'floatval()' from that line.
And yes, I'm on the last version:
pihole -v
Pi-hole version is v3.2 (Latest: v3.2)
AdminLTE version is v3.2 (Latest: v3.2)
FTL version is vDev-437af07 (Latest: v2.12)
What is the output of this command?
echo ">stats" | nc localhost 4711
echo ">stats" | nc localhost 4711
domains_being_blocked 2852587
dns_queries_today 8627
ads_blocked_today 3677
ads_percentage_today 42.622002
unique_domains 983
queries_forwarded 4050
queries_cached 876
clients_ever_seen 1
unique_clients 1
status enabled
---EOM---
@adi2k5 that looks fine at first glance, can you quote the error you have seen in lighttpd's log file?
DL6ER
on 17 Dec 2017
That's the point, there's no errors in logs, just php warning mentioned above
[17-Dec-2017 11:58:49 Europe/Warsaw] PHP Warning: number_format() expects parameter 1 to be float, string given in /var/www/html/admin/api_FTL.php on line 39
Except this warning I don't see other errors nor problems, access.log have only this
192.168.1.1 my.domain user [17/Dec/2017:11:58:50 +0100] "GET /admin/api.php?summary HTTP/1.1" 200 174 "https://my.domain/admin/index.php?login" "Mozilla/5.0 (X11; Linux x86_64) AppleWebKit/537.36 (KHTML, like Gecko) Chrome/62.0.3202.97 Safari/537.36 Vivaldi/1.94.1008.34"
192.168.1.1 my.domain user [17/Dec/2017:11:58:51 +0100] "GET /admin/api.php?summaryRaw&topItems HTTP/1.1" 200 325 "https://my.domain/admin/index.php?login" "Mozilla/5.0 (X11; Linux x86_64) AppleWebKit/537.36 (KHTML, like Gecko) Chrome/62.0.3202.97 Safari/537.36 Vivaldi/1.94.1008.34"
192.168.1.1 my.domain user [17/Dec/2017:11:58:51 +0100] "GET /admin/api.php?summaryRaw&getQuerySources HTTP/1.1" 200 197 "https://my.domain/admin/index.php?login" "Mozilla/5.0 (X11; Linux x86_64) AppleWebKit/537.36 (KHTML, like Gecko) Chrome/62.0.3202.97 Safari/537.36 Vivaldi/1.94.1008.34"
192.168.1.1 my.domain user [17/Dec/2017:11:58:51 +0100] "GET /admin/api.php?summary HTTP/1.1" 200 175 "https://my.domain/admin/index.php?login" "Mozilla/5.0 (X11; Linux x86_64) AppleWebKit/537.36 (KHTML, like Gecko) Chrome/62.0.3202.97 Safari/537.36 Vivaldi/1.94.1008.34"
Strange is that all is working as it supposed to work, charts, stats of top blocked domains etc. All except this 4 'small blocks'.
adi2k5
on 17 Dec 2017
@adi2k5 Please open a separate issue on https://github.com/pi-hole/AdminLTE/issues to keep things clear in here, I suggest to use the title number_format() expects parameter 1 to be float, string given
One question you could already answer therein is: How do you format numbers in Poland? E.g. we use . as decimal separator in English, but , in German. This might be a locale issue within PHP we haven't thought about yet.
DL6ER
on 17 Dec 2017
@JobbeDeluxe @vivasmaq Is your issue resolved by now?
DL6ER
on 17 Dec 2017
Clear the cache have solved the problem on all my devices
JobbeDeluxe
on 17 Dec 2017
We use comma , as decimal separator, and thin space as thousands groups separator, this examples of fortmatting in some countries might be useful: https://docs.oracle.com/cd/E19455-01/806-0169/overview-9/index.html
adi2k5
on 17 Dec 2017
@adi2k5 Please open a new issue as DL6ER has requested.
 dschaper
on 17 Dec 2017
dschaper
on 17 Dec 2017
Seems the OP's issue is resolved. Closing.
 jacobsalmela
on 17 Feb 2018
jacobsalmela
on 17 Feb 2018
Related issues
 zimmertr
·
63Comments
zimmertr
·
63Comments
 ghalfacree
·
32Comments
ghalfacree
·
32Comments
 nicolasvac
·
35Comments
nicolasvac
·
35Comments
 stewx
·
60Comments
stewx
·
60Comments
 bauxi
·
53Comments
bauxi
·
53Comments
Most helpful comment
This is something that keeps coming up after each release for a number of users and is almost always related to caching in your local browser. These issues fix themselves magically after some time. To fix it now, try
Ctrl + F5orCrtl + Shift + R(or whatever the Mac equivalent ist).