Pfelk: Captive Portal filters and dashboard
It's possible to implement filters and dashboard for Captive portal?
 darvinrivera
All 45 comments
@darvinrivera - That would be an easy addition.
I know OPNsense is capable of sending these logs via syslog but unsure if pfSense can do the same. It appears many of the plug-ins for pfSense lack the ability to send long remotely.
- [ ] Are you using pfSense or OPNsense
- [ ] Can you provide log messages in their raw format to built the required grok pattern
 a3ilson
on 17 Jan 2021
a3ilson
on 17 Jan 2021
What is the process name for pfSense? For OPNsense, it is captiveportal.
a3ilson
on 17 Jan 2021
I've installed and configure captive portal via OPNsense. So far these are the received messages:
<165>Jan 17 13:45:14 firewall.domain.dev captiveportal[68837]: starting captiveportal background process
<166>Jan 17 14:01:29 firewall.domain.dev captiveportal[6155]: AUTH username (192.168.1.102) zone 0
My authentication method is currently utilizing a voucher.
The 05-apps.conf file was updated to enable support but still requires a GROK pattern to parse out the captiveportal messages. Seeking input from others to further expand this GROK pattern/enrichment.
a3ilson
on 17 Jan 2021
I use pfSense.
Captive Portal with Active Directory Autentication (LDAP)
tail -f /var/log/portalauth.log
Jan 17 02:41:11 hotspot logportalauth[47087]: Zone: wifiportal - DISCONNECT: usernname6, xx:xx:xx:xx:xx:x7, 10.1.2.158
Jan 17 02:52:27 hotspot logportalauth[34411]: Zone: wifiportal - FAILURE: usernname7, xx:xx:xx:xx:xx:x8, 10.1.2.110, Invalid credentials specified.
Jan 17 22:00:40 hotspot logportalauth[41993]: Zone: wifiportal - IDLE TIMEOUT: usernname8, xx:xx:xx:xx:xx:x9, 10.1.1.149
Jan 17 04:05:33 hotspot logportalauth[4989]: Zone: wifiportal - CONCURRENT LOGIN - REUSING OLD SESSION: usernname9, xx:xx:xx:xx:xx:x2, 10.1.1.94
Jan 17 03:44:10 hotspot logportalauth[30747]: Zone: wifiportal - SESSION TIMEOUT: usernname10 xx:xx:xx:xx:xx:x3, 10.1.2.87
Jan 17 12:40:14 hotspot logportalauth[17214]: Zone: wifiportal - FAILURE: , xx:xx:xx:xx:xx:x5, 10.20.1.95, Invalid Login.
Jan 17 23:41:36 hotspot php-fpm[83521]: /index.php: Submission to captiveportal with unknown parameter zone:
Jan 18 09:40:07 hotspot logportalauth[45717]: Zone: wifiportal - ACCEPT: username1, xx:xx:xx:xx:xx:x1, 10.1.1.7
Jan 18 09:40:09 hotspot logportalauth[49333]: Zone: wifiportal - ACCEPT: username2, xx:xx:xx:xx:xx:x2, 10.1.1.8
Jan 18 09:40:22 hotspot logportalauth[73766]: Zone: wifiportal - ACCEPT: username3, xx:xx:xx:xx:xx:x3, 10.1.1.9
Jan 18 09:40:38 hotspot logportalauth[67572]: Zone: wifiportal - ACCEPT: username4, xx:xx:xx:xx:xx:x4, 10.1.2.8
Jan 18 09:40:44 hotspot logportalauth[2188]: Zone: wifiportal - ACCEPT: username5, xx:xx:xx:xx:xx:x5, 10.1.2.9
I added diferents types of messages.
darvinrivera
on 18 Jan 2021
@darvinrivera - thanks!
I'll just need the logs in their syslog format...the GROK pattern appears rather easy to implement.
Do you know if pfSense allows for these logs to be exported via syslog or syslog-ng?
a3ilson
on 18 Jan 2021
@darvinrivera - thanks!
Do you know if pfSense allows for these logs to be exported via syslog or syslog-ng?
Nevermind...it does.
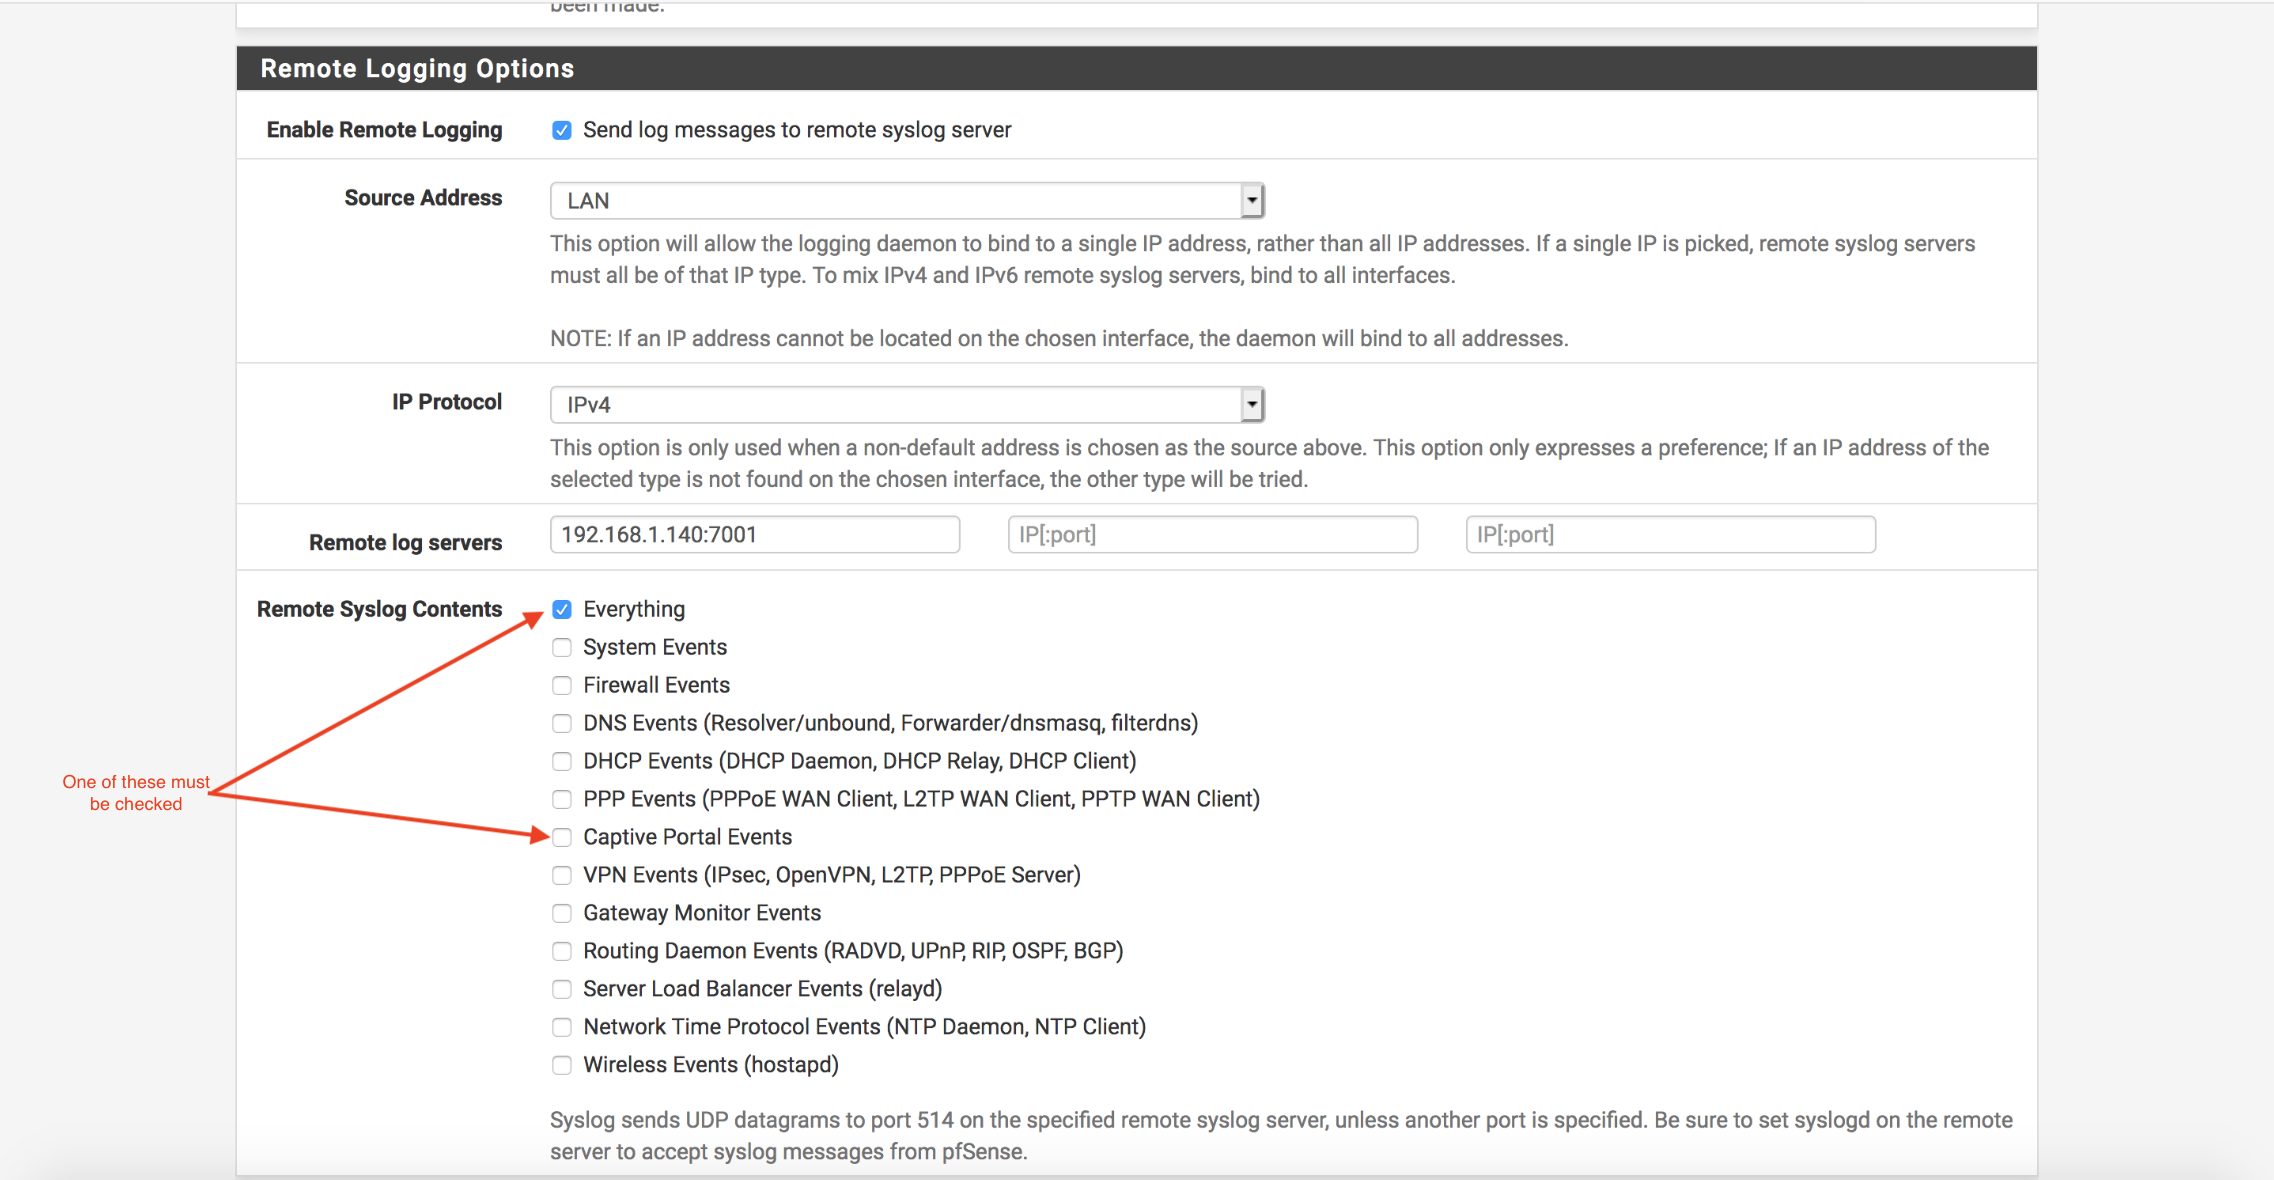
I am hoping the output is similar to that of OPNsense... when possible could you send those logs remotely and provide their raw output? Either option should suffice:
- Update your 05-apps.conf which may log the captive portal events
or - Send the log messages remotely and on the remote system do:
a.sudo tcpdump -vvv -A -i any port 5140 > tcpfile
b. after you've collected a number of captive portal logs, grep the tcpdump file to reveal the captive logs (e.g.grep captiveportal tcpfile)
c. paste the result here (feel free to sanitize but make sure the type of data is consistent (e.g. replace IP address with non-routable/different IP address)
a3ilson
on 18 Jan 2021
grep captiveportal tcpfile
        Msg: Jan 18 10:06:16 php-fpm[82751]: /index.php: Submission to captiveportal with unknown parameter zone:
........r..<163>Jan 18 10:06:16 php-fpm[82751]: /index.php: Submission to captiveportal with unknown parameter zone:
        Msg: Jan 18 10:06:16 php-fpm[82751]: /index.php: Submission to captiveportal with unknown parameter zone:
........r..<163>Jan 18 10:06:16 php-fpm[82751]: /index.php: Submission to captiveportal with unknown parameter zone:
grep logportalauth tcpfile or grep wifiportal tcpfile
        Msg: Jan 18 10:05:23 logportalauth[67572]: Zone: wifiportal - DISCONNECT: username1, xx:xx:xx:xx:xx:x1, 10.1.1.253
........~       .<166>Jan 18 10:05:23 logportalauth[67572]: Zone: wifiportal - DISCONNECT: username2, xx:xx:xx:xx:xx:x1, 10.1.1.253
        Msg: Jan 18 10:05:23 logportalauth[67572]: Zone: wifiportal - DISCONNECT: username3, xx:xx:xx:xx:xx:x1, 10.1.1.224
..........p<166>Jan 18 10:05:23 logportalauth[67572]: Zone: wifiportal - DISCONNECT: username14, xx:xx:xx:xx:xx:x1, 10.1.1.224
        y.x<166>Jan 18 10:06:31 logportalauth[73766]: Zone: wifiportal - ACCEPT: username1, xx:xx:xx:xx:xx:x1, 10.1.1.163
        Msg: Jan 18 10:06:37 logportalauth[45717]: Zone: wifiportal - ACCEPT: username2, xx:xx:xx:xx:xx:x1, 10.1.1.211
        Msg: Jan 18 10:06:40 logportalauth[73766]: Zone: wifiportal - FAILURE: username4, xx:xx:xx:xx:xx:x1, 10.1.1.96, Invalid credentials specified.
........{..<166>Jan 18 10:06:50 logportalauth[30395]: Zone: wifiportal - ACCEPT: username5, xx:xx:xx:xx:xx:x2, 10.1.1.29
Perfect/thanks!
To no surprise there are differences between pf/OPNsense. What type of data are the xx:xx:xx:xx:xx:x2's? I'm guessing/assuming MAC addresses?
a3ilson
on 18 Jan 2021
Yes
darvinrivera
on 18 Jan 2021
ok...got a working GROK pattern...now, I'm going back through to align the fields with ECS so that the built-in SIEM can take advantage of these logs too.
A few clarification questions:
- the IP address at the end are the client ip addresses correct (i.e. those establishing the connection)
- the MAC address is also the client (i.e. those establishing the connection)
- the username's...better as user.id or user.name
Since pfSense/OPNsense differ, I'll build out the OPNsense afterwards and attempt to build out a dashboard...however, my logs are limited so feel free to build/share a dashboard too.
a3ilson
on 18 Jan 2021
- Yes.
- MAC Address is the clients.
- user.name
darvinrivera
on 18 Jan 2021
Alright...here's what I have so far:
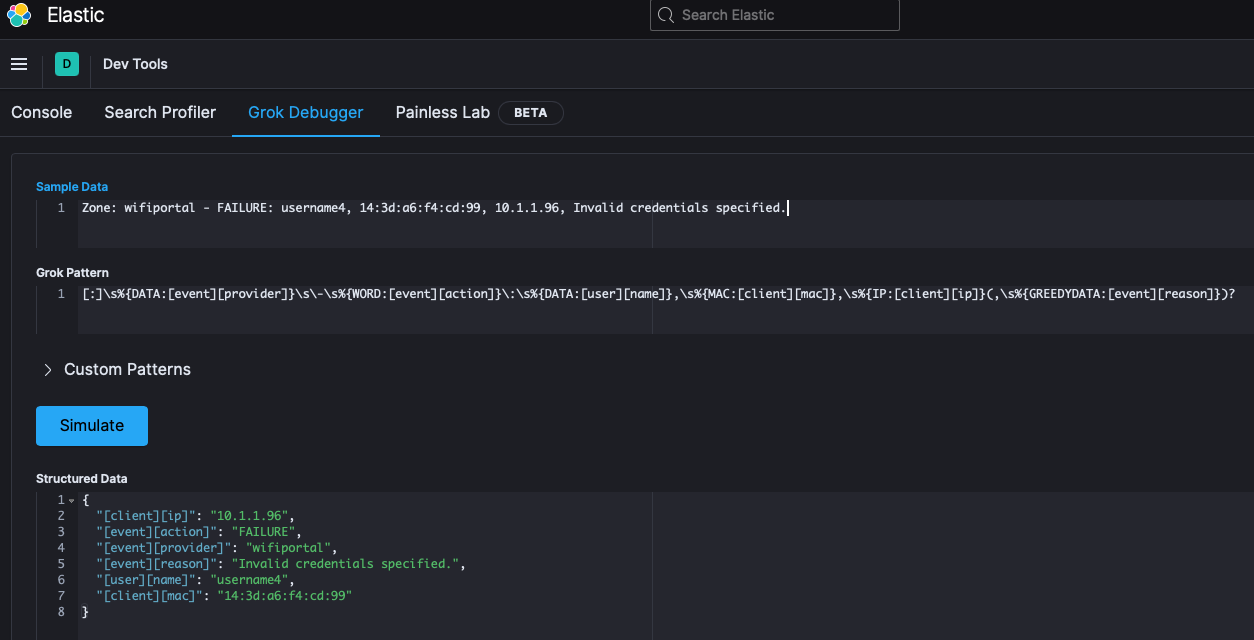
This will enrich the all logs provided thus far. To gain additional insight, we can further enrich (later) by relating the reason with the data/time to possibly obtain the duration, number of login/logout, unsuccessful attempts etc...
Note: the MAC address provided was notional but needed for the filter to work.
a3ilson
on 18 Jan 2021
Let me finish some other minor changes with the 05-apps.conf file and I'll update.
a3ilson
on 18 Jan 2021
ok, i wait to test. thanks.
darvinrivera
on 18 Jan 2021
Alright... below is the modified 05-apps.conf file. Replace your existing one, restart Logstash and confirm your captive portal logs are being parsed. I'll finish up building out the OPNsense variant and the final file will reference the grok pattern which will be housed in the grok file parsing both pfSense and OPNsense logs.
# 05-apps.conf
################################################################################
# Version: 21.01-6                                                             #
#                                                                              #
#                                                                              #
#                                                                              #
################################################################################
#
filter {
  ### captive portal ###
  # Rename pfSense captive portal log from logportalauth to captiveportal
  if [process][name] =~ /^logportalauth/ {
    mutate {
      replace => [ "[process][name]",  "captiveportal" ]
    }
  }
  if [process][name] =~ /^captiveportal/ {
    mutate {
      add_tag => [ "captive" ]
      add_field => [ "[ecs][version]", "1.7.0" ]
      add_field => [ "[event][dataset]", "[pfelk][captive]" ]
      rename => [ "filter_message", "captiveportalmessage" ]
    }
    grok {
#      patterns_dir => [ "/etc/logstash/conf.d/patterns" ]
#      match => [ "captiveportalmessage", "%{CAPTIVEPORTAL}" ]
       match => { "captiveportalmessage" => "[:]\s%{DATA:[event][provider]}\s\-\s%{WORD:[event][action]}\:\s%{DATA:[user][name]},\s%{MAC:[client][mac]},\s%{IP:[client][ip]}(,\s%{GREEDYDATA:[event][reason]})?" }
    }
  }
  ### dhcpd ###
  if [process][name] =~ /^dhcpd$/ {
    mutate {
      add_tag => [ "dhcp", "dhcpdv4" ]
      add_field => [ "[event][dataset]", "[pfelk][dhcp]" ]
    }
    grok {
      patterns_dir => [ "/etc/logstash/conf.d/patterns" ]
      match => [ "filter_message", "%{DHCPD}"]
    }
  }
  ### dhcp6 ###
  if [process][name] =~ /^dhcp6c/ {
    mutate {
      add_tag => [ "dhcp", "dhcpdv6" ]
      add_field => [ "[event][dataset]", "[pfelk][dhcp]" ]
    }
    grok {
      patterns_dir => ["/etc/logstash/conf.d/patterns" ]
      match => [ "filter_message", "%{DHCPDv6}" ]
    }
  }
  ### dpinger ###
  if [process][name] =~ /^dpinger/ {
    mutate {
      add_tag => [ "dpinger" ]
      add_field => [ "[event][dataset]", "[pfelk][dpinger]" ]
    }
  }
  ### filterlog ###
  if [process][name] =~ /^filterlog$/ {
    mutate {
      add_tag => [ "pf" ]
      add_field => [ "[ecs][version]", "1.7.0" ]
      add_field => [ "[event][dataset]", "[pfelk[firewall]" ]
    }
    grok {
      patterns_dir => [ "/etc/logstash/conf.d/patterns" ]
      match => [ "filter_message", "%{PF_LOG_ENTRY}" ]
    }
  }
  ### haproxy ###
  if [process][name] =~ /^haproxy/ {
    mutate {
      add_tag => [ "haproxy" ]
      add_field => [ "[event][dataset]", "[pfelk][haproxy]" ]
    }
    grok {
      patterns_dir => [ "/etc/logstash/conf.d/patterns" ]
      match => [ "filter_message", "%{HAPROXY}" ]
    }
  }
  ### openvpn ###
  if [process][name] =~ /^openvpn/ {
    mutate {
      add_tag => [ "openvpn" ]
      add_field => [ "[event][dataset]", "[pfelk][openvpn]" ]
    }
    grok {
      patterns_dir => [ "/etc/logstash/conf.d/patterns" ]
      match => [ "filter_message", "%{OPENVPN}" ]
    }
  }
  ### named ###
  if [process][name] =~ /^named/ {
    mutate {
      add_tag => [ "bind9" ]
      add_field => [ "[event][dataset]", "[pfelk][bind9]" ]
    }
    grok {
     #patterns_dir => [ "/etc/logstash/conf.d/patterns" ]
     match => [ "filter_message", "%{BIND9}" ]
    }
  }
  ### ntpd ###
  if [process][name] =~ /^ntpd/ {
    mutate {
      add_tag => [ "ntpd" ]
      add_field => [ "[event][dataset]", "[pfelk][ntpd]" ]
    }
  }
  ### php-fpm ###
  if [process][name] =~ /^php-fpm/ {
    mutate {
      add_tag => [ "web_portal" ]
      add_field => [ "[event][dataset]", "[pfelk][webportal]" ]
    }
    grok {
      patterns_dir => [ "/etc/logstash/conf.d/patterns" ]
      match => [ "filter_message", "%{PF_APP}%{PF_APP_DATA}" ]
    }
    mutate {
      lowercase => [ 'pf_ACTION' ]
    }
  }
  ### snort ###
  if [process][name] =~ /^snort/ {
    mutate {
      add_tag => [ "snort" ]
      add_field => [ "[ecs][version]", "1.7.0" ]
      add_field => [ "[event][dataset]", "[pfelk][snort]" ]
    }
    grok {
      patterns_dir => [ "/etc/logstash/conf.d/patterns" ]
      match => [ "filter_message", "%{SNORT}" ]
    }
  }
  ### suricata ###
  if [process][name] =~ /^suricata$/ {
    if [filter_message] =~ /^{.*}$/ {
      json {
        source => "filter_message"
        target => "[suricata][eve]"
        add_tag => "suricata_json"
      }
    }
    if [suricata][eve][src_ip] and ![source][ip] {
      mutate {
        add_field => { "[source][ip]" => "%{[suricata][eve][src_ip]}" }
      }
    }
    if [suricata][eve][dest_ip] and ![destination][ip] {
      mutate {
        add_field => { "[destination][ip]" => "%{[suricata][eve][dest_ip]}" }
      }
    }
    if [suricata][eve][src_port] and ![source][port] {
      mutate {
        add_field => { "[source][port]" => "%{[suricata][eve][src_port]}" }
      }
    }
    if [suricata][eve][dest_port] and ![destination][port] {
      mutate {
        add_field => { "[destination][port]" => "%{[suricata][eve][dest_port]}" }
      }
    }
    if "suricata_json" not in [tags] {
      grok {
        patterns_dir => [ "/etc/logstash/conf.d/patterns" ]
        match => [ "filter_message", "%{SURICATA}" ]
      }
    }
    mutate {
      remove_tag => "suricata_json"
      add_tag => "suricata"
      add_field => [ "[event][dataset]", "[pfelk][suricata]" ]
    }
  }
  ### squid ###
  if [process][name] == "(squid-1)" {
    mutate {
      replace => [ "[process][name]", "squid" ]
      add_field => [ "[event][dataset]", "[pfelk][squid]" ]
    }
    if [filter_message] =~ /^{.*}$/ {
      json {
        source => "filter_message"
        add_tag => "squid_json"
      }
    }
    if "squid_json" not in [tags] {
      grok {
        patterns_dir => [ "/etc/logstash/conf.d/patterns" ]
        match => [ "filter_message", "%{SQUID}" ]
      }
    }
  ### squid ECS => Built-in SIEM JSON ###
    if "squid_json" in [tags] {
      grok {
        match => [ "[url][original]", "%{URIPROTO}://%{URIHOST:referer_domain}%{GREEDYDATA:[url][path]}" ]
      }
      mutate {
        rename => [ "[http][response][body][status_code]", "[http][response][status_code]" ]
        rename => [ "referer_domain", "[url][domain]" ]
      }
    }
    mutate {
      rename => { "[host][hostname]" => "[client][ip]" }
      remove_tag => "squid_json"
      add_tag => "squid"
    }
  }
  ### unbound ###
  if [process][name] =~ /^unbound/ {
    mutate {
      add_tag => "unbound"
      add_field => [ "[ecs][version]", "1.7.0" ]
      add_field => [ "[event][dataset]", "[pfelk][unbound]" ]
    }
    grok {
      patterns_dir => [ "/etc/logstash/conf.d/patterns" ]
      match => [ "filter_message", "%{UNBOUND}" ]
    }
  ### unbound ECS => Built-in SIEM ###
    grok {
      match => [ "[dns][question][name]", "\.(?<[dns][question][registered_domain]>[^.]+\.[^.]+)$" ]
      add_tag => "unbound-registered_domain"
    }
    if "unbound-registered_domain" not in [tags] {
      grok {
        match => [ "[dns][question][name]", "(?<[dns][question][registered_domain]>[^.]+\.[^.]+)$" ]
      }
    }
    mutate {
      remove_tag => "unbound-registered_domain"
    }
  }
}
I cant see any log in Dicovery. I filtered by process.name or event.dataset and nothing.
darvinrivera
on 18 Jan 2021
I just updated the 05-apps.conf and pfelk.grok within the repo...please update both of those and try again...I've tested and have it working on OPNsense...if you still don't see anything check your logstash logs
a3ilson
on 18 Jan 2021
@darvinrivera - let me know if you get it working and/or need any further assistance.
a3ilson
on 18 Jan 2021
I had a problem in elasticsearch. Now is online.
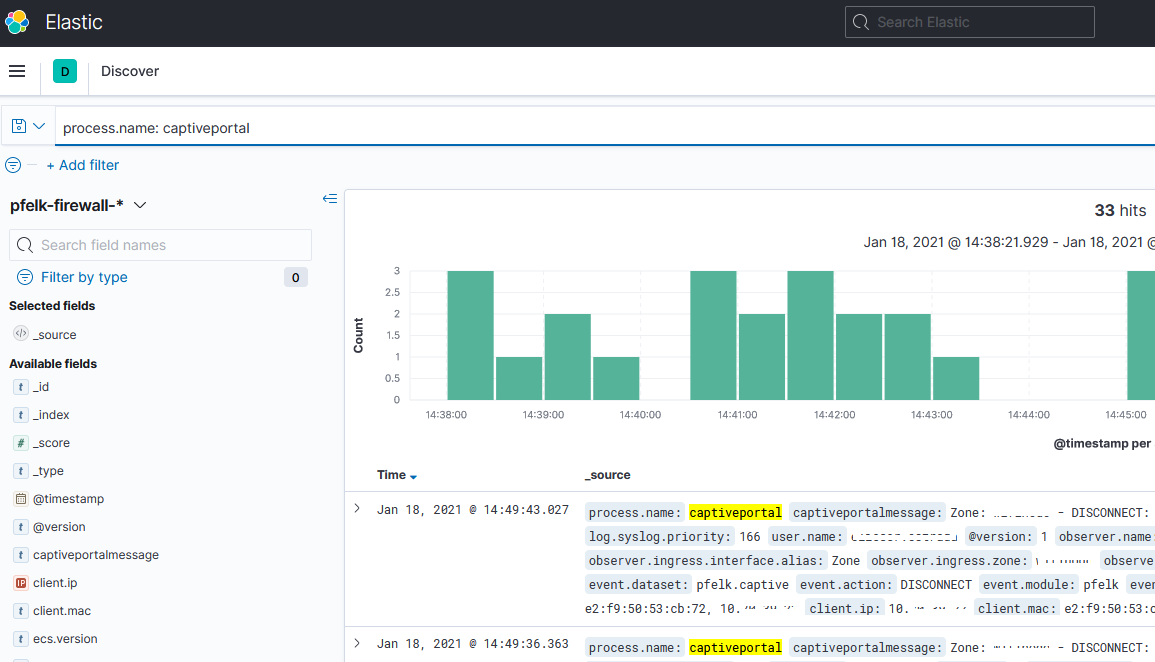
Its working.
darvinrivera
on 18 Jan 2021
You have quite a bit more logs than my simple setup.
Let me know if you need help with the dashboard and if possible feel free to share. Although I can put one together, pfsense has more detailed logs not to mention you have a bit more logs/data to apply/visualize.
finally, they may be other logs (different types)... if they don’t parse, feel free to share and I’ll build out additional grok patterns.
a3ilson
on 18 Jan 2021
@a3ilson
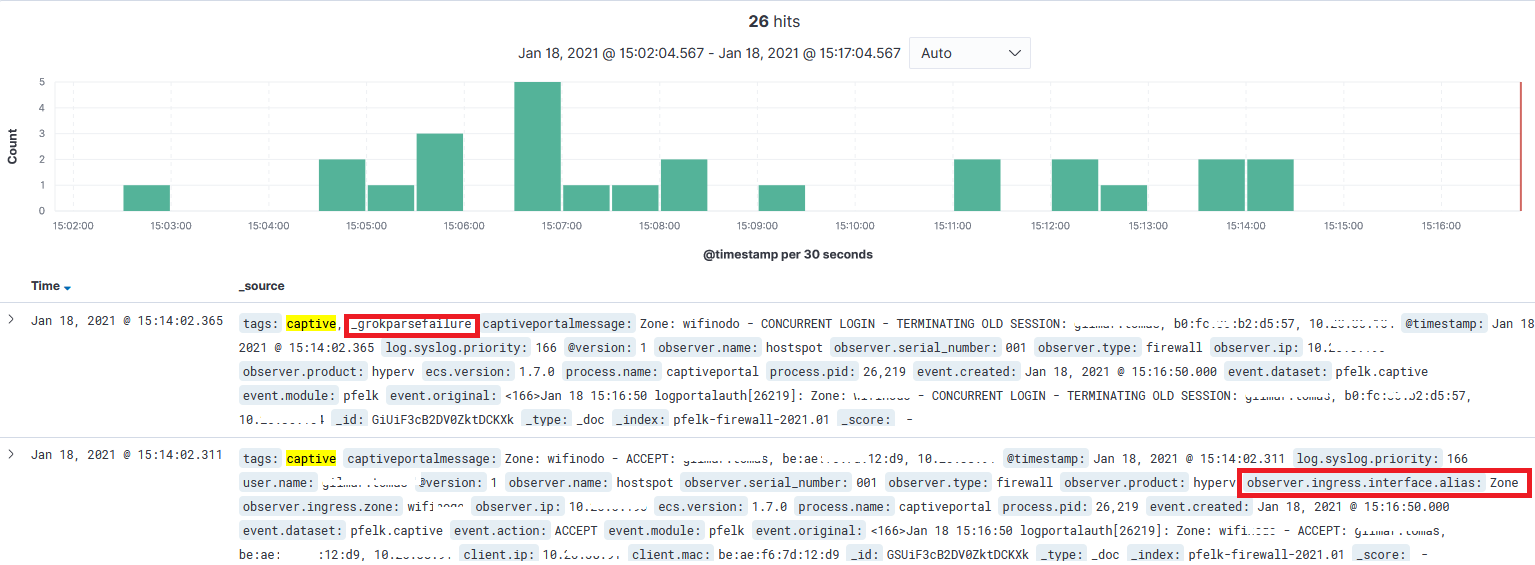
When log is:
<166>Jan 18 15:03:48 logportalauth[48234]: Zone: wifiportal - CONCURRENT LOGIN - TERMINATING OLD SESSION: username1, b1:fx:36:a2:35:55, 10.1.1.104
Why? observer.ingress.interface.alias: Zone
tags is captive, _grokparsefailure in Discovery.
Logstash log:
[2021-01-18T15:07:24,667][WARN ][logstash.filters.grok ][main][42c8bc95d5415d71e1f0db3194123e035961903e8931d10850eab715c8887836] Grok regexp threw exception {:exception=>"Could not set field 'action' on object '/index.php' to value ' Submission to captiveportal with unknown parameter zone: '.This is probably due to trying to set a field like [foo][bar] = someValuewhen [foo] is not either a map or a string", :backtrace=>["org.logstash.Accessors.setChild(Accessors.java:142)", ...
Yes, i need help with the dashboard.
darvinrivera
on 18 Jan 2021
Was that a recent error (i.e. with the latest regions of 05-apps.conf and pfelk.grok)? The first iteration, I had incorrect tried to assign a value to an object yielding a similar error message?
a3ilson
on 18 Jan 2021
Updated the grok pattern...update your pfelk.grok file and restart logstash. The revision will now parse your originally provided messages and the concurrent login...I'd let it run a bit and collect more logs and all those with grok failure tags you can reply back on here.
a3ilson
on 18 Jan 2021
Alright... I'll dabble a bit on the dashboard but no promisees as I do not have a variety of logs to test/build.
Here's the available fields based on the captive portal logs:
  "[log][syslog][priority]": "166",
  "[event][created]": "Jan 18 15:03:48",
  "[process][pid]": "48234",
  "filter_message": "Zone: wifiportal - CONCURRENT LOGIN - TERMINATING OLD SESSION: username1, 3d:1c:2f:55:9 31:2e, 10.1.1.104",
  "[process][name]": "logportalauth"
  "[client][ip]": "10.1.1.104",
  "[observer][ingress][interface][alias]": "Zone",
  "[event][action]": "CONCURRENT LOGIN - TERMINATING OLD SESSION",
  "[user][name]": "username1",
  "[observer][ingress][zone]": "wifiportal",
  "[client][mac]": "3d:1c:2f:55:9 31:2e"
Alrighty...not entirely sure it this will work. I had a handful of logs and the graphs were mostly blank. I may update the 50-outputs.conf file, to index these in their own index.
I made another (final) change to the grok filter. Please update and restart Logstash for it to take.
Import the captive portal:
- Unzip the attached
- Navigate to Kibana
- Click on the menu (upper left) scroll down and click on Stack Management
- Click on saved objects
- Click on Import
- Drag the captive.ndjson file
- Click Import
YouTube Tutorial on Importing Saved Objects here
a3ilson
on 18 Jan 2021
I had some conflicts (i.e. similar data fields skewing captive) so I created a separate captive portal index pattern.
This should be the final major change...with all others improving upon this initiative.
To Update:
a3ilson
on 18 Jan 2021
I had not responded because I was doing some tests in the dashboard that you sent me and fixing some fields that referenced user.name and you had changed it to client.user.name
When captiveportalmessage is Zone: wifiportal - IDLE TIMEOUT: username1, ac: aa:ae:ae:71:71, 10.1.1.226 the Captive.Discovery on the dashboard is blank.
I will update 50-outputs.conf and other steps now
darvinrivera
on 18 Jan 2021
@a3ilson There is an error in 50-outputs.conf. Please, see line 5.
darvinrivera
on 19 Jan 2021
@a3ilson There is an error in 50-outputs.conf. Please, see line 5.
Thanks! not sure what happened there but I corrected the erroneous text.
a3ilson
on 19 Jan 2021
I had not responded because I was doing some tests in the dashboard that you sent me and fixing some fields that referenced user.name and you had changed it to client.user.name
When captiveportalmessage is Zone: wifiportal - IDLE TIMEOUT: username1, ac: aa:ae:ae:71:71, 10.1.1.226 the Captive.Discovery on the dashboard is blank.I will update 50-outputs.conf and other steps now
I amended the names from user.name to client.user.name as defined by ECS
After you update your configuration...everything should work without any tweaking/tinkering. Let me know how it works out and thanks for your help with enhancing this project.
a3ilson
on 19 Jan 2021
Ok. I will update all and let you know.
darvinrivera
on 19 Jan 2021
I did all the steps:
- Updated 50-outputs.conf
- Updated the pfelk template with script
- Updated dashboard with script.
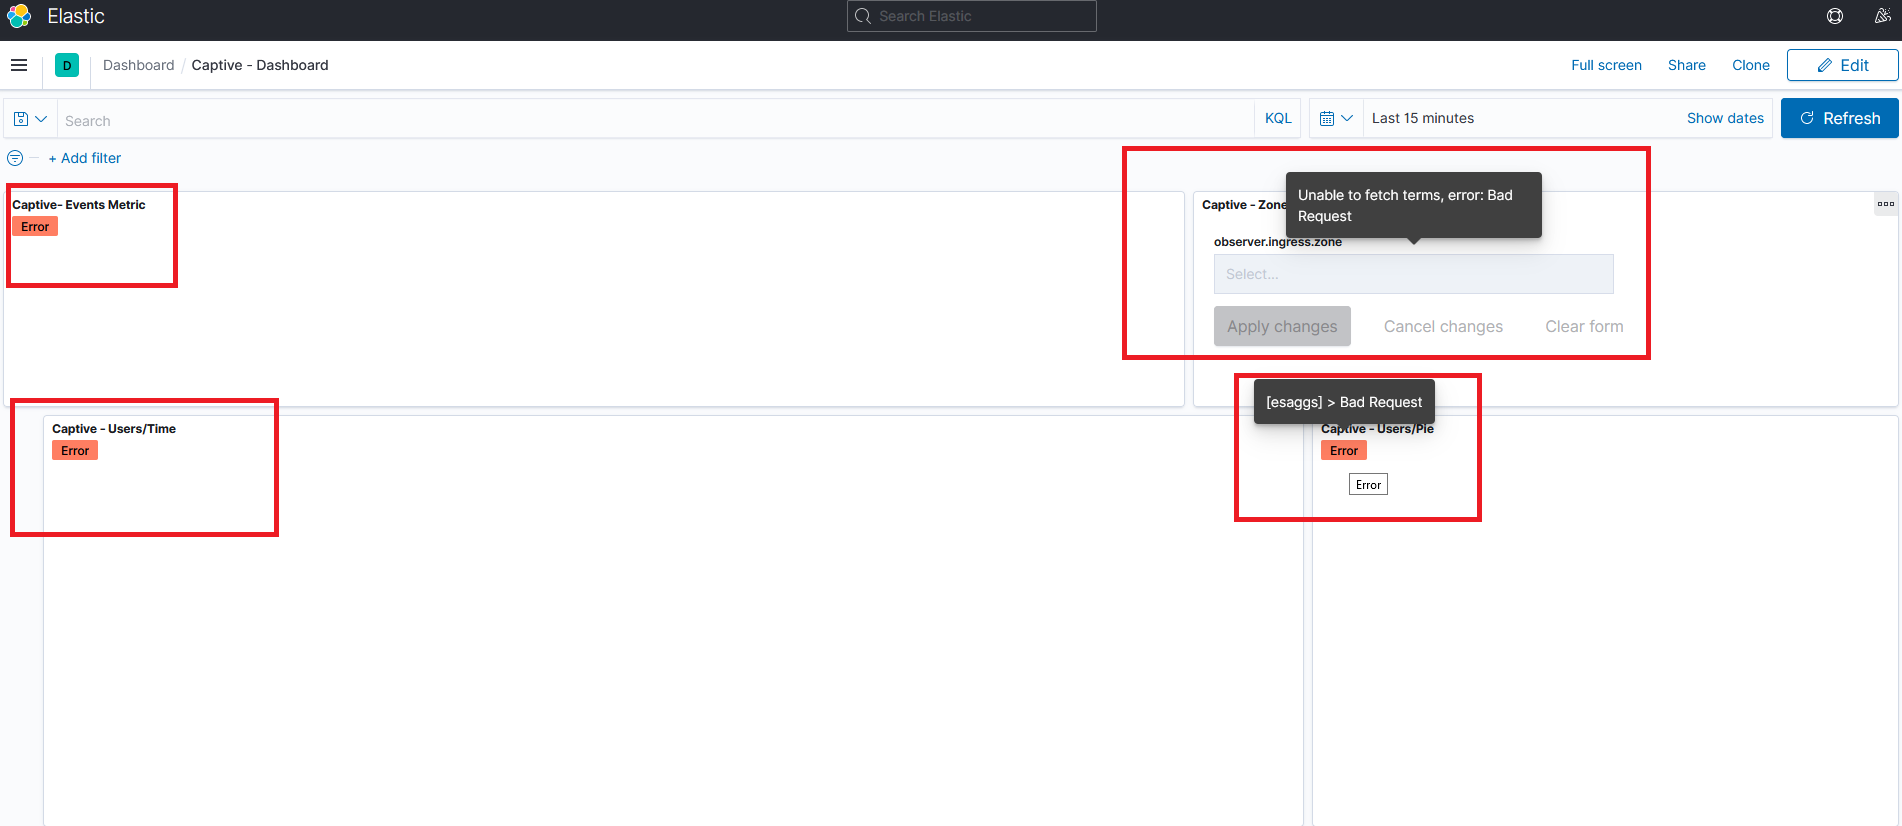
Dashboard problem: Only work Discovery
darvinrivera
on 19 Jan 2021
Check discovery and select captive... is the captive data being parsed?
a3ilson
on 19 Jan 2021
Did you delete the previous captive elements? If not you may need to delete the captive saved objects and rerun the dashboard script.
a3ilson
on 19 Jan 2021
Yes: pfelk-captive-* is parsing data.
I delete previous dashboard with all objects and re-run the script. I have the same error in Captive Dashboard, maybe I need a brake, let's try later again from beginning.
darvinrivera
on 19 Jan 2021
You might need to purge the indices. I’ve had issues when implementing changes while running the same index patterns.
alrighty... let me now when your back at it, so we can validate that it is working.
a3ilson
on 19 Jan 2021
I need to delete all indices or only captive?
darvinrivera
on 19 Jan 2021
It's working. I had problems with the indices in elasticsearch, the were in red, I deleted them and restart everything and all is working. 100% Captive Dashboard.
Only one question: It's possible to make a Dashboard with differents index? I want to join Captive Dashboard and Unbound Dashboard by client ip address, I want to select ip address and filter all requests.
darvinrivera
on 19 Jan 2021
Great and glad everything is working! As for your question:
Is it possible to build a dashboard comprised of different (multiple) indices?
a. Yes- Navigate to menu (upper left) and click on Dashboard under the Kibana heading
- Select "Create Dashboard"
- Click on "add" and add desired visualizations (regardless of their referenced index)
Join (query) Captive and Unbound Dashboard by the
client.ipaddress field
a. Yes - this is also possible but will require some revisions- First, you'll need to create an index pattern
- Navigate ot menu (upper left) and click on Stack Management under the Management title
- Click on Index Patterns under the Kibana heading
- Click on "Create Index Pattern"
- Insert
pfelk-*within the index pattern name field - Click "Next Step"
- Select
@timestampas your Time Field - Click on "Show advanced settings"
- Provide a custom index pattern ID (e.g.
id-pfelk) - Click on "Create Index Pattern"
- Next, you'll need to create visualizations based on that index pattern (all visualizations are currently built upon their respective index pattern)
- Finally, you'll create a dashboard utilizing those visualizations
- First, you'll need to create an index pattern
Let me know if you need help...I may be able to assist but keep in mind that I have limited Captive documents and not sure if the data would be presented as needed.
a3ilson
on 19 Jan 2021
I'm working in custom dashboard thanks.
i have a problem in pfelk.grok for pfsense (Captive Portal), when logs contains "spaces" in event.action i get and error ( _grokparsefailure). Here is the logs to fix pfelk.grok:
<166>Jan 20 16:45:37 logportalauth[13236]: Zone: wifiportal - IDLE TIMEOUT: username1, 21:22:ff:ff:ca:sc, 10.1.1.244
I try to fixed but i dont know why split by "-" ignore "spaces".
darvinrivera
on 20 Jan 2021
The issue is the space between "IDLE" and "TIMEOUT"
If we change the GROK pattern from:
%{WORD:[observer][ingress][interface][alias]}:\s%{DATA:[observer][ingress][zone]}\s\-\s%{WORD:[event][action]}\:\s%{GREEDYDATA:[client][user][name]},\s%{MAC:[client][mac]},\s%{IP:[client][ip]}(,\s%{GREEDYDATA:[event][reason]})?
to
%{WORD:[observer][ingress][interface][alias]}:\s%{DATA:[observer][ingress][zone]}\s\-\s%{GREEDYDATA:[event][action]}\:\s%{GREEDYDATA:[client][user][name]},\s%{MAC:[client][mac]},\s%{IP:[client][ip]}(,\s%{GREEDYDATA:[event][reason]})?
This changes the event.action grok filter from WORD to GREEDYDATA and that message matches...however, this breaks previous messages from matching.
So make the follwoing change to the pfelk.grok removing line 11 and added the following:
CP_PFSENSE (%{CAPTIVE1}|%{CAPTIVE2})
CAPTIVE1 %{WORD:[observer][ingress][interface][alias]}:\s%{DATA:[observer][ingress][zone]}\s\-\s%{WORD:[event][action]}\:\s%{GREEDYDATA:[client][user][name]},\s%{MAC:[client][mac]},\s%{IP:[client][ip]}(,\s%{GREEDYDATA:[event][reason]})?
CAPTIVE2 %{WORD:[observer][ingress][interface][alias]}:\s%{DATA:[observer][ingress][zone]}\s\-\s%{GREEDYDATA:[event][action]}\:\s%{GREEDYDATA:[client][user][name]},\s%{MAC:[client][mac]},\s%{IP:[client][ip]}(,\s%{GREEDYDATA:[event][reason]})?
This isn't an ideal pattern but it works. However, before we finalize, let it run and see if additional log variants are captured and require further refinement of the grok pattern.
a3ilson
on 20 Jan 2021
Yes. Work!!! in CP_PFSNSE missing E.
I'm seeing the logs...
Please, can you check this:
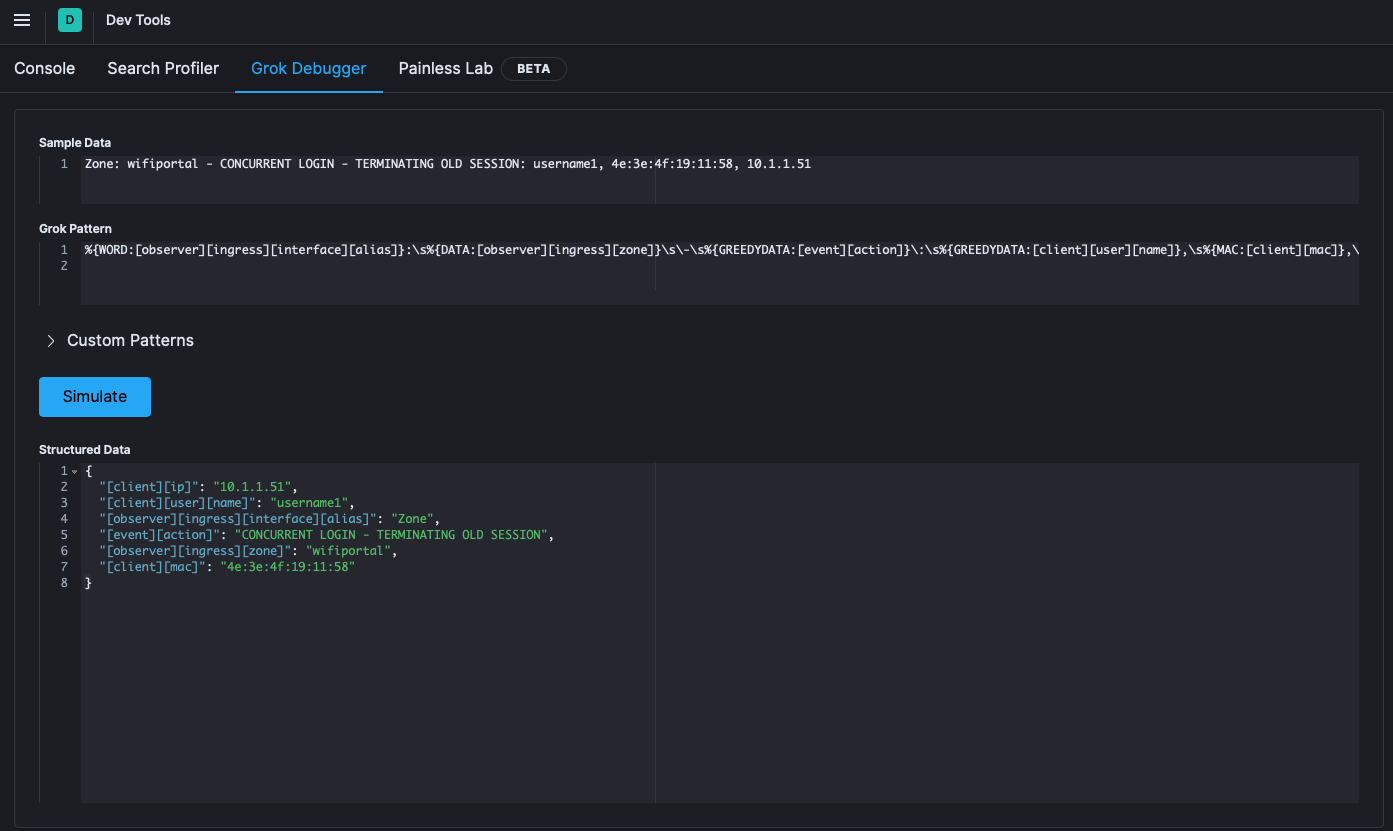
Zone: wifiportal - CONCURRENT LOGIN - TERMINATING OLD SESSION: username1, 51:31:1b:cc:9c:f7, 10.1.1.51
darvinrivera
on 20 Jan 2021
The GROK pattern will match that message.
You can check by utilizing the Grok Debugger within Dev Tools:
a3ilson
on 20 Jan 2021
I wanted you to check because it didn't show up at Discovery. The problem was that this log was my last entry before restarting, i refresh and everything is fine. Thank you so much.
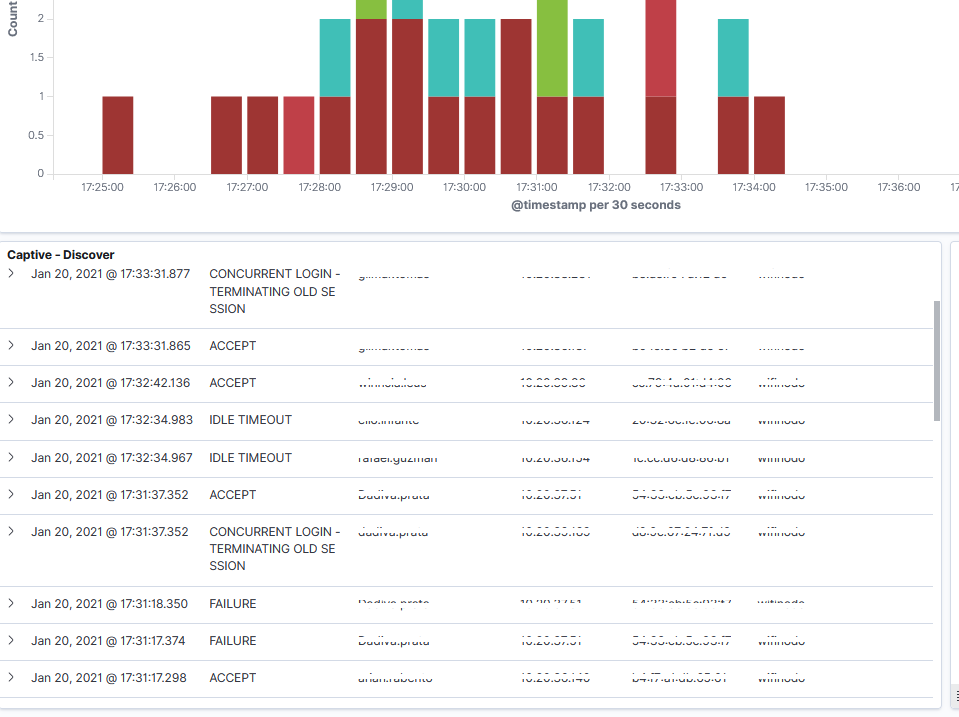
I replaced column 5 in Discovery with the client's mac (client.mac) because that information interests me.
darvinrivera
on 20 Jan 2021
added to pfelk.grok pattern...will refine and clean-up in the future.
a3ilson
on 25 Jan 2021
Related issues
 rrosson
·
14Comments
rrosson
·
14Comments
 squirrelboot
·
12Comments
squirrelboot
·
12Comments
 s7thamon
·
14Comments
s7thamon
·
14Comments
 mango1122
·
3Comments
mango1122
·
3Comments
 revere521
·
17Comments
revere521
·
17Comments