Pfelk: pfELK on UNRAID - Working proof of concept.
So there have been some requests to get pfELK onto UnRAID and that time has come for any of you interested.

I have a working proof of concept and I have documented a guide on my GitHub, I'll post it on @a3ilson Wiki once I have ironed out the bugs and some people have tested it.
This project is a Frankenstein of open source projects, the config of pfELK and the container of sebp/elk with a few modifications to pull in the pfELK configuration files. I've not built a container before so please bare with me. I am open to suggestions for fixing any bugs. 👍
Please raise any issues you find on my GitHub
Pre-Requisite Steps
Make sure you configure the MaxMind GeoIPUpdate container as UnRAID-pfELK depends on this container downloading the database files, if the files are unavailable UnRAID-pfELK will fail to launch. Guide Here
Please ensure that you follow the guide, setup the container storage location and
wgetthe pfELK files into that location before you attempt to build theUnRAID-pfELKcontainer. Guide HereI plan to try and release this as an UnRAID Community Plugin if I can fix the bugs, this means we can have one click installs. However, for now I have made it fairly easy with a one line deployment script from UnRAID Terminal to deploy the container.
Known issues:
- For some reason
pngimages are not showing in the guide or in my git, I'm not sure why I've added images a million times to Git but today they aren't working. - The Container is showing
not availablein UnRAID for update, I've added it to my bugs, I'm not sure how to fix it or what is causing it, I'll do some Googling. Any suggestins welcome 🥇
 noodlemctwoodle
All 44 comments
@a3ilson do you know how to solve this?


noodlemctwoodle
on 4 Oct 2020
@noodlemctwoodle - Are those from one of the dashboards?
Typically, one would need to download the dashboard(s) which contain all the elements. Additionally, you'll need to pay particular attention to step 6a.
 a3ilson
on 4 Oct 2020
a3ilson
on 4 Oct 2020
These are my settings

When I import the Firwall dashboard I get this error

noodlemctwoodle
on 4 Oct 2020
Which conf files are you using? pfelk/docker or pfelk?
a3ilson
on 4 Oct 2020
@noodlemctwoodle - can you confirm that logs are being enriched? Dockers often inhibit the enrichment due to the ip filtering within 02-types.conf.
To check, navigate to the index pattern (Kibana) and check the number of fields and/or pull of the logs within Discover and check to see if they are being parsed.
a3ilson
on 4 Oct 2020
Here are some snips from discover, they look like they are being enriched.


noodlemctwoodle
on 4 Oct 2020
Go to the index pattern within Kibana and refresh the fields.
When the index pattern is initially built, it only builds based on what has currently been seen. If new logs are parsed with previously seen fields, it will result in the error specified. Please note the number of fields. Then refresh the index pattern.
Not related reference but provide to illustrate the above:

a3ilson
on 4 Oct 2020
I have 508 fields, is there a specific requirement?

noodlemctwoodle
on 4 Oct 2020
nope...that looks good. Higher than what i receive but every instance will be different.
a3ilson
on 4 Oct 2020
Which dashboards did you attempt to import? Should be 5.5.1...the 5.5's will not work.
a3ilson
on 4 Oct 2020
I've tried
- v5.5.1 Firewall Dashboard (082820).ndjson
- v5.5.1 Suricata Dashboard (082820).ndjson
- v5.5.1 Snort Dashboard (091420).ndjson
noodlemctwoodle
on 4 Oct 2020
All three are yielding the same errors?
a3ilson
on 4 Oct 2020
They are all yealding the same results. sorry for the zoom on these :|
snort:

Firewall:

Suricata:

noodlemctwoodle
on 4 Oct 2020
Give this a try:
Navigate to your index pattern.
- Delete the index pattern
- Recreate the index pattern with the prescribed settings
a3ilson
on 4 Oct 2020
Sorry, I've actually tried that mutlipe times :( :(
I also did it when you suggested to add the custom field, I did forget that the first time around 👍
I also removed all the objects and started again.
Maybe I'll rebuild the container, see if it fixes it.
noodlemctwoodle
on 4 Oct 2020
eh,
Alright give this a try:
- Stop Logstash
- Purge all
pfelk-*indices (elasticsearch) - Delete the
pfelk-*index pattern - Start Logstash
- Let it run for ~5min and create the index pattern
- Try importing again
a3ilson
on 4 Oct 2020
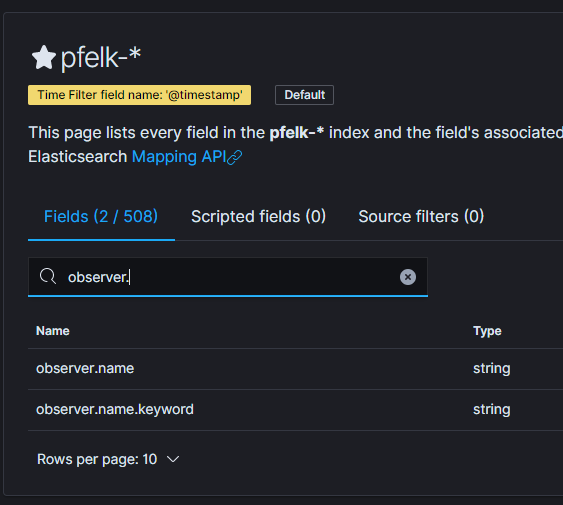
By chance was the observer.type present?
a3ilson
on 4 Oct 2020
Negative
noodlemctwoodle
on 4 Oct 2020
Alright...stop your logstash instance and amend your 02-types.conf as follows:
# 02-types.conf
filter {
### PF ###
  if [type] == "firewall" {
    ### Adjust to match the IP address of pfSense or OPNSense ###
#   if [host] == "192.168.9.1" {
      mutate {
        add_field => [ "[observer][type]", "firewall" ]
      }
#    }
    #########################################################################################
    #To enable or ingest multiple pfSense or OPNsense instances uncomment the below section #
    #########################################################################################
    #if [host] == "192.168.8.1" { ### Adjust to match the IP address of pfSense or OPNSense ###
    #  mutate {
    #    add_field => [ "[observer][type]", "firewall-2" ]
    #  }
    #}
    #########################################################################################
  }
### SURICATA ###
  if [type] == "suricata" {
    ### Adjust to match the IP/Hostname of pfSense or OPNSense ###
#   if [host] == "192.168.9.1" {
      mutate {
        add_field => [ "[observer][type]", "suricata" ]
      }
    }
# }
### HAPROXY ###
  if [type] == "haproxy" {
    ### Adjust to match the IP/Hostname of haproxye ###
    if [host] == "192.168.9.1" {
      mutate {
        add_field => [ "[observer][type]", "haproxy" ]
      }
    }
  }
### BEATS ###
  if [type] == "beats" {
    ### Adjust to match the IP/Hostname of beats ###
#   if [host] == "192.168.9.1" {
      mutate {
        add_field => [ "[observer][type]", "beats" ]
      }
    }
# }
}
Docker containers will typically route the IP address inhibiting the IP filtering. The above removes the IP filtering for systems receiving logs that traverse through routers/networks and/or docker/kubernetes
a3ilson
on 4 Oct 2020
We have observer.type present now :)
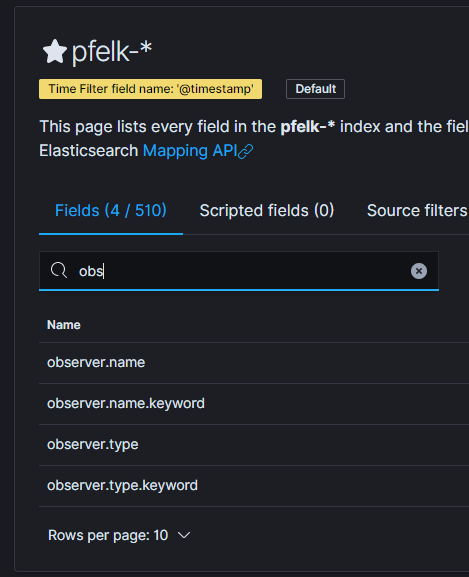
I'll leave it to run for a bit, I have to make dinner now :)
noodlemctwoodle
on 4 Oct 2020
Refresh the index pattern and try importing again.
a3ilson
on 4 Oct 2020
Still not working unfortunately :(
noodlemctwoodle
on 4 Oct 2020
dang...I would purge the indices and pattern and try again. We may also need to compare the fields with another working instance (i.e. identify the cause).
a3ilson
on 4 Oct 2020
I've found this error

noodlemctwoodle
on 4 Oct 2020
What all are you sending to it?
I've got firewall, squid, suricata and unbound but haven't exceeded 300 fields.
a3ilson
on 4 Oct 2020
In Kibana I've got 401.
The error I am seeing in in the logstash-plain.log
I've removed the container and started again to see if it makes any difference :)
It didnt :(
Is there a way I can increase this Limit of total fields [1000] in a config file?
noodlemctwoodle
on 4 Oct 2020
The default is 1000.
This can be remedied with one of the following:
- Increase the default within the template
- Parse out amongst additional patterns
I am curious as to why you have so many fields? Are you ingesting multiple pf/OPNsense instances or do you have other data sets being sent and indexed within the pfelk-* pattern?
a3ilson
on 4 Oct 2020
You can update the pfelk-geoip.json as follows:
{
  "index_patterns" : "pfelk-*",
  "version" : 80001,
  "settings" : {
    "index.mapping.total_fields.limit": 2000,
    "index.refresh_interval" : "5s",
    "number_of_shards": 10
  },
  "mappings" : {
    "dynamic_templates" : [ {
      "message_field" : {
        "path_match" : "message",
        "match_mapping_type" : "string",
        "mapping" : {
          "type" : "text",
          "norms" : false
        }
      }
    }, {
      "string_fields" : {
        "match" : "*",
        "match_mapping_type" : "string",
        "mapping" : {
          "type" : "text", "norms" : false,
          "fields" : {
            "keyword" : { "type": "keyword", "ignore_above": 256 }
          }
        }
      }
    } ],
    "properties" : {
      "destination": {
        "properties": {
          "geo": {
            "dynamic": true,
            "properties": {
              "ip": { "type": "ip" },
              "location" : { "type" : "geo_point" },
              "latitude" : { "type" : "half_float" },
              "longitude" : { "type" : "half_float" }
            }
          }
        }
      },
      "source": {
        "properties": {
          "geo": {
            "dynamic": true,
            "properties": {
              "ip": { "type": "ip" },
              "location" : { "type" : "geo_point" },
              "latitude" : { "type" : "half_float" },
              "longitude" : { "type" : "half_float" }
            }
          }
        }
      }
    }
  }
}
Im not sure if this error is a red hering or not, added the config and still getting the error.
==> /var/log/elasticsearch/elasticsearch.log <==
[2020-10-04T19:14:23,983][INFO ][o.e.a.b.TransportShardBulkAction] [elk] [pfelk-2020.10.04][1] mapping update rejected by primary
java.lang.IllegalArgumentException: Limit of total fields [1000] in index [pfelk-2020.10.04] has been exceeded
at org.elasticsearch.index.mapper.MapperService.checkTotalFieldsLimit(MapperService.java:596) ~[elasticsearch-7.9.2.jar:7.9.2]
at org.elasticsearch.index.mapper.MapperService.internalMerge(MapperService.java:525) ~[elasticsearch-7.9.2.jar:7.9.2]
at org.elasticsearch.index.mapper.MapperService.internalMerge(MapperService.java:427) ~[elasticsearch-7.9.2.jar:7.9.2]
at org.elasticsearch.index.mapper.MapperService.merge(MapperService.java:359) ~[elasticsearch-7.9.2.jar:7.9.2]
at org.elasticsearch.action.bulk.TransportShardBulkAction.executeBulkItemRequest(TransportShardBulkAction.java:281) [elasticsearch-7.9.2.jar:7.9.2]
at org.elasticsearch.action.bulk.TransportShardBulkAction$2.doRun(TransportShardBulkAction.java:164) [elasticsearch-7.9.2.jar:7.9.2]
at org.elasticsearch.common.util.concurrent.AbstractRunnable.run(AbstractRunnable.java:37) [elasticsearch-7.9.2.jar:7.9.2]
at org.elasticsearch.action.bulk.TransportShardBulkAction.performOnPrimary(TransportShardBulkAction.java:209) [elasticsearch-7.9.2.jar:7.9.2]
at org.elasticsearch.action.bulk.TransportShardBulkAction.dispatchedShardOperationOnPrimary(TransportShardBulkAction.java:116) [elasticsearch-7.9.2.jar:7.9.2]
at org.elasticsearch.action.bulk.TransportShardBulkAction.dispatchedShardOperationOnPrimary(TransportShardBulkAction.java:82) [elasticsearch-7.9.2.jar:7.9.2]
at org.elasticsearch.action.support.replication.TransportWriteAction$1.doRun(TransportWriteAction.java:161) [elasticsearch-7.9.2.jar:7.9.2]
at org.elasticsearch.common.util.concurrent.ThreadContext$ContextPreservingAbstractRunnable.doRun(ThreadContext.java:737) [elasticsearch-7.9.2.jar:7.9.2]
at org.elasticsearch.common.util.concurrent.AbstractRunnable.run(AbstractRunnable.java:37) [elasticsearch-7.9.2.jar:7.9.2]
at java.util.concurrent.ThreadPoolExecutor.runWorker(ThreadPoolExecutor.java:1130) [?:?]
at java.util.concurrent.ThreadPoolExecutor$Worker.run(ThreadPoolExecutor.java:630) [?:?]
at java.lang.Thread.run(Thread.java:832) [?:?]

==> /var/log/logstash/logstash-plain.log <==
[2020-10-04T19:14:23,984][WARN ][logstash.outputs.elasticsearch][main][pfelk] Could not index event to Elasticsearch. {:status=>400, :action=>["index", {:_id=>nil, :_index=>"pfelk-2020.10.04", :routing=>nil, :_type=>"_doc"}, #<LogStash::Event:0x3bb09b94>], :response=>{"index"=>{"_index"=>"pfelk-2020.10.04", "_type"=>"_doc", "_id"=>"LmnS9HQBF4pu5WLNZ0ni", "status"=>400, "error"=>{"type"=>"illegal_argument_exception", "reason"=>"Limit of total fields [1000] in index [pfelk-2020.10.04] has been exceeded"}}}}
I am curious as to why you have so many fields? Are you ingesting multiple pf/OPNsense instances or do you have other data sets being sent and indexed within the pfelk-* pattern?
Im only indexing pfSense with Suricata noting else.
6 VLANs and around about 100 connected devices.
noodlemctwoodle
on 4 Oct 2020
Looks like you'll need to increase the field limit before running Logstash...you can try via the template revision or before running logstash run the following:
From withing Kibana>>Dev Tab insert and apply the following:
PUT test_index/_settings
{
  "index.mapping.total_fields.limit": 2000
}
or from the CLI, enter the following:
curl -X PUT localhost:9200/pfelk-geoip/_settings -H 'Content-Type: application/json' -d'{ "index.mapping.total_fields.limit": 1001 }
'
how's this endeavor coming along?
a3ilson
on 13 Oct 2020
Yes, I am interested in this too. I bascially want to run this as docker containers on my Linux box - but I recently migrated from UNRaid so I would think that it wouldn't be that hard to do. The alternative is to figure everything out for myself. I have already tried that with not too much success :)
 klausagnoletti
on 22 Nov 2020
klausagnoletti
on 22 Nov 2020
@klausagnoletti - @noodlemctwoodle has already accomplished what you're looking for. Please take a look at his GitHub repository on the UNRaid instance of pfELK here
a3ilson
on 22 Nov 2020
Yes, I tried it and used it to get the same thing working with https://github.com/sherifabdlnaby/elastdocker instead which I like better than the very monolithic way @noodlemctwoodle did it. I have plans to fork stuff and put it on github at some point. When I do that I will write it in this or in another issue (or whatever you think makes most sense)
Thanks for the great work, everybody
/klaus
klausagnoletti
on 2 Dec 2020
We can reference it from pfelk and/or create a pfelk/unraid repository and add you? Let me know which works best for you.
a3ilson
on 2 Dec 2020
What I have made is not very well suited for unraid since the elastdocker is based on docker-compose which, as far as I know, is unsupported in unraid. So we can either reference it from your repo or you can create another docker repo (which I guess would only make sense if you want to go with my way of doing it going forward. That depends on you :-)
Some of the reasons why I settled on elastdocker is that it supports TLS in the entire stack and the modular setup based on docker-compose (three individual containers that can easily be used with other purposes as well).
/k
klausagnoletti
on 13 Dec 2020
Thanks!
So the ideal (only supported method) unraid pfelk variant would comprise of a docker that is not based upon docker-compose?
a3ilson
on 14 Dec 2020
I've hidden my container from public view as it was causing extremely high CPU usage that would result in UnRAID becoming unstable. I've just simply not had time to troubleshoot the issue and rather than cause this issue on other people's hardware I chose to hide the container until I have some time to look at it. Currently I just send my raw pfSense logs to Azure Sentinel :)
noodlemctwoodle
on 17 Dec 2020
@noodlemctwoodle - Let me know when you have more time to build this out. Reading over Elastic documentation, it appears this may be easier than previously presumed.
- Kibana will run in a docker
- Elasticsearch will run in a docker
- Logstash will run in a docker and pointing to the required config files and patterns appears to be somewhat simple
a3ilson
on 8 Feb 2021
My PC is down currently as I'm putting my RTX 3090 into the water loop. Just waiting on some new fittings to arrive in the post. 🤬
Should be up and running again by next weekend with any luck.
I'll read the links you posted, certainly be happy to push on the development for UnRAID, as my Azure cost is around £200 a month at the moment 🤫
noodlemctwoodle
on 8 Feb 2021
Yikes! Well I'm down a motherboard (home server) which should arrive later this week and I'll build out the docker images for Elasticsearch, Logstash, and Kibana...that should allow you to build the UnRAID piece and close this issue while saving a few pounds. Nice score on the GPU...I'm holding out for inventory (whenever that might be...).
a3ilson
on 8 Feb 2021
Been on the waiting list for 4 months on the GPU. I've been testing it on air for around 3 weeks but now it's stripped down and ready to go in the water loop 🙂
noodlemctwoodle
on 8 Feb 2021
Related issues
 squirrelboot
·
12Comments
squirrelboot
·
12Comments
 rrosson
·
14Comments
rrosson
·
14Comments
 keshif
·
26Comments
keshif
·
26Comments
 InvokerFury
·
20Comments
InvokerFury
·
20Comments
 s7thamon
·
14Comments
s7thamon
·
14Comments