Pester: Invoke-Pester with Code-Coverage taking longer with latest OS update
1. General summary of the issue
Hi Team,
We used to run Pester test cases with Invoke-Pester with -Code-Coverage flag. The build used to make maximum of 10min.
After the recent Microsoft OS updates, build time in invoke-pester increased drastically to 40min and so.
I am wondering if there is anything related to KB article #kb4494441
After i uninstall the KB article, my build time is normal back to 10min. Is there something we need to do in Pester inorder to be compatible with OS patch ?
2. Describe Your Environment
Operating System, windows10
Pester version, 4.8.1
3. Expected Behavior
The build should take on 11 min
4.Current Behavior
Build taking around 42 min
5. Possible Solution
6. Context
 Mahendra1260
All 50 comments
Hello, thanks for the report. Could you provide more info please? This is pretty hard to guess, because it can be caused by pester, or by your code running in pester, or both.
Are you able to identify where it slows down?
Is every test simply slower or there are some test that take way longer, while others run approximately the same?
Are you sure this is because of CodeCoverage? Why do you think that?
 nohwnd
on 31 May 2019
nohwnd
on 31 May 2019
I'm seeing the same issue on Windows 10 and Server 2016 machines with recent Windows Updates. I've got better info on Server 2016. Tests with coverage on are taking 10 times longer on servers with kb4494440 (May 2019) than servers with kb4493470 (April 2019).
Proven on 1 server by removing kb4494440, reboot, and seeing our whole test suite drop from 11 minutes back to 1 minute.
_> Is every test simply slower or there are some test that take way longer, while others run approximately the same?_
Slowdown is on every test. About 5 - 20 times slower on each module.
Demo of issue using your own tests
- Download [https://github.com/pester/Pester/archive/4.8.1.zip] and extract it.
Import-Module .\Pester-4.8.1\Pester.psm1
$testDir = (Get-Module Pester).Path | Split-Path | Join-Path -ChildPath 'Functions\Assertions'
(Invoke-Pester -Script "$testDir\Be.Tests.ps1" -PassThru -Show None).Time.TotalSeconds
(Invoke-Pester -Script "$testDir\Be.Tests.ps1" -PassThru -Show None -CodeCoverage "$testDir\*.ps1").Time.TotalSeconds
The times with CodeCoverage on are going up from 1 seconds to 10 on machines with kb4494440.
I've not spotted any obvious cause in the support article. There are a load of security fixes, but not much detail.
 DavidGibsonNorth
on 31 May 2019
DavidGibsonNorth
on 31 May 2019
@nohwnd for addressing it.
All the tests are taking slightly longer than usual. Once I uninstall the particular update (kb4494441) from machine, everything runs as it was before. This is where I feel its something to do with Pester, the way it runs.
I doubt that it could be due to my code running Pester, because it was working fine till the particular patch is applied and works fine again, if I uninstall the patch
This is how I am running the pester:
_Invoke-Pester $TestFiles -ExcludeTag $excludeTags -CodeCoverage $CodeFiles -PassThru -OutputFormat NUnitXml -OutputFile $config.testResultsFile -CodeCoverageOutputFile $config.coverageFile -Show Fails_
Also, I feel its due to Code coverage as the time taken by the Pester is long with -CodeCoverage flag..
Without CodeCoverage flag, the tests completes pretty smooth.
Mahendra1260
on 31 May 2019
Okay, thank you both for the info. I will try to find out what is wrong. Code coverage depends on breakpoint so hopefully it is not that, and instead it is something less fundamental, like adding to an array that is slower on the fixed systems.
nohwnd
on 2 Jun 2019
Thanks @nohwnd. If you want any more info, or something tested, let me know.
One minor bit of info, I'm seeing the slowdown on a mix of hardware - VMs, tablet & desktops.
DavidGibsonNorth
on 2 Jun 2019
Great to know, I will be testing it on a vm most likely.
nohwnd
on 3 Jun 2019
Yeah one more thing are you running it on PowerShell 5 or 6 or both?
nohwnd
on 3 Jun 2019
PowerShell 5. Using Pester 4.8.1 from GitHub, and Pester 4.8.1 & 4.4.0 from PSGallery.
DavidGibsonNorth
on 3 Jun 2019
Major Minor Build Revision
5 1 17763 503
@nohwnd : I am majorly facing the issue when I give CodeCoverage fllag while invoking Pester.
Mahendra1260
on 3 Jun 2019
@nohwnd - My company is experiencing the exact same problem. It only occurs on some of our test agent machines, not all of them, and I'm not sure what the difference is between the machines. Pester module version is 4.8.1.
Same symptom: When running code coverage, tests take longer to run. Though each individual test case only takes a few extra seconds to run, when added all up across hundreds of tests, it adds up to real money eventually: test suites which used to take about 10-15 minutes to run are now taking about 45-60 minutes to run.
Problem started occurring for us on approximately 2019-05-16, perhaps there was a change in the operating system, or in Powershell, on the prior Patch Tuesday, which Pester isn't very compatible with?
Example output from slow and fast tests, both of these are with version 4.8.1 of Pester but they are on different computers:
Fast:
[21:07:06] :     [Step 2/2] Executing unit tests for 'C:\BuildAgent\work\b41c9303f646ade0\BetaModules\BitTitan.Runbooks.MSOnline\Functions\Block-UntilMSOnlineUserAvailable.ps1'.
[21:07:07] :     [Step 2/2] Executing all tests in 'C:\BuildAgent\work\b41c9303f646ade0\BetaModules\BitTitan.Runbooks.MSOnline\Functions\Block-UntilMSOnlineUserAvailable.Tests.ps1' with Tags unit
[21:07:07] :     [Step 2/2]
[21:07:07] :     [Step 2/2] Executing script C:\BuildAgent\work\b41c9303f646ade0\BetaModules\BitTitan.Runbooks.MSOnline\Functions\Block-UntilMSOnlineUserAvailable.Tests.ps1
[21:07:07] :     [Step 2/2]
[21:07:07] :     [Step 2/2]   Describing BitTitan.Runbooks.MSOnline/Block-UntilMSOnlineUserAvailable
[21:07:07] :     [Step 2/2]
[21:07:07] :     [Step 2/2]     Context when the user is immediately available
[21:07:07] :     [Step 2/2]       [+] returns the user after trying once 81ms
[21:07:07] :     [Step 2/2]
[21:07:07] :     [Step 2/2]     Context when the user is available after 10 tries
[21:07:08] :     [Step 2/2]       [+] returns the user after trying 10 times 605ms
[21:07:08] :     [Step 2/2]
[21:07:08] :     [Step 2/2]     Context when the user is not available
[21:07:09] :     [Step 2/2]       [+] returns null after trying the maximum number of times and outputs an error 1.16s
[21:07:09] :     [Step 2/2] Tests completed in 2.5s
Slow:
[21:07:06] :     [Step 2/2] Executing unit tests for 'C:\BuildAgent\work\b41c9303f646ade0\BetaModules\BitTitan.Runbooks.MSOnline\Functions\Block-UntilMSOnlineUserAvailable.ps1'.
[21:07:06] :     [Step 2/2] Executing all tests in 'C:\BuildAgent\work\b41c9303f646ade0\BetaModules\BitTitan.Runbooks.MSOnline\Functions\Block-UntilMSOnlineUserAvailable.Tests.ps1' with Tags unit
[21:07:06] :     [Step 2/2]
[21:07:06] :     [Step 2/2] Executing script C:\BuildAgent\work\b41c9303f646ade0\BetaModules\BitTitan.Runbooks.MSOnline\Functions\Block-UntilMSOnlineUserAvailable.Tests.ps1
[21:07:06] :     [Step 2/2]
[21:07:06] :     [Step 2/2]   Describing BitTitan.Runbooks.MSOnline/Block-UntilMSOnlineUserAvailable
[21:07:07] :     [Step 2/2]
[21:07:07] :     [Step 2/2]     Context when the user is immediately available
[21:07:07] :     [Step 2/2]       [+] returns the user after trying once 286ms
[21:07:07] :     [Step 2/2]
[21:07:07] :     [Step 2/2]     Context when the user is available after 10 tries
[21:07:11] :     [Step 2/2]       [+] returns the user after trying 10 times 2.78s
[21:07:11] :     [Step 2/2]
[21:07:11] :     [Step 2/2]     Context when the user is not available
[21:07:16] :     [Step 2/2]       [+] returns null after trying the maximum number of times and outputs an error 5.26s
[21:07:16] :     [Step 2/2] Tests completed in 10.1s
 tfabris
on 4 Jun 2019
tfabris
on 4 Jun 2019
Update: Machine differences:
RUNS PESTER SLOW:
ver
Microsoft Windows [Version 10.0.14393]
winver
Version 1607 (OS Build 14393.2999)
RUNS PESTER FAST:
ver
Microsoft Windows [Version 10.0.14393]
winver
Version 1607 (OS Build 14393.2969)
tfabris
on 5 Jun 2019
@SteveL-MSFT are you aware of anything specific that really slowed down in PowerShell 5 after kb4494440? I searched PowerShell repo and did not find anything related to v6 to give me a starting point.
nohwnd
on 5 Jun 2019
@nohwnd I'm not aware of any specific changes in that KB that would have affected WinPS performance. If you can isolate it to a small repro using just PowerShell, I can have someone look into it.
 SteveL-MSFT
on 5 Jun 2019
SteveL-MSFT
on 5 Jun 2019
@nohwnd - @SteveL-MSFT - Any chance it's the recent security fixes, which nerf the speculative execution pipeline on Intel chips? Those are expected to cause performance hits (although not necessarily expected to be this severe).
tfabris
on 5 Jun 2019
Yeah I am suspecting to be the fix for that, but pin-pointing which thing exactly is the hard part :)
nohwnd
on 6 Jun 2019
@nohwnd Does it mean, there will be a fix on Pester side?
Mahendra1260
on 13 Jun 2019
@Mahendra1260 yes, if I find that the slow-down is caused by something that I can avoid in the code.
nohwnd
on 13 Jun 2019
I've seen other reports that the KB associated with speculative execution fix seems to be the cause of perf degradation as uninstalling that specific KB restores perf.
SteveL-MSFT
on 14 Jun 2019
@nohwnd : Not sure if you have any update on the issue
Mahendra1260
on 18 Jun 2019
I can confirm such a behavior on a Windows Server 2019 1809.
 Outek
on 19 Jun 2019
Outek
on 19 Jun 2019
No update yet :/
nohwnd
on 19 Jun 2019
@nohwnd waiting for some update on the issue as this is causing huge performance issue to our system :)
Mahendra1260
on 1 Jul 2019
Tried to replicate this yesterday, but it is fast on all systems I have. I installed 1607 and tried updating it with the kb but it took 3 hours and failed to finish after restart. Any tips how to get the appropriate version? I have msdn, but there I see only a single build of 1607 there, from jan 17 I think.
I will try Windows Server 1809 @Outek could you share the exact version? Is that after some update as well or on clean install?
nohwnd
on 3 Jul 2019
Can't replicate on win server 1809 ( 10.0.17763 ) either.
nohwnd
on 3 Jul 2019
I can still replicate on server build 1607.
This is with update KB4498947 from May plus KB4503267 & KB4503537 from June applied.
The update previous May update KB4494440 was replaced by KB4498947, both exhibited the coverage slowdown.
I can also still replicate on Windows 10 build 1803. 3 post-April KB's applied, KB4497398, KB4503308 & KB4503286.
DavidGibsonNorth
on 3 Jul 2019
I've been able to reproduce this behavior after installing Windows 10 feature update v1809 (updated from v1803).
I know that installing 1709/1803 bare and running Pester without any updates installed will allow code coverage to complete quickly, as I had tested this myself before discovering that the KB(s) referenced above were responsible for breaking it. From there I would try and install the update manually to see if it breaks.
Hope this helps.
 toose
on 3 Jul 2019
toose
on 3 Jul 2019
Tried building 4 vms to do this, but it always don't replicate, or the updates fail to apply and I end up with update rollback. Anyone has public vm that I can use to replicate this?:D
nohwnd
on 5 Jul 2019
I'm on Win 10, 1903 (18362.239) and Pester test cases are running extremely slow.
Tests that used to take milliseconds, now take seconds.
 suprak
on 17 Jul 2019
suprak
on 17 Jul 2019
@suprak Finally that replicates it for me. Windows 10 Bussiness version 1903 (updated July 2019), straight from MSDN (gwmi win32_operatingsystem -> version 10.0.18362).
nohwnd
on 18 Jul 2019
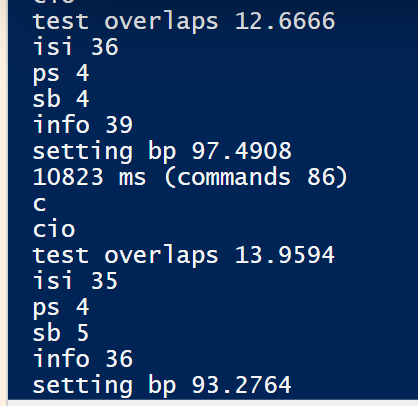
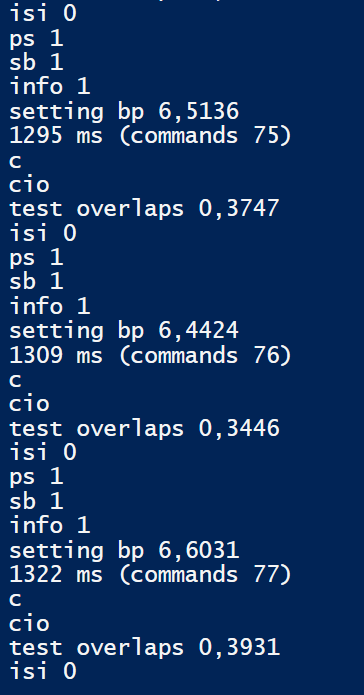
Finally digging through this, this is how much time it takes for different operations in the Enter-CodeCoverage to do their stuff on the affected and non-affected system (values are in ms). A big difference. The repro above is helping me out, but the measurement is measuring only the actual test run, while most of the time (about a minute) is spent preparing the breakpoints.
nohwnd
on 24 Jul 2019
@SteveL-MSFT I have a simple repro. The problem seems to be caused by PSBreakPoint itself. I did not look into it yet, but the execution of all code becomes way slower when any psbreakpoint is present.
Putting the following code into repro.ps1 and running it in a clean session repeatedly you should see that executing the measurement without an breakpoint is fast (<200 ticks). And with a breakpoint it becomes >2000 ticks.
Get-PSBreakpoint | Remove-PSBreakpoint
$sw = [System.Diagnostics.StopWatch]::startnew()
"Without bp:`t$($sw.Elapsed.Ticks)"
$null = Set-PSBreakpoint -Line 2 -Script $PSCommandPath
$sw = [System.Diagnostics.StopWatch]::startnew()
"With bp:`t$($sw.Elapsed.Ticks)"
On systems without the patch it stays roughly the same. Also run the script multiple times, the first run a big hit so the first measurement takes over 10,000 ticks.
I was able to replicate this on Windows 10 Bussiness version 1903 (updated July 2019), straight from MSDN (gwmi win32_operatingsystem -> version 10.0.18362).
It also does the same thing when running in PowerShell ISE. I did not test it in VS Code, but saw that setting breakpoints there is extremely slow even on non-affected systems, so watch out :)
🤒system:
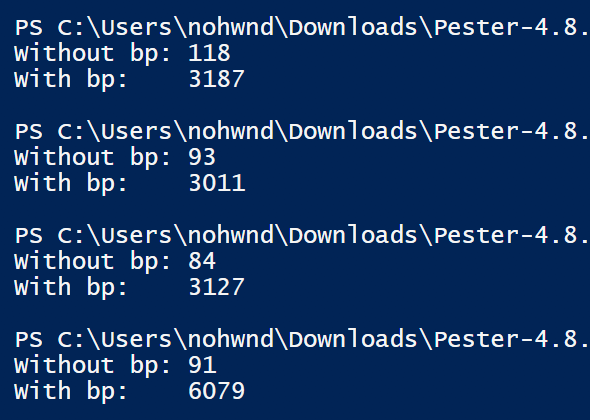
healthy system:
nohwnd
on 24 Jul 2019
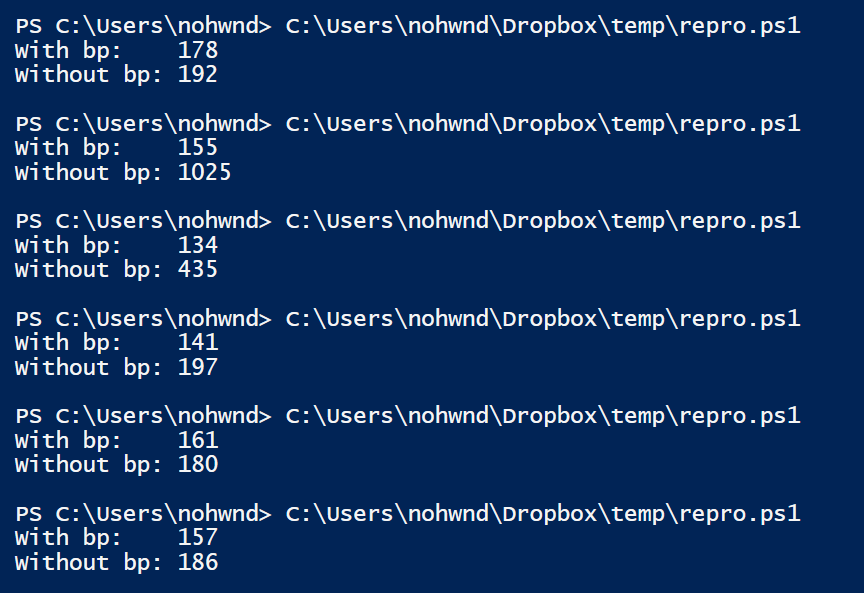
Tested on both PowerShell 5.1 and 6.2.2 and both have the same problem. The time taken goes up with the number of "executed lines", and is affected by adding a foreach and changing the number of loops, as well as simply adding more lines of code. To me it seems that the engine is checking if a breakpoint is present before executing each piece of code, and is using a system call that used to be really cheap, but became expensive with the patch.
Adding this into the second measurement takes ~1,500 vs ~300,000 ticks
foreach ($a in 1..100) {
    $b = 10
}
The execution also seems a bit different on the non patched and patched system where adding the same code into the measurement without breakpoint does not change the time taken on healthy system, on the sick system it raises a bit as well, going from <200 to ~1000.
nohwnd
on 24 Jul 2019
@nohwnd Thanks for the updates and diagnosis. I've replicated & added a comment to Powershell .net class loads slow since MS-Security Update April 2019 #9884
DavidGibsonNorth
on 25 Jul 2019
@nohwnd thanks for identifying a simple repro. It's Hackathon week at Msft, so I'll have someone look into this next week.
SteveL-MSFT
on 25 Jul 2019
I can repo on Windows Server 2019 for Windows PowerShell. Now I am trying to collect traces.
Update. I can repo with @nohwnd script only for Windows PowerShell. For PowerShell Core (6.2.1 and 7.0 Preview) I see stable result - with breakpoint we slow on patched and not patched OS. So I leave the Windows PowerShell issue to MSFT team and will look only Core version that is probably another issue.
 iSazonov
on 26 Jul 2019
iSazonov
on 26 Jul 2019
@nohwnd @SteveL-MSFT Any recent update on the issue?
Mahendra1260
on 19 Aug 2019
The perf regression due to PSBreakPoint is fixed in latest PS7 (preview.3 is expected soon, but you can try the nightly build). The fix will be backported to Windows PowerShell 5.1 (no date as we don't control that).
SteveL-MSFT
on 19 Aug 2019
@SteveL-MSFT thanks for the update and the fix. That's the fix working for me, I tried the nightly build of PowerShell 7 on Server 2016 and Windows 10. On both systems, coverage back to 1.5 minutes for my test suite using PowerShell PS7, at 15 minutes using Powershell 5.1.
DavidGibsonNorth
on 20 Aug 2019
This is the specific PR https://github.com/PowerShell/PowerShell/pull/10269
SteveL-MSFT
on 21 Aug 2019
This is a long shot but I thought I would mention it. When implementing a coverage collector for Ansible using breakpoints like Pester I found that it was performing really poorly. I found that as soon as I set anything to the -Action parameter for Set-PSBreakpoint, even an empty scriptblock, the timeout would just balloon. It confused me because Pester sets -Action {} as per the line in Coverage.ps1 but I never saw this issue. In the end we just don't specify action at all which works just fine for Ansible's case. I have a feeling it might not be viable in Pester due to it entered a nested pipeline and waiting for user input on an interactive console but potentially it's worth investigating.
 jborean93
on 20 Sep 2019
jborean93
on 20 Sep 2019
@jborean93 Thanks for the suggestion, I am afraid this won't help because I was able to reproduce the problem above without using any -Action { }.
nohwnd
on 21 Sep 2019
Darn, thought I would mention it just in case it did help.
jborean93
on 21 Sep 2019
@jborean93 Thanks anyway ☺️
nohwnd
on 24 Sep 2019
Is this still waiting on Powershell 7 to be released to close? Experiencing very slow code coverage when feature is turned on.
 asears
on 22 Jan 2020
asears
on 22 Jan 2020
@asears this should already be included in 6.2.3 (per https://github.com/pester/Pester/issues/1318#issuecomment-523658722), are you using powershellcore on powershell?
nohwnd
on 23 Jan 2020
Using Azure Devops Powershell task.
Tried 4.0
Task         : Azure PowerShell
Description  : Run a PowerShell script within an Azure environment
Version      : 4.159.12
Author       : Microsoft Corporation
Help         : https://aka.ms/azurepowershelltroubleshooting
Tried 5.0
Task         : Azure PowerShell
Description  : Run a PowerShell script within an Azure environment
Version      : 5.165.0
Author       : Microsoft Corporation
Help         : https://aka.ms/azurepowershelltroubleshooting
Azure Pipelines, vs2017-win2016 Agent Specification
Pester v4.10.1
We do have something running at around 12 -15 minutes / build.
We also need a way to consolidate multiple Jacoco.xml summary results to a single file to deal with Devops Code Coverage Publish task limitations. That's not really a Pester issue but if anyone has a method to do so please chime in.
asears
on 25 Feb 2020
@asears At one point in v5 I did this on the breakpoints. I think BPs are accessible on the CC part of result object, so maybe if you saved them into clixml, and then loaded all of them and merged?
https://github.com/pester/Pester/blob/v5.0/Functions/Coverage.ps1#L469
Just explaining this I feel like this is not the way to go, but I already typed it 😁
We probably need to code it ourselves 🙂
nohwnd
on 28 Mar 2020
Just as a FYI, running code coverage in DevOps pipeline with PSCore takes over an hour. Which causes the build to cancel. Locally in PS 6.2.4 it takes 20 min with code coverage enabled.
DevOps Pipeline's $PSVersionTable
Name                           Value
----                           -----
PSVersion                      7.0.0
PSEdition                      Core
GitCommitId                    7.0.0
OS                             Microsoft Windows 10.0.17763
Platform                       Win32NT
PSCompatibleVersions           {1.0, 2.0, 3.0, 4.0…}
PSRemotingProtocolVersion      2.3
SerializationVersion           1.1.0.1
WSManStackVersion              3.0
 johnwc
on 23 Apr 2020
johnwc
on 23 Apr 2020
Locally in PS 6.2.4 it takes 20 min with code coverage enabled.
Can you test with latest PowerShell 7.0 build? And 7.1 Preview2?
iSazonov
on 24 Apr 2020
@iSazonov the DevOps pipeline uses PS 7.0, that is the version table shown.
johnwc
on 26 Apr 2020
Related issues
nohwnd
·
22Comments
 potatoqualitee
·
16Comments
potatoqualitee
·
16Comments
 hero101111
·
34Comments
nohwnd
·
17Comments
hero101111
·
34Comments
nohwnd
·
17Comments
 it-praktyk
·
17Comments
it-praktyk
·
17Comments
Most helpful comment
This is the specific PR https://github.com/PowerShell/PowerShell/pull/10269