Origin: Prometheus `up` metric is still 1 for nodes in NotReady state.
In an attempt to troubleshoot DHCP/PXE I inadvertently reinstalled RHEL on one of my nodes. oc get nodes indicates the node in NotReady as expected. My Prometheus instance down alert never triggers because up metric doesn't reflect actual node ready state.
I use a modified version of the following Prometheus setup with proxy authentication part removed:
https://github.com/openshift/origin/tree/master/examples/prometheus
[root@b18 ~]# oc get nodes
NAME                               STATUS     AGE
b06.jonqe.lab.eng.bos.redhat.com   Ready      21d
b18.jonqe.lab.eng.bos.redhat.com   Ready      21d
b22.jonqe.lab.eng.bos.redhat.com   NotReady   20d
Version
[root@b18 ~]# oc version
oc v3.5.5.24
kubernetes v1.5.2+43a9be4
features: Basic-Auth GSSAPI Kerberos SPNEGO
Server https://b18.jonqe.lab.eng.bos.redhat.com:8443
openshift v3.5.5.24
kubernetes v1.5.2+43a9be4
Steps To Reproduce
- Install OSE3.5 cluster
- Install Prometheus https://github.com/openshift/origin/tree/master/examples/prometheus
- Stop atomic-openshift-node service on one of the nodes to render it NotReady
- Query
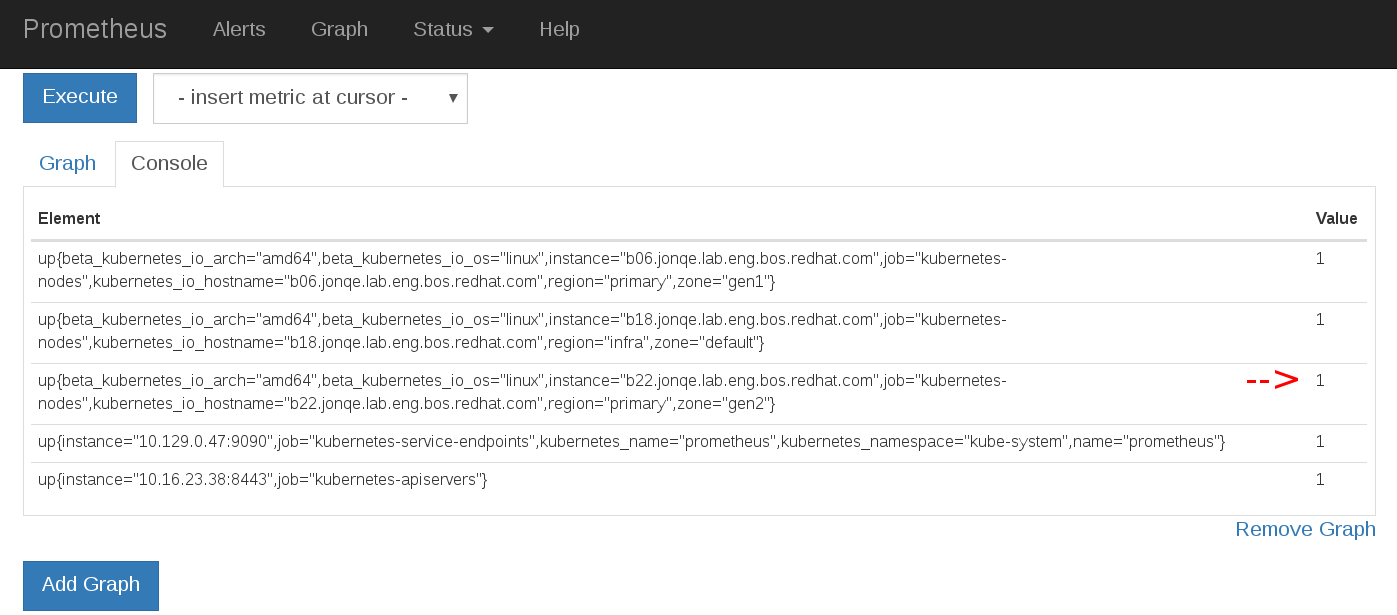
upmetric in Prometheus
Current Result
Prometheus up metrics = 1 for all nodes regardless of actual node status
Expected Result
up metric should reflect node readiness status
 vnugent
All 7 comments
+1
 connormckelvey
on 25 Sep 2017
connormckelvey
on 25 Sep 2017
I believe the up metric is automatically injected by Prometheus to describe Prometheus scraping jobs. It's not a metric provided by the Kubelet. Therefore, it will tell you if your entire node is unreachable by Prometheus, but nothing more than that.
I think this isn't a bug, per se, just a case of needing better documentation (and perhaps a metric that shows ready vs not-ready).
 DirectXMan12
on 31 Oct 2017
DirectXMan12
on 31 Oct 2017
if 'UP' is not usable can you suggest a way to monitor whether Openshift node is in Ready state? it would be very beneficial to cluster admins.
vnugent
on 6 Nov 2017
Issues go stale after 90d of inactivity.
Mark the issue as fresh by commenting /remove-lifecycle stale.
Stale issues rot after an additional 30d of inactivity and eventually close.
Exclude this issue from closing by commenting /lifecycle frozen.
If this issue is safe to close now please do so with /close.
/lifecycle stale
 openshift-bot
on 24 Feb 2018
openshift-bot
on 24 Feb 2018
Stale issues rot after 30d of inactivity.
Mark the issue as fresh by commenting /remove-lifecycle rotten.
Rotten issues close after an additional 30d of inactivity.
Exclude this issue from closing by commenting /lifecycle frozen.
If this issue is safe to close now please do so with /close.
/lifecycle rotten
/remove-lifecycle stale
openshift-bot
on 26 Mar 2018
Rotten issues close after 30d of inactivity.
Reopen the issue by commenting /reopen.
Mark the issue as fresh by commenting /remove-lifecycle rotten.
Exclude this issue from closing again by commenting /lifecycle frozen.
/close
openshift-bot
on 25 Apr 2018
Not sure if people are still looking but node_collector_unhealthy_nodes_in_zone seems to at least give some insight into this.
 jwechsler10
on 22 Jun 2018
jwechsler10
on 22 Jun 2018
Related issues
 slmzig
·
3Comments
slmzig
·
3Comments
 thescouser89
·
3Comments
thescouser89
·
3Comments
 nicolaferraro
·
3Comments
nicolaferraro
·
3Comments
 crobby
·
4Comments
crobby
·
4Comments
 davivd
·
4Comments
davivd
·
4Comments
Most helpful comment
if 'UP' is not usable can you suggest a way to monitor whether Openshift node is in Ready state? it would be very beneficial to cluster admins.