Optuna: Visualizations don't work in Jupyter Lab
Visualizations don't work in Jupyter Lab. I see just empty (white) plots. In Jupyter Notebook everything is OK.
Expected behavior
Visualizations should be available from Jupyter Lab.
Environment
- Optuna version: 1.0.0
- Python version: 3.7.4
- OS: Ubuntu 18.04.3
- (Optional) Other libraries and their versions:
plotly==4.4.1
jupyterlab==1.2.4
jupyterlab-server==1.0.6
Steps to reproduce
- Create a study object.
- Run study.optimize
- Plot any visualization.
Reproducible examples (optional)
optuna.visualization.plot_slice(study)
Or any other plot.
Additional context (optional)
Screenshot of empty visualization:

There is an error in the browser console:


 srizvan
All 4 comments
@srizvan Did you follow the steps stated here?
 harupy
on 16 Jan 2020
harupy
on 16 Jan 2020
@srizvan Thank you for reporting the issue.
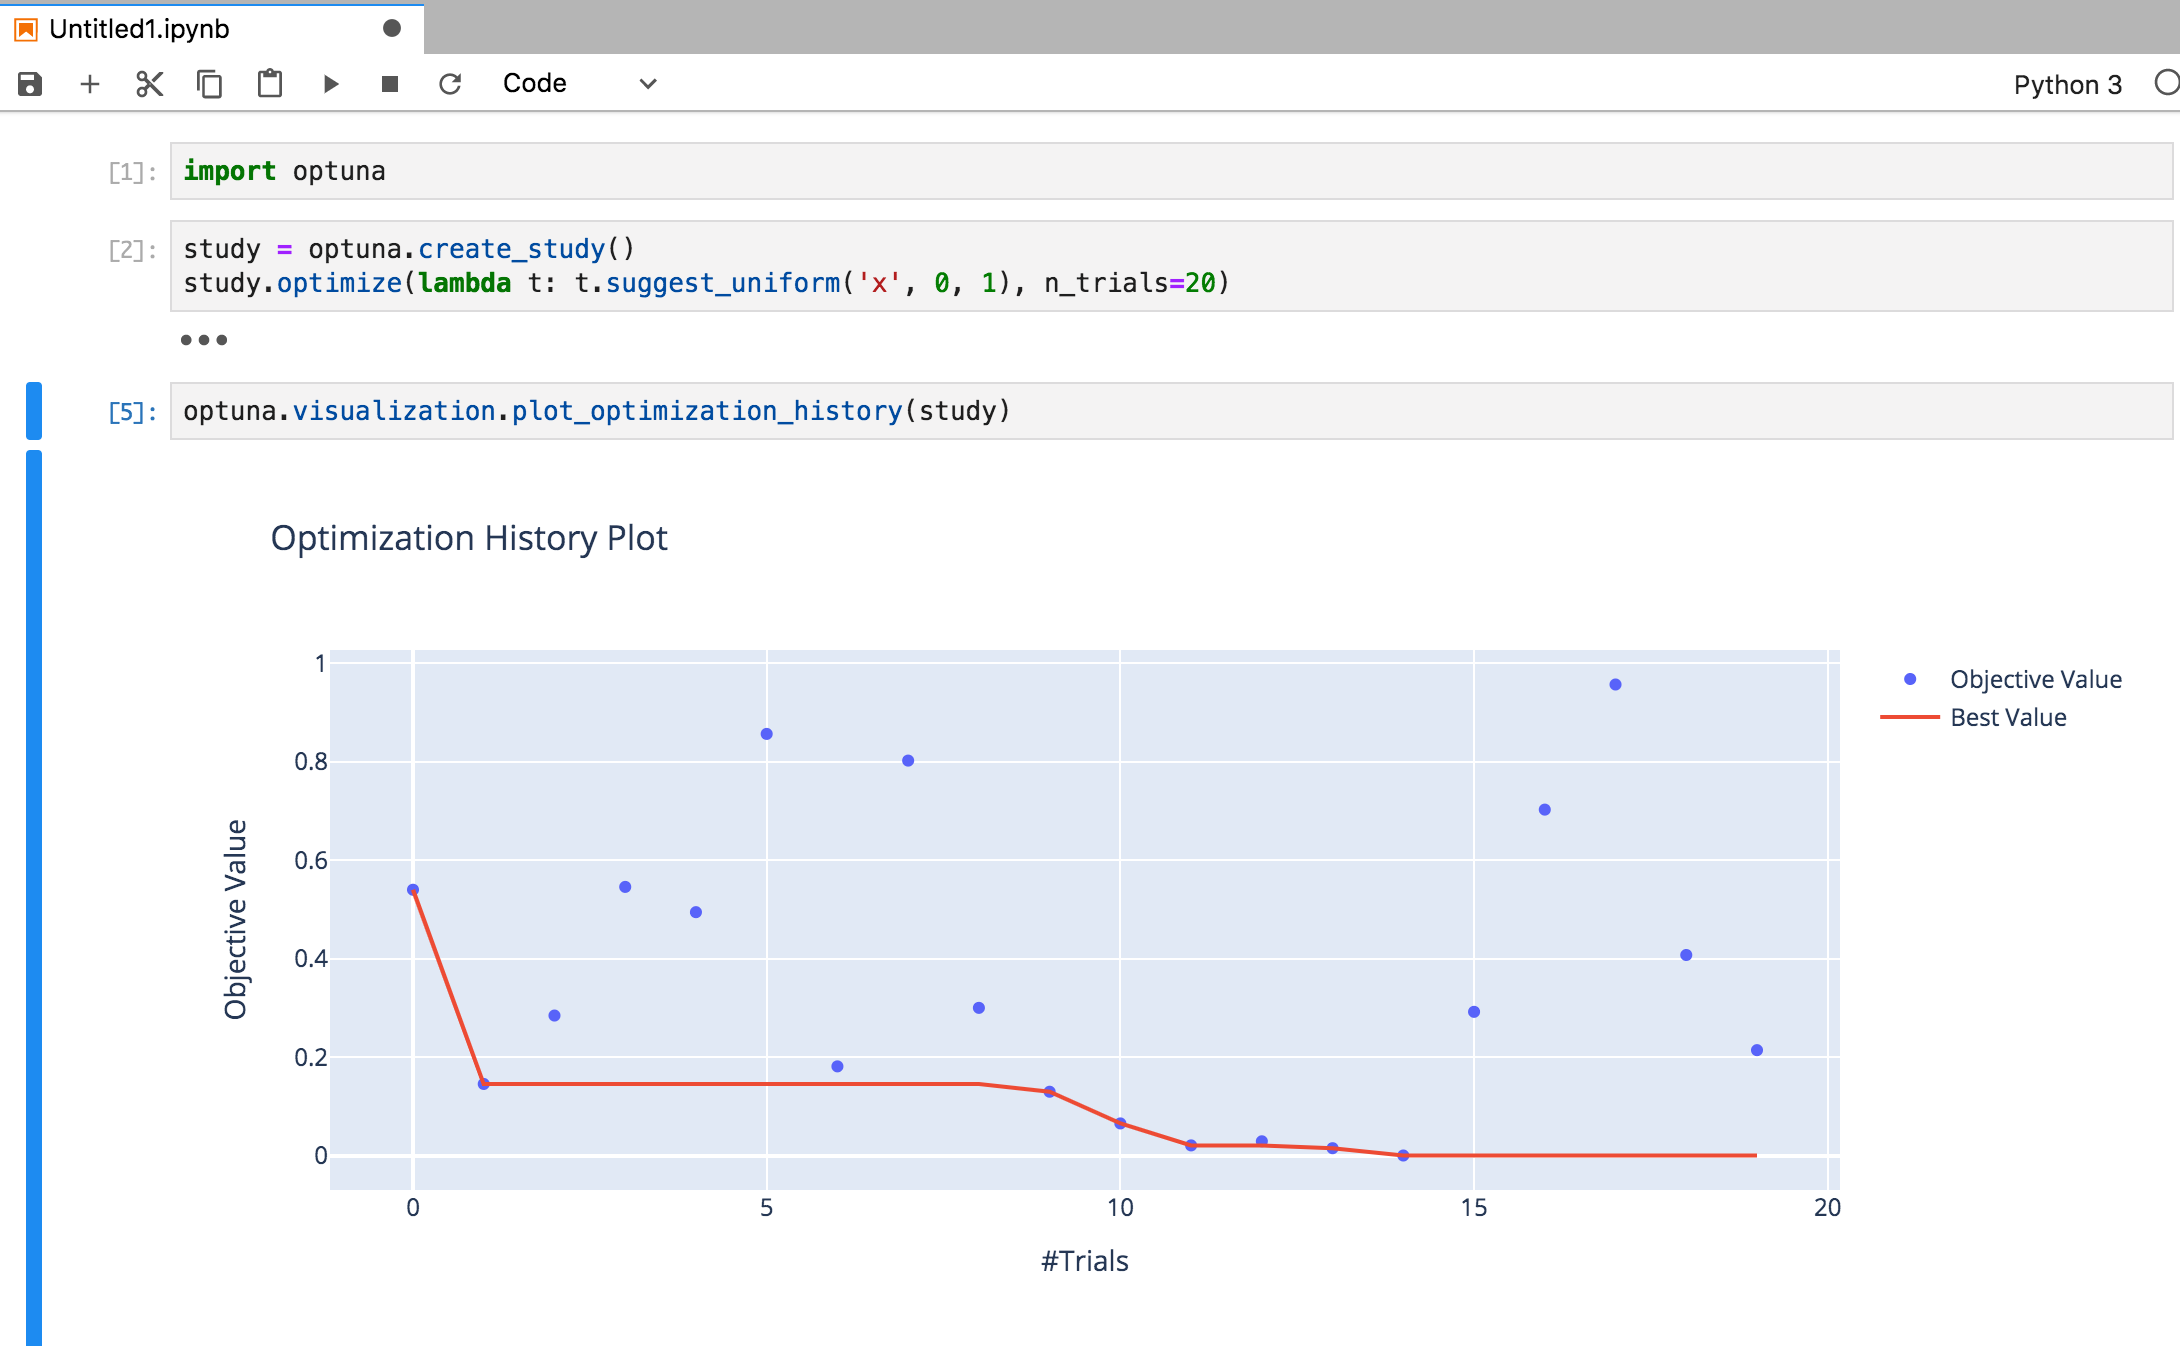
I reproduced your issue and found that the additional installation step suggested by @harupy solved it as follows:
@harupy Thank you for your information.
Environment
- Optuna version: 1.0.0
- Python version: 3.7.2
- OS: macOS 10.13.6
- Other libraries and their versions:
- plotly==4.4.1
- jupyterlab==1.2.4
- jupyterlab-server==1.0.6
 toshihikoyanase
on 16 Jan 2020
toshihikoyanase
on 16 Jan 2020
@harupy Yeah, that worked for me. Thank you.
I think, link to these additional steps should be provided in optuna docs in the "Installation" section.
srizvan
on 16 Jan 2020
@srizvan Thank you for your feedback.
I created a PR (https://github.com/optuna/optuna/pull/843) to update the document for JupyterLab users to solve this issue. Please let me know if you have any comments.
toshihikoyanase
on 17 Jan 2020
Related issues
 ytknzw
·
3Comments
ytknzw
·
3Comments
 licsh
·
3Comments
licsh
·
3Comments
 djKooks
·
4Comments
djKooks
·
4Comments
 mateuszpieniak
·
3Comments
toshihikoyanase
·
3Comments
mateuszpieniak
·
3Comments
toshihikoyanase
·
3Comments
Most helpful comment
@srizvan Thank you for your feedback.
I created a PR (https://github.com/optuna/optuna/pull/843) to update the document for
JupyterLabusers to solve this issue. Please let me know if you have any comments.