Optuna: `plot_parallel_coordinate` connects data points from different trials when `objective` function has conditional branches.
Expected behavior
The plot_parallel_coordinate function connects data points only from the same trial.
Environment
- Optuna version: 2.0.0
- Python version: 3.7.3
- OS: macOS 10.14.6
- plotly: 4.9.0
Error messages, stack traces, or logs
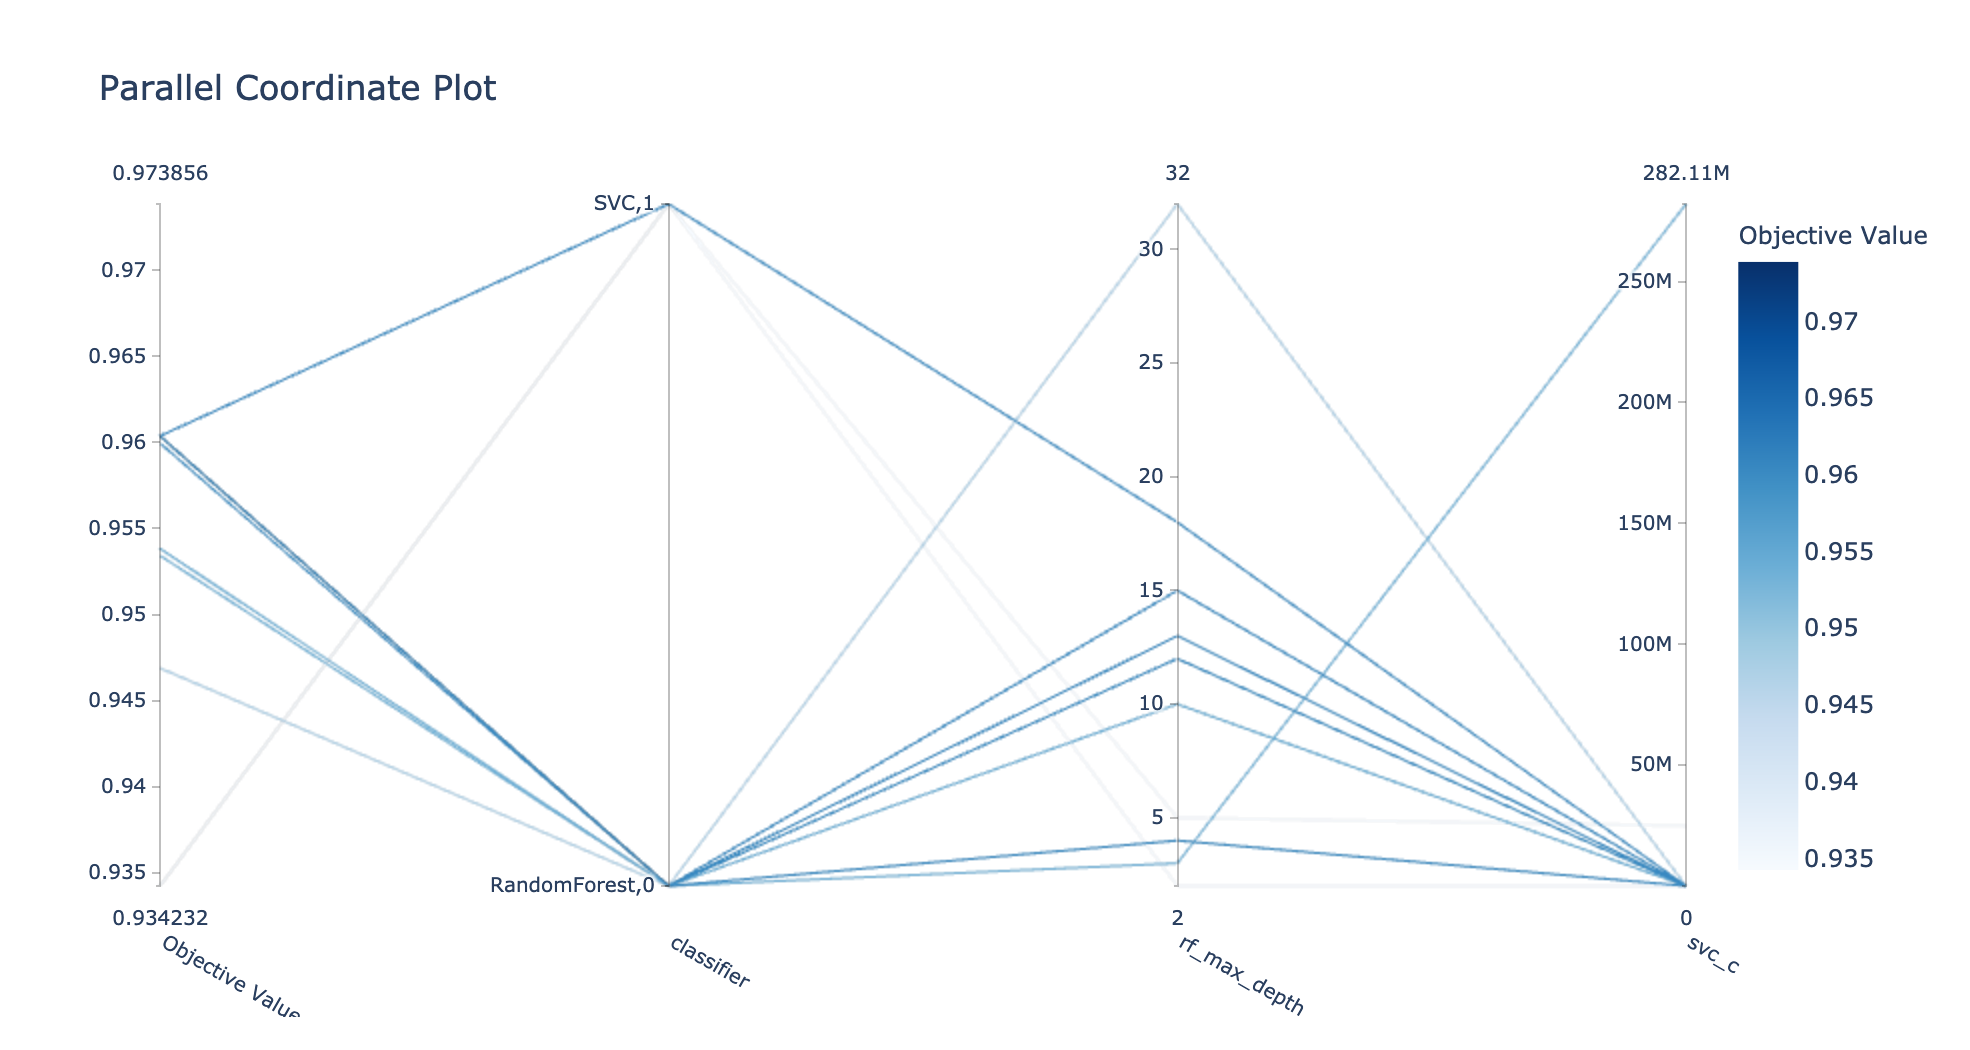
No error message but the plot_parallel_coordinate function connects data points from different trials when objective function has conditional branches. In the graph below, lines that go through SVC,1 on the classifier axis should not go through any data point on the rf_max_depth axis, and lines that go through RandomForest,0 on the classifier axis should not go through any data point on the svc_c axis.
Steps to reproduce
- Run the example code below.
Reproducible examples (optional)
import sklearn.datasets
import sklearn.ensemble
import sklearn.svm

import optuna
from optuna.visualization import plot_parallel_coordinate


def objective(trial):
    iris = sklearn.datasets.load_iris()
    x, y = iris.data, iris.target

    classifier_name = trial.suggest_categorical("classifier", ["SVC", "RandomForest"])
    if classifier_name == "SVC":
        svc_c = trial.suggest_float("svc_c", 1e-10, 1e10, log=True)
        classifier_obj = sklearn.svm.SVC(C=svc_c, gamma="auto")
    else:
        rf_max_depth = trial.suggest_int("rf_max_depth", 2, 32, log=True)
        classifier_obj = sklearn.ensemble.RandomForestClassifier(
            max_depth=rf_max_depth, n_estimators=10
        )

    score = sklearn.model_selection.cross_val_score(classifier_obj, x, y, n_jobs=-1, cv=3)
    accuracy = score.mean()
    return accuracy


study = optuna.create_study(direction="maximize")
study.optimize(objective, n_trials=100)

plot_parallel_coordinate(study).show()
Additional context (optional)
Cause: the data set prepared for plotting has different numbers of data points for the rf_max_depth axis and the svc_c axis and has no nan value, so the values move up and the data set looks like below:
|Trial|Objective value|classifier|rf_max_depth|svc_c|
|---|---|---|---|---|
|0|0.960375816993464|'RandomForest'|13|75.13951931369364|
|1|0.960375816993464|'RandomForest'|4|0.04713959605198702|
|2|0.960375816993464|'SVC'|18|2.0796584634335666e-05|
|3|0.9534313725490197|'RandomForest'|3|282106030.95909935|
|4|0.9342320261437909|'SVC'|2|2.473246123121966e-10|
|...|...|...|...|...|
while it should be:
|Trial|Objective value|classifier|rf_max_depth|svc_c|
|---|---|---|---|---|
|0|0.960375816993464|'RandomForest'|13|nan|
|1|0.960375816993464|'RandomForest'|4|nan|
|2|0.960375816993464|'SVC'|nan|75.13951931369364|
|3|0.9534313725490197|'RandomForest'|18|nan|
|4|0.9342320261437909|'SVC'|nan|0.04713959605198702|
|...|...|...|...|...|
 ytknzw
All 3 comments
Thank you for reporting the issue.
I think the following code will connect different trials if parameter values are missing.
IMO, the trials that have missing parameter values could be excluded from the plot. This is because
- we expected such behavior when we wrote the document, and
- other functions like hyperparamter importance also remove such trials.
 toshihikoyanase
on 15 Sep 2020
toshihikoyanase
on 15 Sep 2020
Thank you for your comment.
I fixed this issue in the commit https://github.com/optuna/optuna/pull/1764/commits/8a4a8d830755a40c192750ee2895ada57bd771ee of PR #1764 for the Matplotlib backend while the Plotly backend remains unfixed.
ytknzw
on 20 Sep 2020
This issue has not seen any recent activity.
![github-actions[bot] picture](https://avatars2.githubusercontent.com/in/15368?v=4&s=40) github-actions[bot]
on 5 Oct 2020
github-actions[bot]
on 5 Oct 2020
Related issues
toshihikoyanase
·
3Comments
 himkt
·
4Comments
himkt
·
4Comments
 bjoernholzhauer
·
3Comments
bjoernholzhauer
·
3Comments
 mateuszpieniak
·
3Comments
mateuszpieniak
·
3Comments
 ChenjunZou
·
4Comments
ChenjunZou
·
4Comments