Opentelemetry-dotnet: Feature Request: Attach log messages to Activity.Events
[This came out of a discussion on gitter with @jchannon.]
Feature Request
OpenTracing.Contrib.NetCore will register an ILoggerProvider\ILogger which will attach log messages to a span and these are exported to Jaeger.
The ask is to have a similar mechanism in OpenTelemetry .NET.
Design
Our JaegerExporter is already coded to convert ActivityEvents into JaegerLogs:
https://github.com/open-telemetry/opentelemetry-dotnet/blob/6fe93f8d79725d696e01090ab531585881636850/src/OpenTelemetry.Exporter.Jaeger/Implementation/JaegerActivityExtensions.cs#L158-L175
Given that behavior, the idea is to add a BaseProcessor<LogRecord> which will convert log messages written through ILogger into ActivityEvents and add them to Activity.Current.Events. Presumably only when Activity.IsAllDataRequested = true but this could be configurable.
This will be something you will have to explicitly turn on because it is expensive.
Proposed API
Coming soon...
 CodeBlanch
All 15 comments
Is there any way to send logs to Jaeger meanwhile?
 iSeiryu
on 11 Feb 2021
iSeiryu
on 11 Feb 2021
It seems to add Open Telemetry logs support, I have to additionally configure logging like so, in addition to calling services.AddOpenTelemetryTracing():
public static IHostBuilder CreateHostBuilder(string[] args) =>
    Host.CreateDefaultBuilder(args)
        .ConfigureWebHostDefaults(webBuilder =>
    {
        webBuilder.ConfigureLogging(x =>
        {
            x.AddOpenTelemetry();
        })
        webBuilder.UseStartup<Startup>();
    });
Does that help give us logs in Jaeger? Also, if I'm using Serilog in an ASP.NET Core application, will this still work?
 RehanSaeed
on 11 Feb 2021
RehanSaeed
on 11 Feb 2021
It does not seem to work. I tried all sorts of combnations of
LoggerFactory.Create(builder => builder.AddOpenTelemetry(x => x.AddConsoleExporter()));
and
.ConfigureWebHostDefaults(webBuilder =>
    webBuilder
        .ConfigureLogging(x => x.AddOpenTelemetry(options => options.AddConsoleExporter()))
        .UseStartup<Startup>());
They only have AddConsoleExporter() so far. It's located here https://github.com/open-telemetry/opentelemetry-dotnet/blob/e438998ffc785137d9402485db9a813e7e0e4a04/src/OpenTelemetry.Exporter.Console/ConsoleExporterLoggingExtensions.cs
I have not seen any other *ExporterLoggingExtensions. It would be great to have those for Jaeger, Zipkin, New Relic, etc.
I'm trying to implement a custom processor for Jaeger meanwhile.
Also, if I'm using Serilog in an ASP.NET Core application, will this still work?
I found 2 old issues opened for it. They came to a solution but I cannot figure out how to make it work without writing tons of code
https://github.com/jaegertracing/jaeger-client-csharp/issues/146
https://github.com/opentracing-contrib/csharp-netcore/issues/42
iSeiryu
on 11 Feb 2021
The logging code in 1.0 registers an ILoggerProvider which will create ILoggers that call this line:
Any time a log message is written, the registered BaseProcessor<LogRecord> will be called. The problem is, there's no BaseProcessor<LogRecord> implementation in there. If you build your own, you can make it work.
That's exactly what I'm going to do for this issue/feature. I'm going to create a BaseProcessor<LogRecord> that adds the log messages to Activity.Events so they will export to Jaeger. Now that 1.0 is out, I'll get back to that. But if you want to give it a shot feel free 😄
Also, if I'm using Serilog in an ASP.NET Core application, will this still work?
Only if you are using serilog-extensions-logging which will write through ILogger before Serilog's custom logger.
CodeBlanch
on 11 Feb 2021
Would it also work with the Serilog.AspNetCore package? I'm also thinking that there is far less of a reason to use Serilog with Open Telemetry, so perhaps removing it is also an option.
RehanSaeed
on 11 Feb 2021
@RehanSaeed
Would it also work with the Serilog.AspNetCore package?
I don't _think_ so. When you write your log messages in your app, what type of logger instance are you using? If it is .NET ILogger you are most likely good to go. If it is Serilog ILogger it won't work OOB.
CodeBlanch
on 11 Feb 2021
there is far less of a reason to use Serilog with Open Telemetry
I wonder the same thing. If we enable OT and plug console + exporter of our choice (Zipkin, NR, Jaeger, Splunk, etc.) it should in theory do the same what Serilog does + a lot more. Exporter is kinda like Serilog's sink.
Am I getting it all wrong?
The only part I'm missing is how I would do logs in Program.cs scope. Currently I do this in my AspNetCore project:
public static async Task<int> Main(string[] args) {
    BuildLogger();

    try {
        Log.Information("Starting the host...");
        using var host = CreateHostBuilder(args).Build();
        await host.RunAsync();

        return 0;
    }
    catch (Exception ex) {
        Log.Fatal(ex, "Host terminated unexpectedly");
        return 1;
    }
    finally {
        Log.CloseAndFlush();
    }
}

private static void BuildLogger() {
    var environment = Environment.GetEnvironmentVariable("ASPNETCORE_ENVIRONMENT");
    var configuration = new ConfigurationBuilder()
            .SetBasePath(Directory.GetCurrentDirectory())
            .AddJsonFile("appsettings.json")
            .AddJsonFile($"appsettings.{environment}.json",
                optional: true,
                reloadOnChange: true)
            .Build();

    Log.Logger = new LoggerConfiguration()
                        .ReadFrom.Configuration(configuration)
                        .CreateLogger();

    Serilog.Debugging.SelfLog.Enable(Console.WriteLine);
}
Log object belongs to Serilog.
They do mention here that you can enable Microsoft.Extensions.Logging.ILoggerProvider
https://github.com/serilog/serilog-aspnetcore#enabling-microsoftextensionsloggingiloggerproviders
Not sure how OT and Serilog could work together side-by-side though.
iSeiryu
on 11 Feb 2021
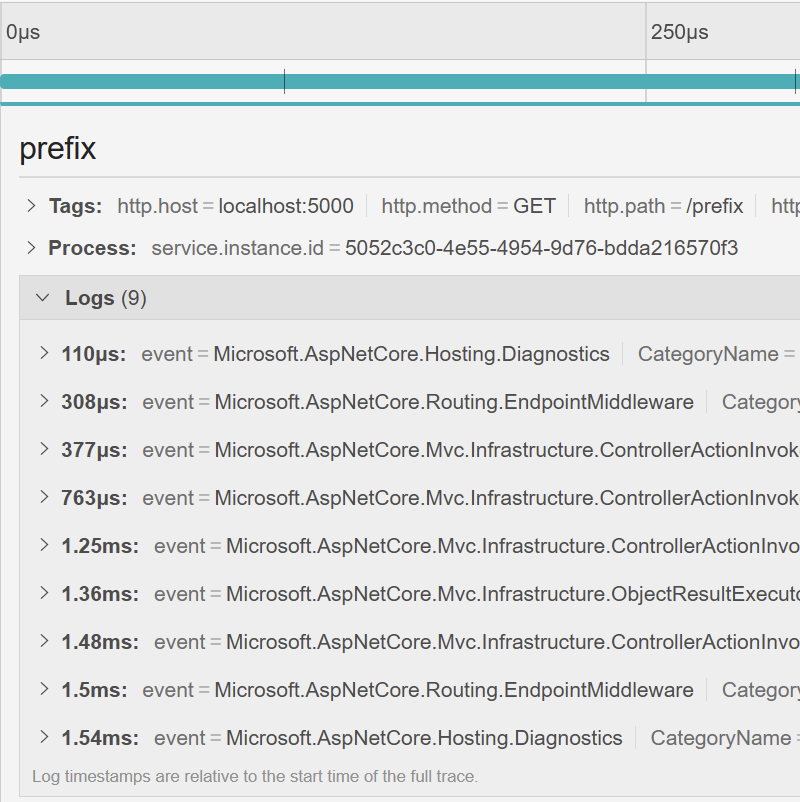
@CodeBlanch Something like this? https://github.com/iSeiryu/opentelemetry-dotnet/commit/c13208510f8139bdeac966298fd911db31170dcd
Since there is no proper example for classes like that (the only existing one is for Console and it uses BaseExporter<LogRecord> instead of BaseProcessor<LogRecord>) I probably messed up some naming conventions.
I tested it on local and it works. It logs general system and custom logs as well as the exceptions. I left the options empty but I'm sure it would require some configuration.
iSeiryu
on 11 Feb 2021
Nice!
On Thu, 11 Feb 2021 at 22:43, iSeiryu notifications@github.com wrote:
@CodeBlanch https://github.com/CodeBlanch Something like this? iSeiryu@
2c2efa7
https://github.com/iSeiryu/opentelemetry-dotnet/commit/2c2efa783eebfbd8943e65dc65b63e0c5164ea5bSince there is no proper example for classes like that (the only existing
one is for Console and it uses BaseExporterinstead of
BaseProcessor) I probably messed up some naming conventions. I tested it on local and it works. It logs general system and custom logs
as well as the exceptions. I left the options empty but I'm sure it would
require some configuration.[image: image]
https://user-images.githubusercontent.com/129137/107707420-d3889980-6c8f-11eb-9c3f-3a43aac6b035.png—
You are receiving this because you were mentioned.
Reply to this email directly, view it on GitHub
https://github.com/open-telemetry/opentelemetry-dotnet/issues/1739#issuecomment-777841656,
or unsubscribe
https://github.com/notifications/unsubscribe-auth/AAAZVJUPOJEB7US2MEBVK7TS6RMQ5ANCNFSM4WYCBUEA
.
 jchannon
on 12 Feb 2021
jchannon
on 12 Feb 2021
@iSeiryu Looks good! There's nothing really Jaeger-specific about it, so I was thinking it would be part of SDK. Something like ActivityEventAttachingLogProcessor? Not sure... I was going to throw up a proposal on this issue and then get people's opinions on it. Some other things I'm mulling over...
- Should we check Activity.Current.IsAllDataRequested before adding the events?
- Are there any semantic conventions we should use for the names of the tags on the events? Need to poke around the spec a bit. I was also going to also look at what OpenTracing is doing more deeply.
Feel free to incorporate any of that feedback and I'll just use yours as the proposal 😄
CodeBlanch
on 12 Feb 2021
Sure, will do. I have not checked what other exporters do. Sounds like all of them use the same Activity object in which case there is nothing Jaeger specific.
I'm assuming the log processors will obey the log levels too? So Error and Warning levels shouldn't get too much traffic.
IsAllDataRequested - what would this flag exclude exactly? Certain fields/types of logs?
iSeiryu
on 12 Feb 2021
I wonder the same thing. If we enable OT and plug console + exporter of our choice (Zipkin, NR, Jaeger, Splunk, etc.) it should in theory do the same what Serilog does + a lot more. Exporter is kinda like Serilog's sink.
@iSeiryu
Agreed, although Open Telemetry is still very immature and does not have the breadth of plugins like Serilog. For example, the console logging plugin for Serilog is a lot nicer than the one in Open Telemetry. So for now, I think it makes sense to use both but probably not for long.
It's also worth mentioning that as well as pushing logs through Open Telemetry, it's possible to do the opposite and push traces/spans through Serilog using a library I own called Serilog.Enrichers.Span.
Should we check Activity.Current.IsAllDataRequested before adding the events?
@CodeBlanch
My understanding about this field is that it is called IsRecording in the spec. It can be set to false when sampling is enabled, to reduce the overhead of recording telemetry for every code execution. I believe it's something that should always be checked before adding events/attributes to a span.
RehanSaeed
on 12 Feb 2021
@iSeiryu
I'm assuming the log processors will obey the log levels too? So Error and Warning levels shouldn't get too much traffic.
Correct. The log messages that make it to your LogProcessor will only be the ones the hosting application has configured to care about. That is taken care of by this check:
IsAllDataRequested - what would this flag exclude exactly? Certain fields/types of logs?
Basically in your code just make the if do this:
            if (Activity.Current != null && Activity.Current.IsAllDataRequested)
            {
                    // Build ActivityEvent and add to Activity.Current
            }
@RehanSaeed
My understanding about this field is that it is called IsRecording in the spec. It can be set to false when sampling is enabled, to reduce the overhead of recording telemetry for every code execution. I believe it's something that should always be checked before adding events/attributes to a span.
There's actually 2 flags! Activity.Recorded & Activity.IsAllDataRequested. But yes, ties into sampling. Here's how the runtime sets the flags based on the response we give them:
Our logic for translating SDK sampling results to .NET:
CodeBlanch
on 12 Feb 2021
Question: are those attributes part of the OT spec? Will all exporters support them?
public const string AttributeExceptionEventName = "exception";
public const string AttributeExceptionType = "exception.type";
public const string AttributeExceptionMessage = "exception.message";
public const string AttributeExceptionStacktrace = "exception.stacktrace";
I've seen those in OT spec
attributes["error.code"]
attributes["error.id"]
attributes["error.message"]
attributes["error.stack_trace"]
I tried to plug some exceptions to those attributes and both Zipkin and Jaeger display them as expected.
iSeiryu
on 19 Feb 2021
@iSeiryu Defined here: https://github.com/open-telemetry/opentelemetry-specification/blob/main/specification/trace/semantic_conventions/exceptions.md
CodeBlanch
on 19 Feb 2021
Related issues
 fbeltrao
·
5Comments
fbeltrao
·
5Comments
 lmolkova
·
4Comments
lmolkova
·
4Comments
 SergeyKanzhelev
·
4Comments
SergeyKanzhelev
·
4Comments
 guitarrapc
·
3Comments
guitarrapc
·
3Comments
 ddiaz-relativity
·
4Comments
ddiaz-relativity
·
4Comments
Most helpful comment
The logging code in 1.0 registers an
ILoggerProviderwhich will createILoggersthat call this line:https://github.com/open-telemetry/opentelemetry-dotnet/blob/3239e5b02f639779d93b22427fece7370579432b/src/OpenTelemetry/Logs/OpenTelemetryLogger.cs#L52
Any time a log message is written, the registered
BaseProcessor<LogRecord>will be called. The problem is, there's noBaseProcessor<LogRecord>implementation in there. If you build your own, you can make it work.That's exactly what I'm going to do for this issue/feature. I'm going to create a
BaseProcessor<LogRecord>that adds the log messages toActivity.Eventsso they will export to Jaeger. Now that 1.0 is out, I'll get back to that. But if you want to give it a shot feel free 😄Only if you are using serilog-extensions-logging which will write through
ILoggerbefore Serilog's custom logger.