Openfoodnetwork: French and UK production falling down from time to time
Description
Regularly and during few minutes the whole platform is not accessible anymore.
I've experienced it live on Monday evening: I was online adding a link in a footer in super admin configurations, once I've hit "save" the page loaded a long time until the friendly snail came along.
Trying to load the website in a incognito mode had the same result.
After a few minutes, the website was up again, and I could save my footer link very quickly.
Unfortunately, I didn't have dev tools on when doing this :(
Expected Behavior
The platform should be available all the time
Actual Behaviour
It is not.
Steps to Reproduce
So far, no idea, but we see repeated errors in monitoring tools
Animated Gif/Screenshot


Severity
bug-s2: a non-critical feature is broken, no workaround
Your Environment
- Version used: 1.26.1
- Browser name and version: Firefox 64
- Operating System and version (desktop or mobile): Ubuntu 18.10
 RachL
RachL
All 28 comments
I would argue that this issue can break any critical feature like login and checkout. While the server is busy with two requests, nobody can do anything on the site. The way forward is:
- identify the critical requests that take too long
- estimate a proper solution to solve this delay
- review and prioritise each task on the found performance issues
We may find that some parts are bug-s2 and others may not be as important.
 mkllnk
on 15 Feb 2019
mkllnk
on 15 Feb 2019
- identify the critical requests that take too long
Yes, I think we need to spike this trying to infer the requests from @RachL 's description and correlating them with the shared screenshots although it's possible we won't reach any conclusion. If so, I'd create the necessary issues to add the required monitoring data to investigate this further.
 sauloperez
on 15 Feb 2019
sauloperez
on 15 Feb 2019
Skylight doesn't seem to report any of the requests that take really long. So I looked into the French production log.
egrep 'Completed|Started' production.log | less
# Search for requests with 5 digit durations in milliseconds:
# /Completed ...... in .....\.
It's not 100% clear in the log file which requests take that long but I can guess. Here are some examples from the log file:
Started GET "/admin/enterprises"
Completed 200 OK in 15941.1ms (Views: 10613.8ms | ActiveRecord: 5269.9ms)

Started POST "/user/spree_user/sign_in"
Started GET "/map"
Completed 200 OK in 22812.2ms (Views: 11551.8ms | ActiveRecord: 11244.8ms)

Started POST "/admin/orders/invoices"
Started GET "/admin/enterprises/visible.json?ams_prefix=basic"
Completed 200 OK in 10102.7ms (Views: 0.4ms | ActiveRecord: 10029.0ms)

Started GET "/shops"
Started GET "/admin/order_cycles"
Completed 200 OK in 12779.5ms (Views: 6097.4ms | ActiveRecord: 6254.8ms)

Started PUT "/admin/enterprises/paniers-bio-mauriennais"
Started GET "/admin/enterprises"
Completed 200 OK in 15832.2ms (Views: 10658.0ms | ActiveRecord: 5075.5ms)

Started POST "/admin/reports/orders_and_fulfillment"
Completed 200 OK in 20928.1ms (Views: 1143.2ms | ActiveRecord: 7414.2ms)

Started GET "/producers"
Completed 200 OK in 30521.9ms (Views: 18328.3ms | ActiveRecord: 12189.1ms)
Completed 200 OK in 29022.1ms (Views: 17540.6ms | ActiveRecord: 11477.2ms)
Completed 200 OK in 21126.0ms (Views: 11211.2ms | ActiveRecord: 9912.9ms)

Started GET "/producers?locale=it"
Completed 200 OK in 21618.5ms (Views: 11532.9ms | ActiveRecord: 10083.5ms)

Started GET "/lesjardinsdecelestin/angular-templates/cookies_banner.html"
Started POST "/cart/populate"
Completed 200 OK in 120.5ms (Views: 0.3ms | ActiveRecord: 42.2ms)
Completed 200 OK in 19964.5ms (Views: 12126.2ms | ActiveRecord: 7329.9ms)

Started GET "/producers"
Completed 200 OK in 19880.5ms (Views: 10593.9ms | ActiveRecord: 9282.9ms)

Started GET "/shops"
Started GET "/shops"
Completed 200 OK in 42966.2ms (Views: 33419.0ms | ActiveRecord: 9102.5ms)
Started GET "/shops"
Completed 200 OK in 71602.1ms (Views: 62062.4ms | ActiveRecord: 8591.6ms)
Testing some of those pages:
$ curl https://www.openfoodfrance.org/shops > /dev/null
0:00:23
0:00:18

curl https://www.openfoodfrance.org/map > /dev/null
0:00:31

curl https://www.openfoodfrance.org/producers > /dev/null
0:00:33

curl https://www.openfoodfrance.org/producers?locale=it > /dev/null
0:00:28

curl https://www.openfoodfrance.org/lesjardinsdecelestin/angular-templates/cookies_banner.html > /dev/null
0:00:01
This already indicates that the long response times on the pages that load all enterprises are a problem:
- /shops
- /map
- /producers
I then logged in as super admin to check some of the requests there.
- /admin/enterprises | 20 seconds
- /admin/orders | 10 seconds
- /admin/orders/bulk_management | 18 seconds
- /admin/enterprises/test-order-cycle POST | 2 second
- /admin/reports/orders_and_fulfillment | 8 seconds
- /admin/reports/orders_and_fulfillment POST (all, one week) | timeout after 1 minute
From this I can say that most admin pages are not as bad as the shops page. But reports can reach the servers timeout and make it unavailable. The shops page and other non-admin enterprise pages could have a bigger impact though because more people are loading them. I think there are two actions here:
- Increase performance of enterprise pages. Existing issue #3099.
- Increase performance of reports, especially orders and fulfillment report. Existing issue #1539.
Should these two issues be labelled S2 because they can actually make the site unavailable?
By the way, I did all this while it was 5 am in France. The numbers are quite likely to reflect the time of single requests without other traffic.
mkllnk
on 20 Feb 2019
yes, that's it. I'd not spend more time on this one. I'd consider this a performance problem that can be addressed in the two issues you mention above.
I am not sure this issue in an s2 and, even if it is, I am not sure we should move the performance optimization issues to s2 as well. Let's discuss this in slack #bugs?
My opinion about the priority: I would move this to s3 and say that this is less important than spree upgrade so that @mkllnk and @sauloperez time goes into spree upgrade before it goes into this. we would tackle this after spree upgrade.
 luisramos0
on 20 Feb 2019
luisramos0
on 20 Feb 2019
100% agree with @luisramos0.
@RachL over to you for your thoughts on the above, make the changes if you concur :)
 daniellemoorhead
on 20 Feb 2019
daniellemoorhead
on 20 Feb 2019
@daniellemoorhead @luisramos0 ok to downgrade as an s3: complains have been very localized so far.
I just hope that we will not reach a point were this becomes a blocker 🤞
RachL
on 21 Feb 2019
Okay, I'll turn this issue into an epic with the two suggested issues in it.
mkllnk
on 22 Feb 2019
Nothing new, however. We know one of the main reasons of the bad performance of the frontoffice (if not the top one) is loading all the enterprises in DB (aka. lack of pagination).
sauloperez
on 22 Feb 2019
do you mean "loading all the enterprises in DB (aka. lack of cache)."? ❤️
luisramos0
on 22 Feb 2019
or do you mean "loading all the enterprises in DB (aka. lack of a stand alone DB server that can take the query easily)."?
luisramos0
on 22 Feb 2019
give it the name you want but there's no way loading all records of a database table will ever be performant and scalable :trollface:
sauloperez
on 25 Feb 2019
I'm really nervous about this. Today an issue with the same symptoms took OFN UK completely down for all shops and pages, not just pages that load everything.
I am nervous keeping performance at s3 because this is very close to approaching s1 status in the UK...
 lin-d-hop
on 25 Feb 2019
lin-d-hop
on 25 Feb 2019
yes, I see that @lin-d-hop but is that not just a simple indicator that the UK servers are below the capacity needed to run the current solution (the data volumes are naturally always increasing) and the incident you report is just a very good excuse to get better servers in place?
luisramos0
on 25 Feb 2019
We have 8gig mem and there were 6 users online at the time.... I don't agree with you @luisramos0
lin-d-hop
on 25 Feb 2019
@lin-d-hop for France as well, if a request take too much time, it's the whole app that becomes unavailable (as you can see in my issue description, I was just changing a configuration when I've noticed the website was down. A few minutes afterwards I could do my change in a snap).
That being said, it would be difficult to deal with this before finishing the spree upgrade. Don't you think?
RachL
on 25 Feb 2019
I absolutely agree. Though if the servers keep going down then there is no point finishing the Spree Upgrade for us as OFN will be unusable....
I'll continue with the 'restart the servers' approach but I would feel much more comfortable if we had a cut off for when this becomes an S2+ at least. Like if servers go down to the point that our monitoring picks it up total system fail more X times per week or once a day?
Monitored sysfail >1 per day is surely an S1?
lin-d-hop
on 25 Feb 2019
@lin-d-hop why do you think that single metric 8gbs is enough to conclude it should be enough capacity?
I think we have to be realistic and see what is the _actual_ capacity needed, not the capacity we think should be enough. Specially, if it is a S1, first you want to get your system with enough capacity to run, then you can fix it to run with less capacity.
I am saying this also because building enterprises pagination will not fix all our performance issues for sure... (have you seen the backoffice BOM data loading strategy?)
luisramos0
on 25 Feb 2019
@lin-d-hop yes I completely agree as an instance point of vue. But I guess from a refactoring point of view, if we see a major failure / s1 we will need to discuss a strategy so it doesn't postpone the upgrade to forever.
FYI we've plugged our happy apps to send notifications in the devops-notifications slack channel. It could be great to have UK's notifications there as well?
Oh and for my general knowledge :) : are there cases when our monitoring system does not see the down time? Thx
RachL
on 25 Feb 2019
Alright. UK doubled the server size last time we ran into performance issues and we still haven't gotten to them.
Maybe we'll fix them before we get to 12 simultaneous users and need 32gig mem and 8 cpus.
lin-d-hop
on 25 Feb 2019
Yes, that's every day life in capacity planning of a normal growing business. You double the capacity and it lasts you some time until it is again not enough.
Metal is cheap at this scale compared to dev time. From 8gbs/2 cpus to 32gbs/8 cpus (you pay something like 10usd/month per one cpu with 2gbs) it will cost you 60usd/month which means 720usd per year. It's nothing compared to the thousands you end up paying for dev time.
luisramos0
on 25 Feb 2019
That's not what we pay :-/ But yes, doubling the server is cheaper than dev time.
lin-d-hop
on 25 Feb 2019
Totally agree with you @luisramos0 if you can buy more time by buying cheap servers, why not? but what do you do if throwing more money into the problem doesn't fix it? That is exactly the situation we have now IMO. I talk a lot about pagination as a concrete example, but it's not only that, of course.
UK's Datadog graphs clearly show we have some CPU spikes but other than that resources seem rather underutilized. As an example, we use Postgres' default configuration which doesn't make use of those Gb of RAM we have available.
So, IMO we will need to spend time making better use of them soon when we start working on the priorities. No need to get crazy, and yes, machines are cheaper than devs.
sauloperez
on 25 Feb 2019
@luisramos0 @sauloperez If we increase from 4 to 6 cpus do we need to change deploy scripts so that unicorn makes use of 4 cpus instead of 2? If so I'll open an ofn-install issue when we increase our servers.
lin-d-hop
on 25 Feb 2019
@sauloperez great tip about postgres default configs. I just had a brief read and it looks like we could potentially gain some big benefits with a bit of tuning there.
 Matt-Yorkley
on 25 Feb 2019
Matt-Yorkley
on 25 Feb 2019
yeah, we agree @sauloperez and the hint on tuning current setup is very good!
@lin-d-hop I dont know the details but adapting the number of unicorn workers to the number of available cpus is probably useful.
@sauloperez I have been there many times, throwing metal at these problems does fix them in a blink of an eye. And yes, sometimes, but a lot less frequently, it's a bug that will just eat all the cpu you give it.
luisramos0
on 25 Feb 2019
I would like to throw in another perspective or issue. When some pages timed out we increased our server timeout. That enabled us to load pages that were not working otherwise. Now we are experiencing the downside of that approach. The timeouts are there to protect the server from becoming unavailable.
If we said that every page has to load within 30 seconds (default timeout) then some pages would stop working. And if a page doesn't work, it's a bug. Even with the current long timeouts of one or two minutes we are experiencing pages that don't work. "Within 30 seconds" is a feature but "doesn't load" is a bug.
And another side note:
The Australian server is on a host with 2 x hex-core E5-2640 Intel Xeon CPUs. We can't upgrade to more than that. We used to be able to scale with Amazon EC2 but that was really expensive. Of course, we could change providers but that takes a lot of hours as well. We also chose our provider because they are a nice small company with excellent support and relatively close by with some shared values. We don't want a US server with a slow connection to Aus.
mkllnk
on 26 Feb 2019
Here is some data:
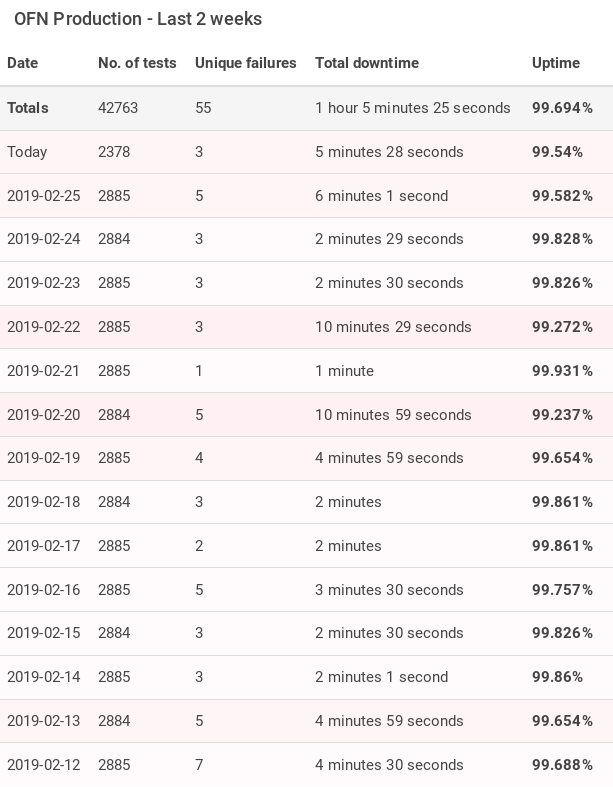
mkllnk
on 26 Feb 2019
I would argue that this issue is too vague and that we are now addressing this more specifically in other issues. Closing.
lin-d-hop
on 6 Aug 2019
Related issues
sauloperez
·
3Comments
lin-d-hop
·
3Comments
 HugsDaniel
·
3Comments
Matt-Yorkley
·
3Comments
HugsDaniel
·
3Comments
Matt-Yorkley
·
3Comments
 andrewpbrett
·
3Comments
andrewpbrett
·
3Comments