Ohara: Ohara 0.9.0 product testing report
測試項目
1. 基本測試
- [ ] 確認畫面(UI)與設計稿(Design)是否一致
- 顏色、字型、符號、圖片、...
- [ ] 檢查所有畫面的 Title 名稱是否正確
- [ ] 所有連結是否有前往正確頁面
- [ ] 切換視窗大小時,有無跑版情形
- [ ] 切換視窗大小後,文字與圖形是否竄行
- 表單
- [ ] 任何一個必填欄位未填寫,不能送出
- [ ] 表單送出中,應該明確表達正在處理中的訊號
- [ ] 表單送出中,應該要凍結表單(除非有提供取消功能)
- [ ] 任何表單至少要有 CTA 及 Cancel 兩類按紐 (CTA: Call-To-Action)
- 訊息
- [ ] 成功訊息,應該要明確指出完成對象
- [ ] 錯誤訊息,應該要明確指出錯誤對象
- [ ] 確認訊息
- [ ] 刪除確認,應該要明確指出欲刪除對象
- 按鈕
- [ ] 任何一個刪除按鈕,都要有刪除確認提示
- 鼠標
- [ ] 移動到所有可以點擊的元素,要出現 pointer cursor
- Button, Link icon, Link text, ...
- Button, Link icon, Link text, ...
- [ ] 移動到所有可以點擊的元素,要出現 pointer cursor
2. 功能測試: JDBC -> Stream -> HDFS
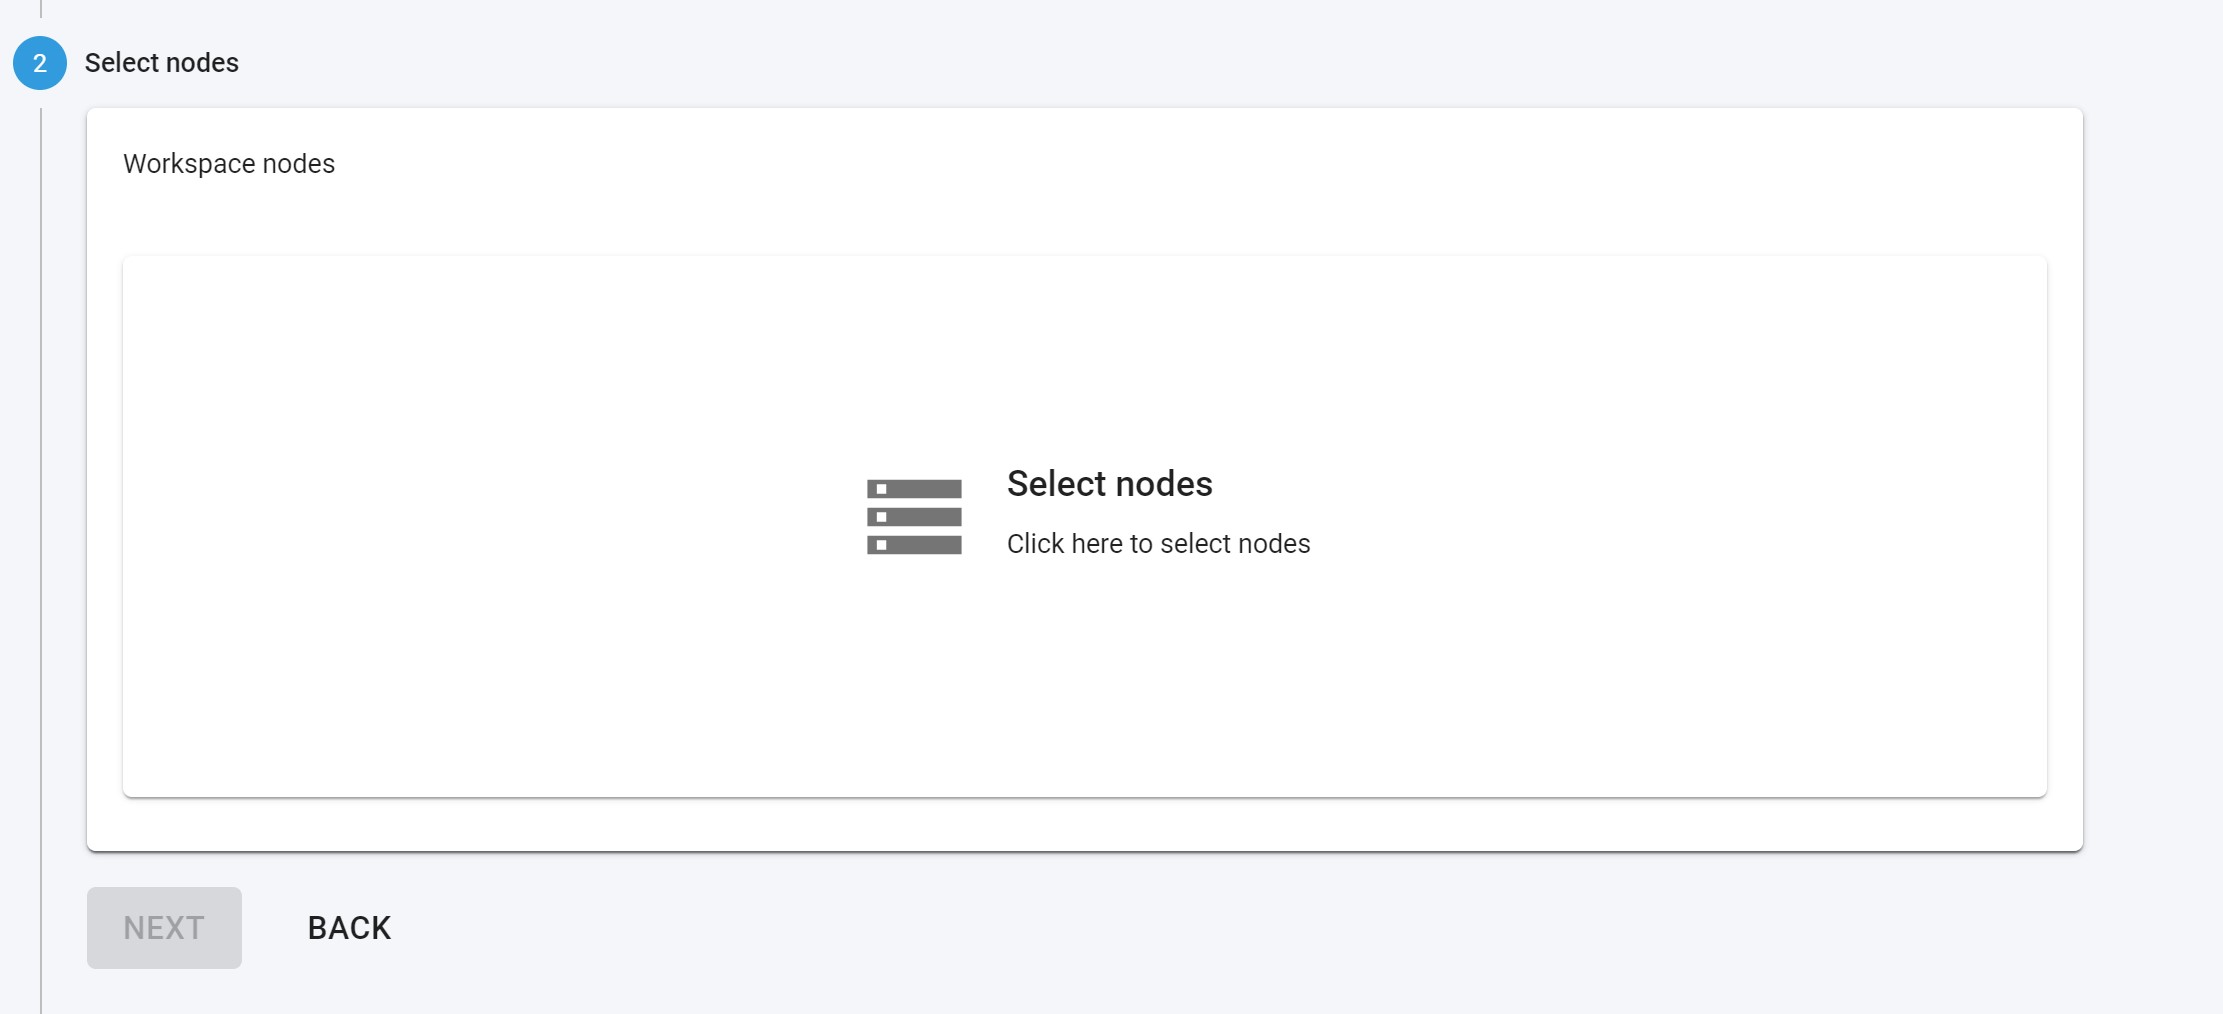
- [x] Create a new workspace with three nodes
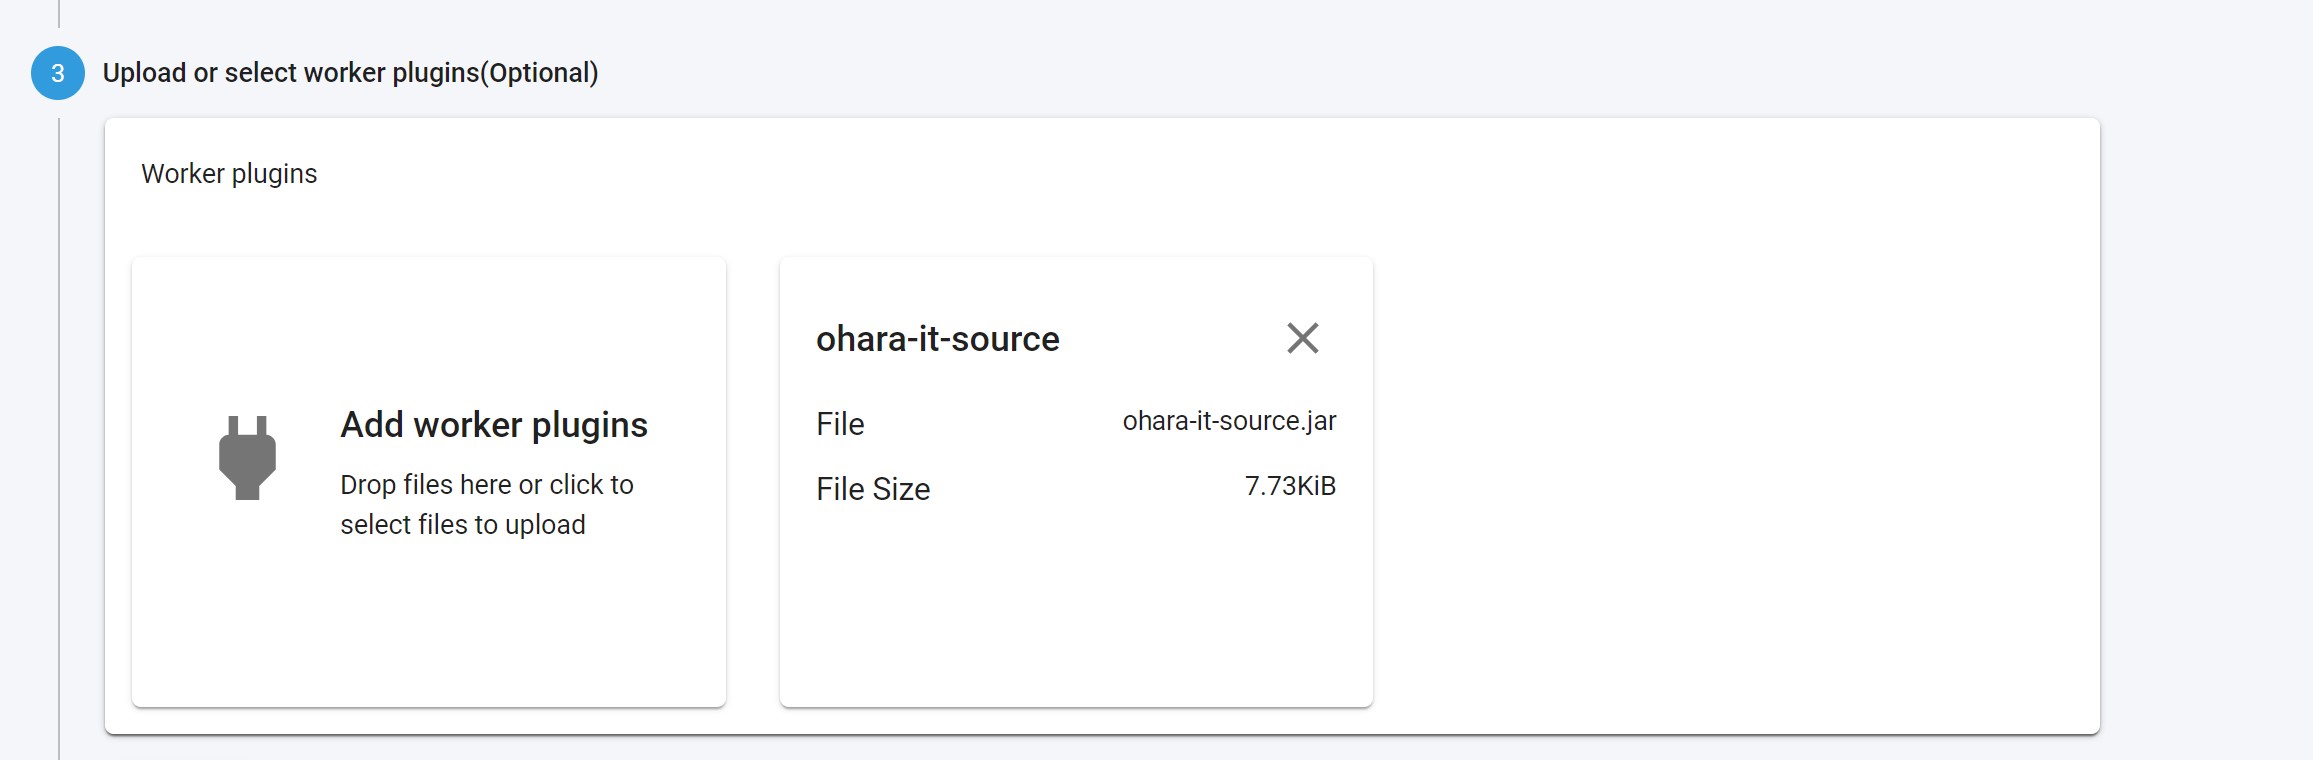
- [ ] Create two topic and upload a stream app jar into the workspace
- [x] Create a new pipeline and add some components into pipeline
- [x] 連接 JDBC Source -> Topic 1 -> Stream App -> Topic 2 -> HDFS Sink
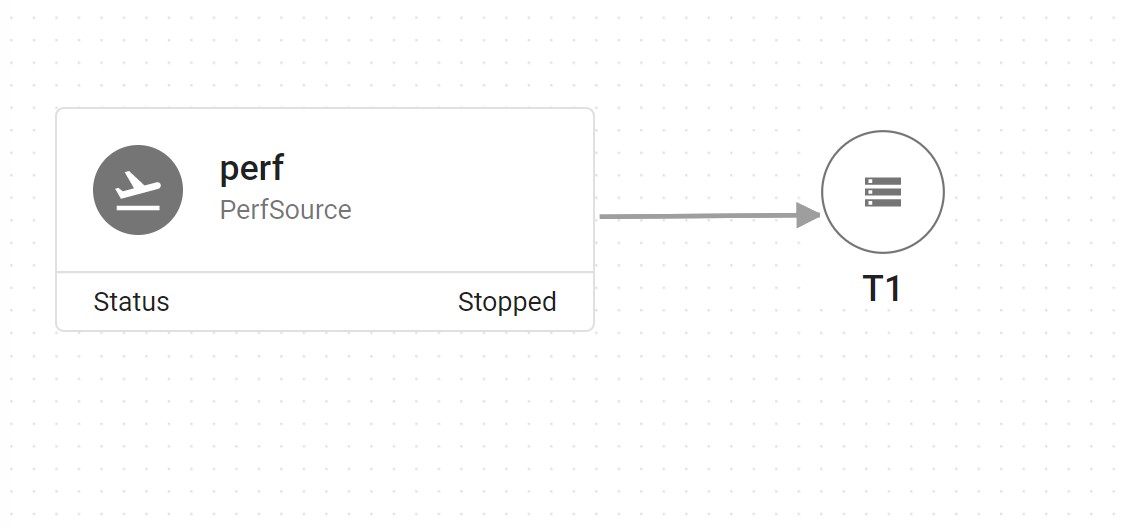
- [x] 連接 Perf Source -> Topic
- [x] Prepare required folders and test data on the JDBC server
- [x] Start all connectors and stream app
- [x] Verify which test data was successfully dumped to HDFS
3. 安裝測試:Install case
- [x] Confirm your use the hardware specification
- [x] Confirm your use version
- [x] Install the Kubernetes
- [x] Running the Ohara Configuration service
- [x] Running the Ohara Manager service
測試所發現的問題紀錄
設計稿:
測試環境:
- Ohara
- Mode: k8s
- Version: 0.9.0-SNAPSHOT
- Build date: 2019-08-17 17:09:26
- 測試工具
- 瀏覽器:Chrome 76.0.3809.100
- 最小螢幕寬度:1200
基本測試:
- [Manager] Cannot display the connectors, streams in plugin card (#3747)
- [Manager] Set metrics display setting to off when a user agent visit our App for the first time (#3732)
- Early avoid duplicated workspace name when creating a new one (#3746)
- [Manager] Add default workspace name in quick mode (#3752)
- [Manager] Remove the link from UI's Ohara logo (#3777)
- [Manager] Add a hint on the "into the worksapce" button (#3786)
- [Manager] Remove the settings button from topic cells (#3780)
功能測試:
- BasicTestPerformance4Ftp#removeFtpFolder 不能移除空資料夾 (#3707)
- [Manager] Unable to get the correct group when changing workspace (#3705)
- [Manager] Delete a pipeline shouldn't delete the public topics used in it (#3733)
- Before start the connector, await worker http server completed for performance test (#3665)
- Change the permission of connector.class from EDITABLE to CREATE_ONLY (#3745)
- Configurator log should be able to fetch even if no workspace (#3768)
- [Manager] Prevent users from adding more topic into the paper while a new topic is adding (#3766)
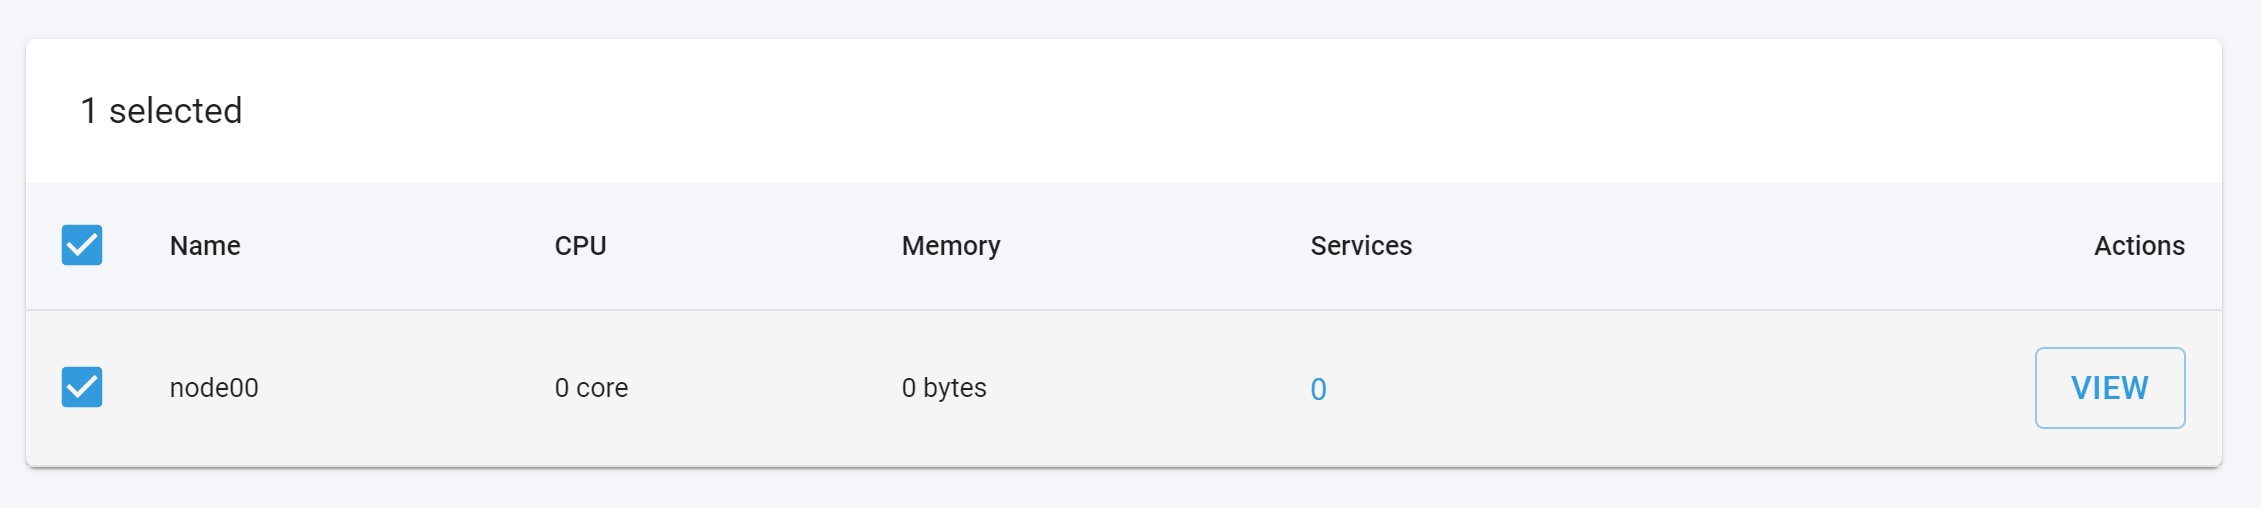
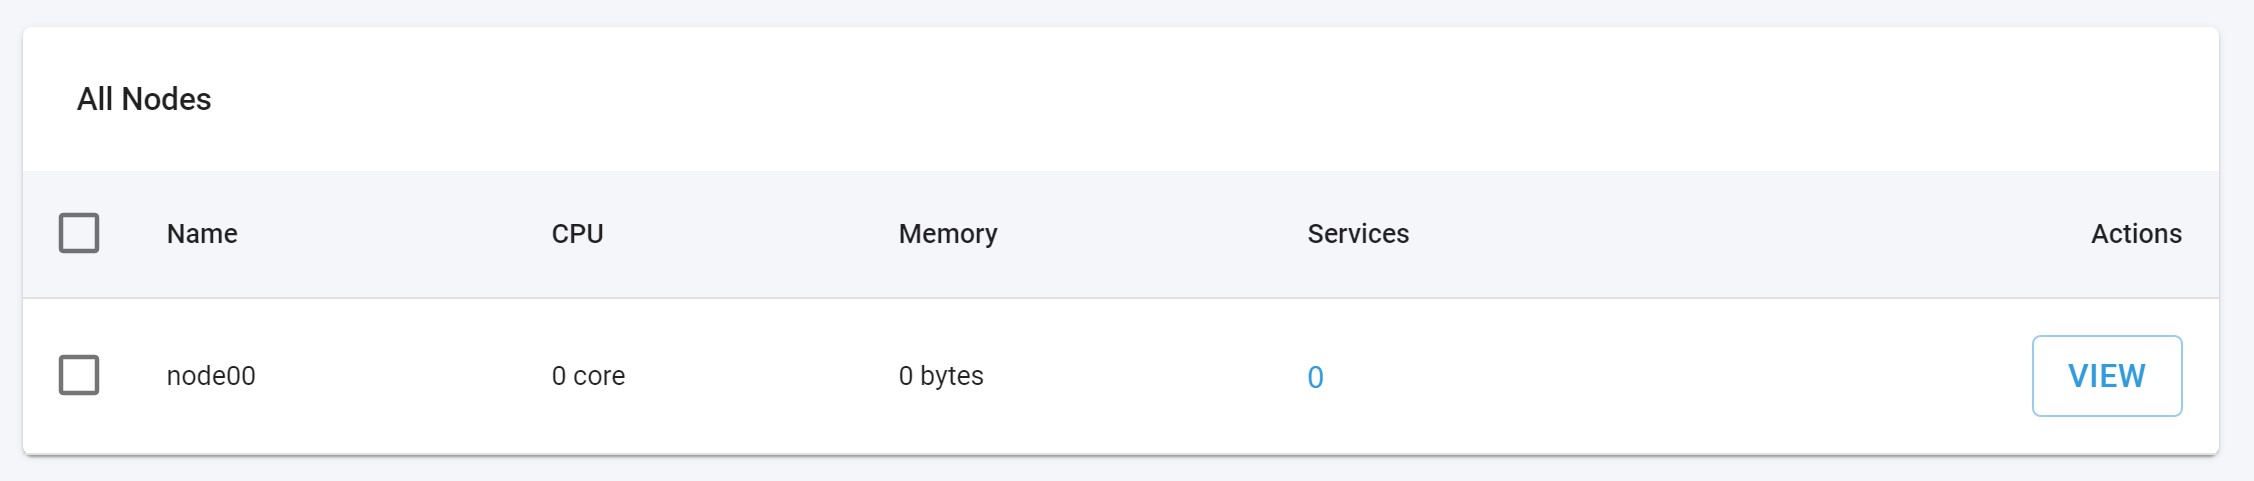
- the run-time information of creating node is incorrect - it is always unavailable and resources are empty (#3785)
- Hostname should not be editable in docker mode (#3784)
- [Manager] Stream names are not showing up in Toolbox after uploaded (#3754)
 saivirtue
All 137 comments
@oharastream/developer
If you have found any issue or problems about version 0.9, please add the issue number here.
saivirtue
on 7 Jan 2020
- [x] Graph updates automatically when connector updates #3693
 wu87988622
on 7 Jan 2020
wu87988622
on 7 Jan 2020
- [x] BasicTestPerformance4Ftp#removeFtpFolder 不能移除空資料夾 #3707
- [x] Before start the connector, await worker http server completed for performance test #3665
 jackyoh
on 7 Jan 2020
jackyoh
on 7 Jan 2020
- [x] [Manager] Unable to get correct group when changing workspace (#3705) @eechih
 eechih
on 7 Jan 2020
eechih
on 7 Jan 2020
- [x] [Manager] Delete a pipeline shouldn't delete the public topics used in it (#3733)
 konekoya
on 7 Jan 2020
konekoya
on 7 Jan 2020
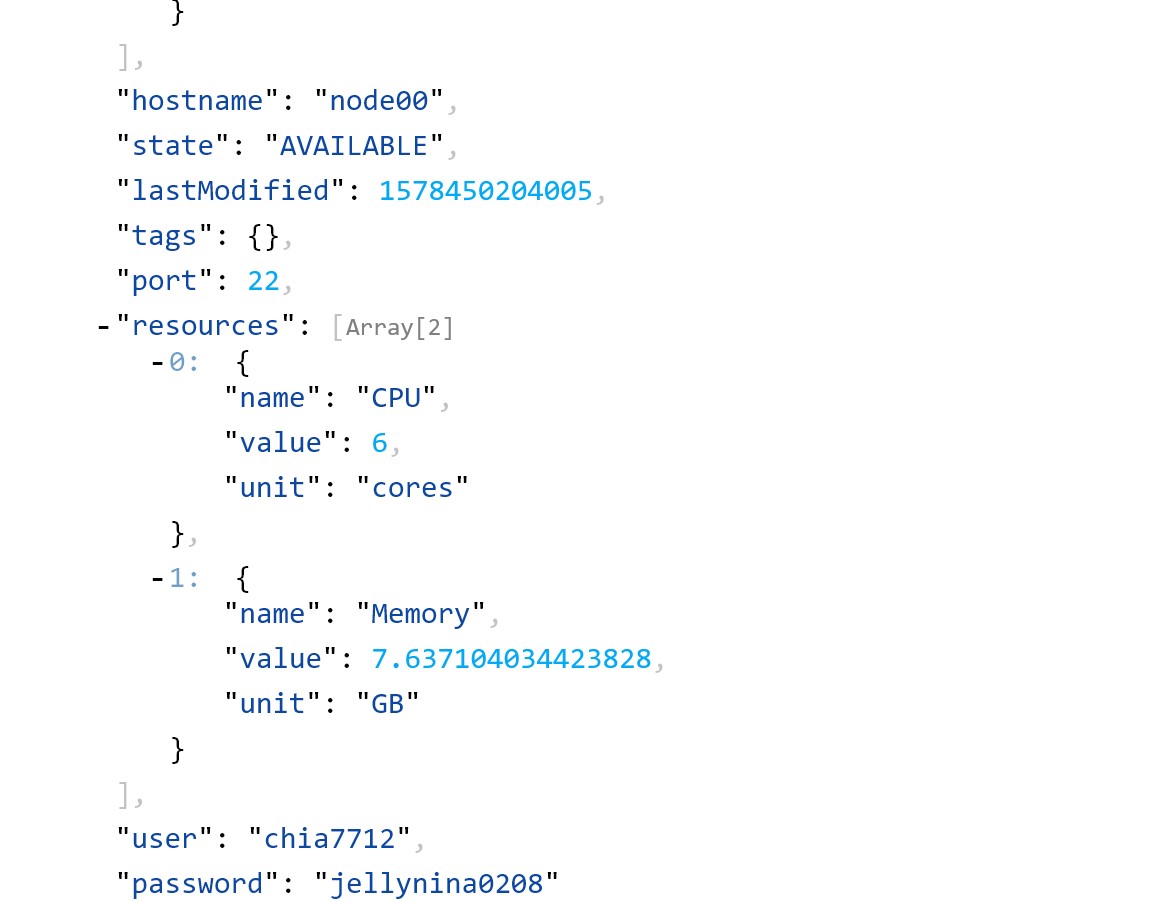
@oharastream/frontend 我在docker(ssh) mode裡面加入節點後沒看到資源顯示,但我透過APIs去敲是可以看到的
 chia7712
on 8 Jan 2020
chia7712
on 8 Jan 2020
~加入節點後,回到建立workspace的頁面卻沒有任何節點顯示~
更正:
是我誤會的UI操作邏輯 :( 沒事沒事
chia7712
on 8 Jan 2020
加入plugins後沒有顯示內容(例如有哪些connectors, streams)
chia7712
on 8 Jan 2020
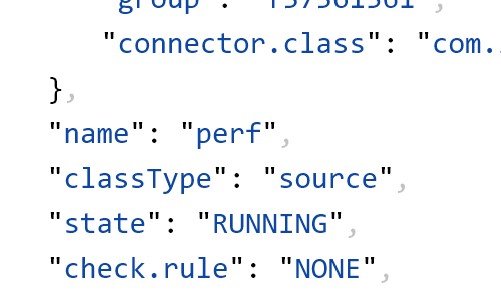
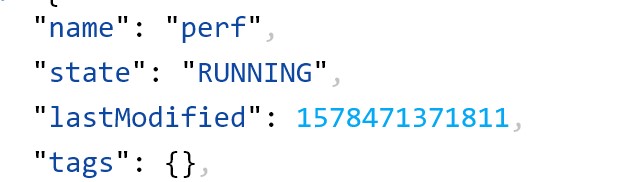
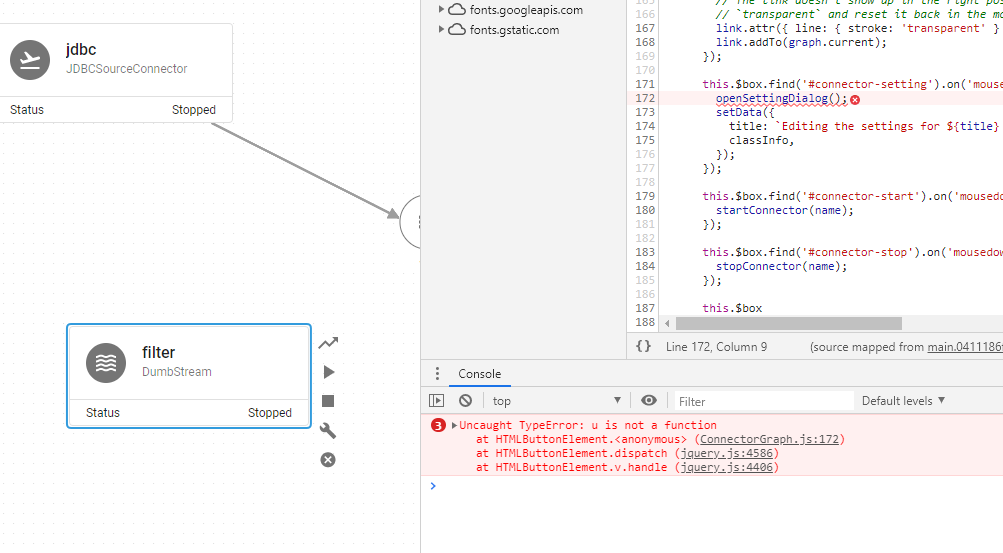
connector的線已經連結到一個topic,但在connector的設定裡面卻依然沒有顯示已經選擇的topic
chia7712
on 8 Jan 2020
connector的線已經連結到一個topic,但在connector的設定裡面卻依然沒有顯示已經選擇的topic
It seems duplicated to #3693? /cc @wu87988622
saivirtue
on 8 Jan 2020
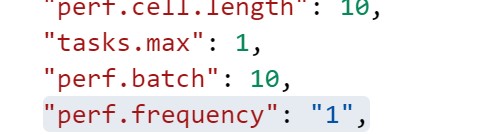
duration型態的預設值不見了
chia7712
on 8 Jan 2020
- [x] Change the permission of connector.class from EDITABLE to CREATE_ONLY (#3745)
chia7712
on 8 Jan 2020
- [x] Early avoid duplicated workspace name when creating a new one #3746
saivirtue
on 8 Jan 2020
加入plugins後沒有顯示內容(例如有哪些connectors, streams)
- [x] [Manager] Cannot display the connectors, streams in plugin card (#3747 )
eechih
on 8 Jan 2020
- [x] [Manager] Stream names are not showing up in Toolbox after uploaded (#3754)
konekoya
on 8 Jan 2020
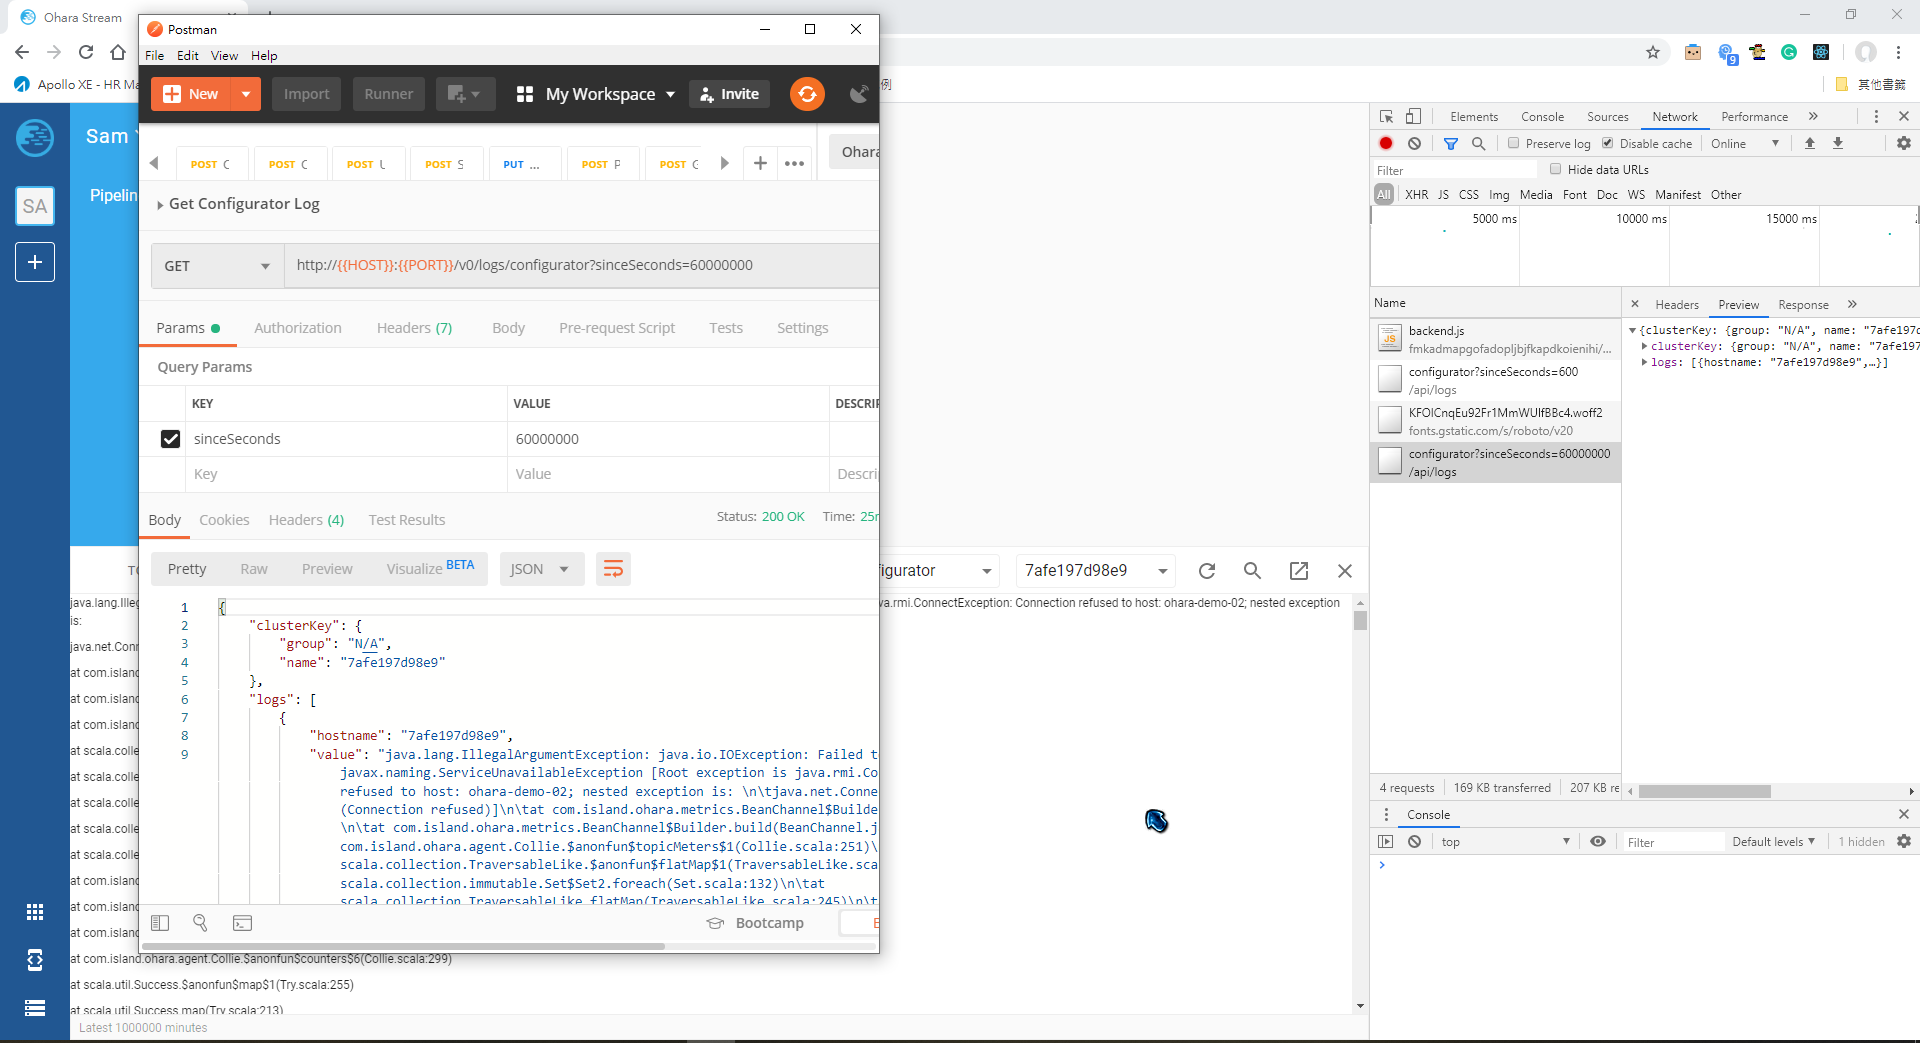
fail to observe configurator log from UI (but API works well)
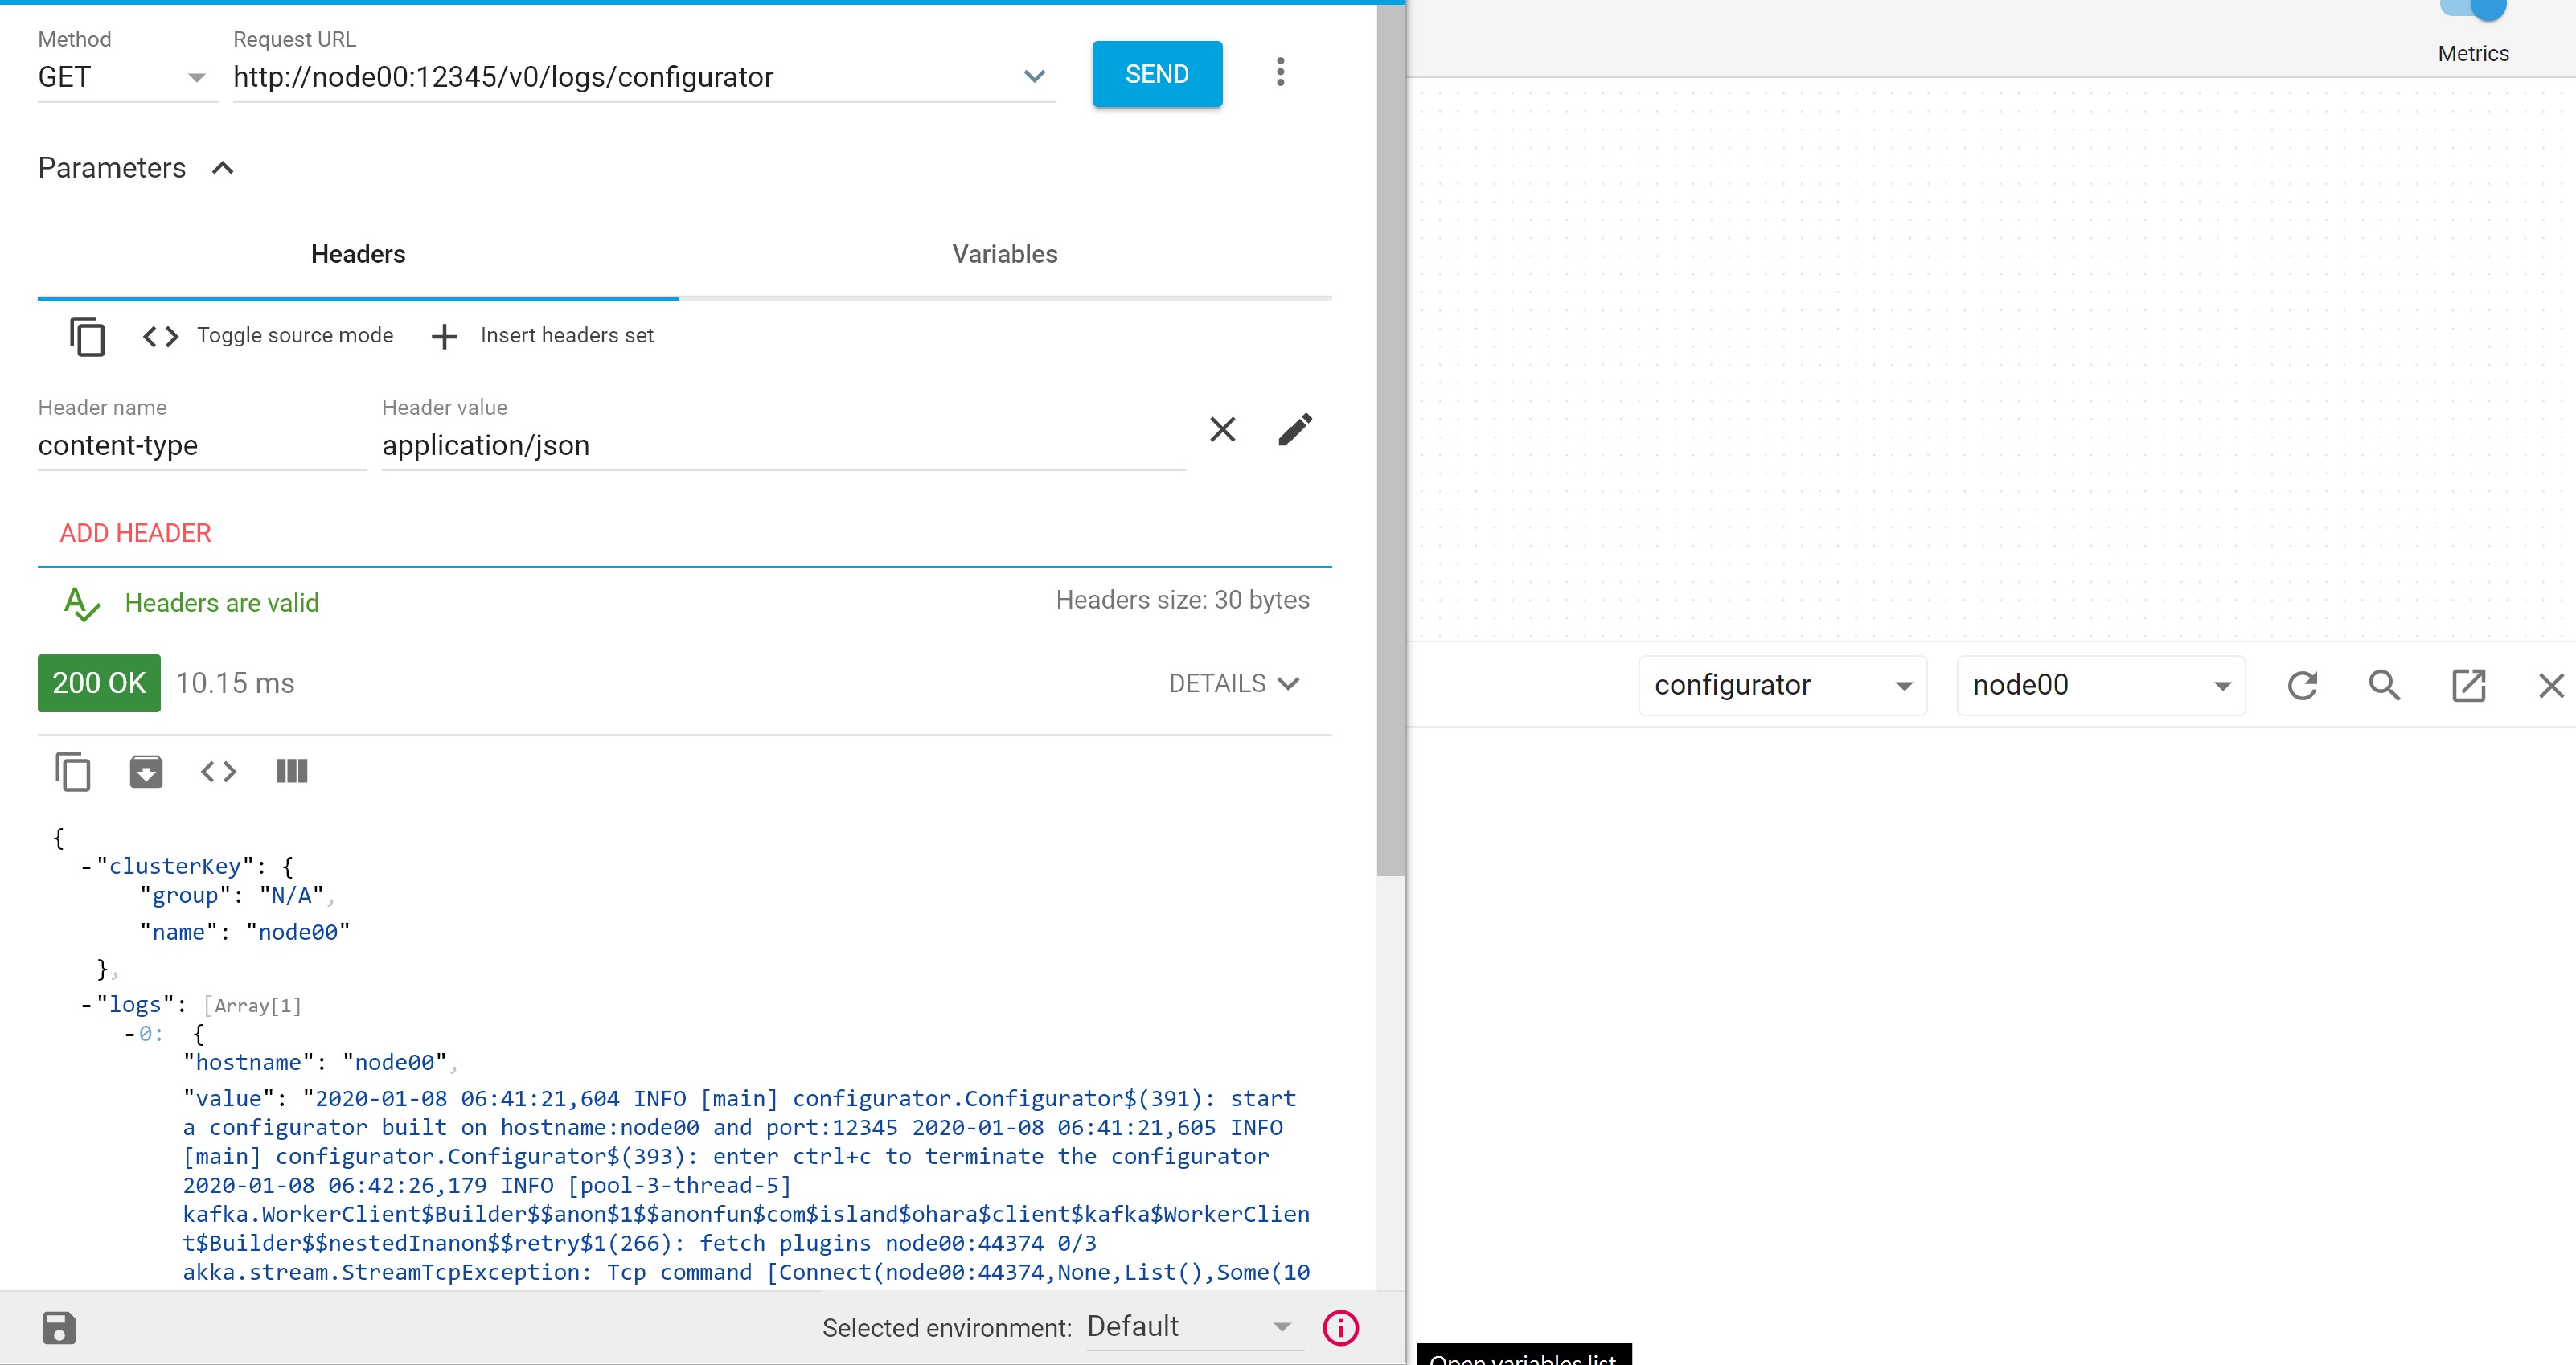
乍看之下很像是UI嘗試從"已經加入的節點"找configurator log(?),可是configurator可能根本不在已經加入的節點列表裡面。或許UI應該直接打${configurator_url}/logs/configurator就好,而不用去在意原本的nodes列表
chia7712
on 8 Jan 2020
fail to observe configurator log from UI (but API works well)
乍看之下很像是UI嘗試從"已經加入的節點"找configurator log(?),可是configurator可能根本不在已經加入的節點列表裡面。或許UI應該直接打${configurator_url}/logs/configurator就好,而不用去在意原本的nodes列表
I tested the same behavior in our Demo env with 0.9, and it works well:
saivirtue
on 8 Jan 2020
@saivirtue 你嘗試看看讓configurator不是位於nodes列表 (如我上面的敘述)
例如node00跑configurator,然後只把node01加入configurator,並把其他服務啟動在node01
chia7712
on 8 Jan 2020
@saivirtue 你嘗試看看讓configurator不是位於nodes列表 (如我上面的敘述)
例如node00跑configurator,然後只把node01加入configurator,並把其他服務啟動在node01
It seems like something wrong in docker mode
I will update the test result later...
saivirtue
on 8 Jan 2020
@saivirtue 你嘗試看看讓configurator不是位於nodes列表 (如我上面的敘述)
例如node00跑configurator,然後只把node01加入configurator,並把其他服務啟動在node01
The reason UI displays "nothing" is because of API return "empty log".
The default sinceSeconds in UI is using 600, but your native API is using empty (which means all data)
BTW, we use the node name from logs.hostname of API response, node list doesn't participate in it :)
saivirtue
on 8 Jan 2020
Configurator log should be able to fetch even if no workspace
- [x] Configurator log should be able to fetch even if no workspace (#3768)
saivirtue
on 8 Jan 2020
The default sinceSeconds in UI is using 600, but your native API is using empty (which means all data)
看起來應該是APIs的錯誤 (see https://github.com/oharastream/ohara/issues/3770)
chia7712
on 8 Jan 2020
Configurator log should be able to fetch even if no workspace
這個我剛剛也有遇到,一定要先建立才可以看logs :(
chia7712
on 8 Jan 2020
topic (pipeline only)的設定按鈕按了沒有反應 (當時沒有任何運作中的connectors, streams)
chia7712
on 8 Jan 2020
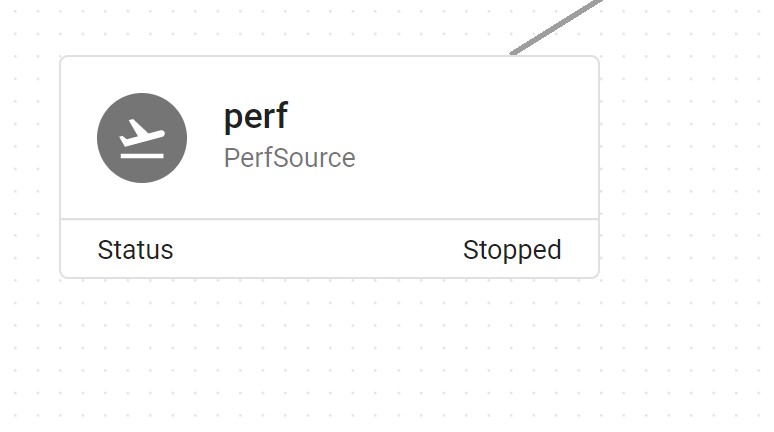
pipeline上的connector已經啟動了(connector and pipeline APIs都顯示running),但是畫面依然顯示stopped
ps. 已經重複刷新頁面,依然是stopped
chia7712
on 8 Jan 2020
- [x] [Manager] Remove the link from UI's Ohara logo (#3777)
konekoya
on 8 Jan 2020
首頁的文字typo:
Ohara is a scalable streaming platform that allows users to easily organized their input, output, and streaming applications with a clean and comprehensive GUI
chia7712
on 8 Jan 2020
"into the worksapce" 無法點擊
chia7712
on 8 Jan 2020
duration型態的資料存放有誤,應該是"1 seconds"而不是"1"

chia7712
on 8 Jan 2020
首頁的文字typo:
Not that good at grammar, but I believe verbs after the "to" should be "Organize" not "Organized" :)
konekoya
on 8 Jan 2020
"into the worksapce" 無法點擊
It's intended. Because it's the current workspace
konekoya
on 8 Jan 2020
topic (pipeline only)的設定按鈕按了沒有反應 (當時沒有任何運作中的connectors, streams)
Hmm, the config button should be removed from topics
konekoya
on 8 Jan 2020
- [x] [Manager] Remove the settings button from topic cells (#3780)
konekoya
on 8 Jan 2020
- [ ] [Manager] Remove the settings button from topic cells (#3780)
konekoya
on 8 Jan 2020
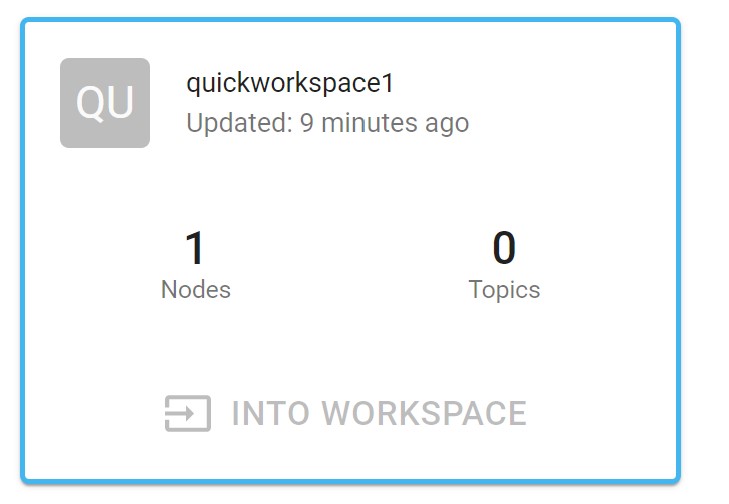
If there is one workspace only, the "into the workspace" means current workspace (which should be disabled here).
Maybe we can provide a tooltip as a hint like: "This is the workspace that you're at now"?
konekoya
on 9 Jan 2020
If there is one workspace only, the "into the workspace" means current workspace (which should be disabled here).
Maybe we can provide a tooltip as a hint like: "This is the workspace that you're at now"?
+1
saivirtue
on 9 Jan 2020
Maybe we can provide a tooltip as a hint like: "This is the workspace that you're at now"?
/cc @eechih @wu87988622 for feedback on this?
konekoya
on 9 Jan 2020
node 編輯頁面不應該可以修改hostname (會產生新的node)
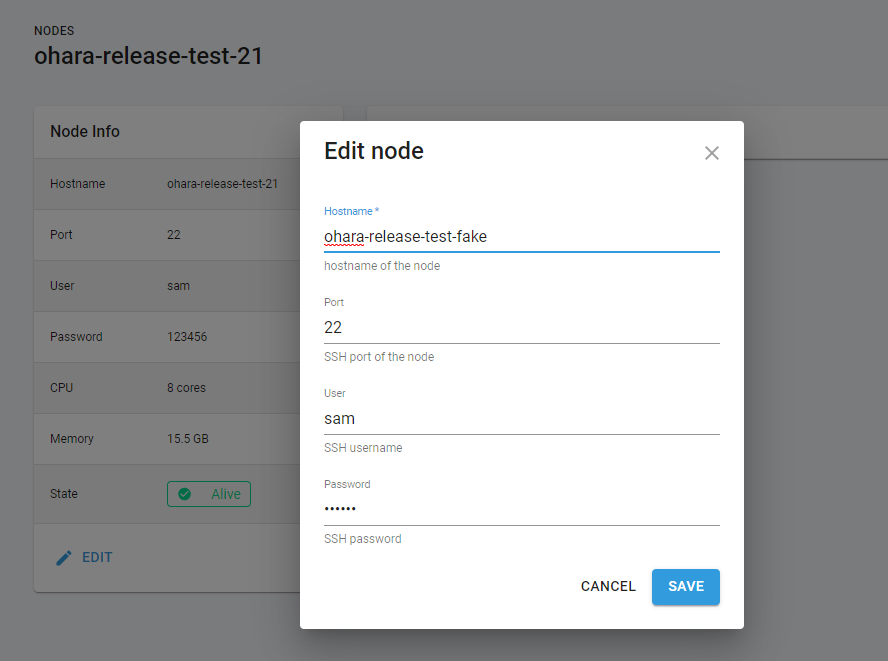
- [x] Hostname should not be editable in docker mode (#3784)
saivirtue
on 9 Jan 2020
Maybe we can provide a tooltip as a hint like: "This is the workspace that you're at now"?
+1
- [x] [Manager] Add a hint on the "into the worksapce" button (#3786)
eechih
on 9 Jan 2020
我在docker(ssh) mode裡面加入節點後沒看到資源顯示,但我透過APIs去敲是可以看到的
這是APIs的問題 (#3785)
chia7712
on 9 Jan 2020
- [x] [Manager] Handle same name connector error #3797
konekoya
on 9 Jan 2020
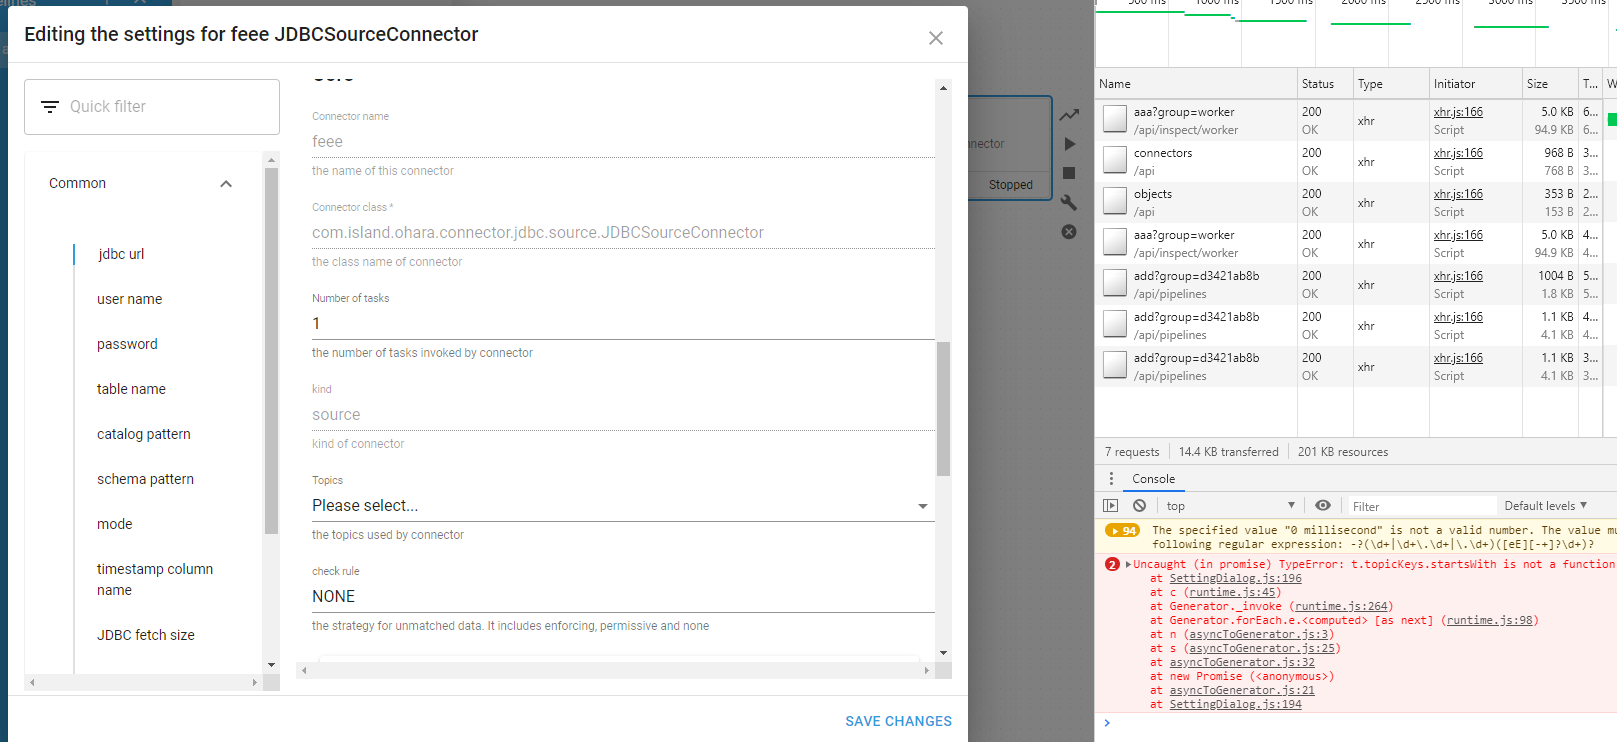
- [x] [Manager] Could not save settings of connector if absent topic field #3802
saivirtue
on 9 Jan 2020
- [x] [Manager] Could not edit stream settings (#3803)
saivirtue
on 9 Jan 2020
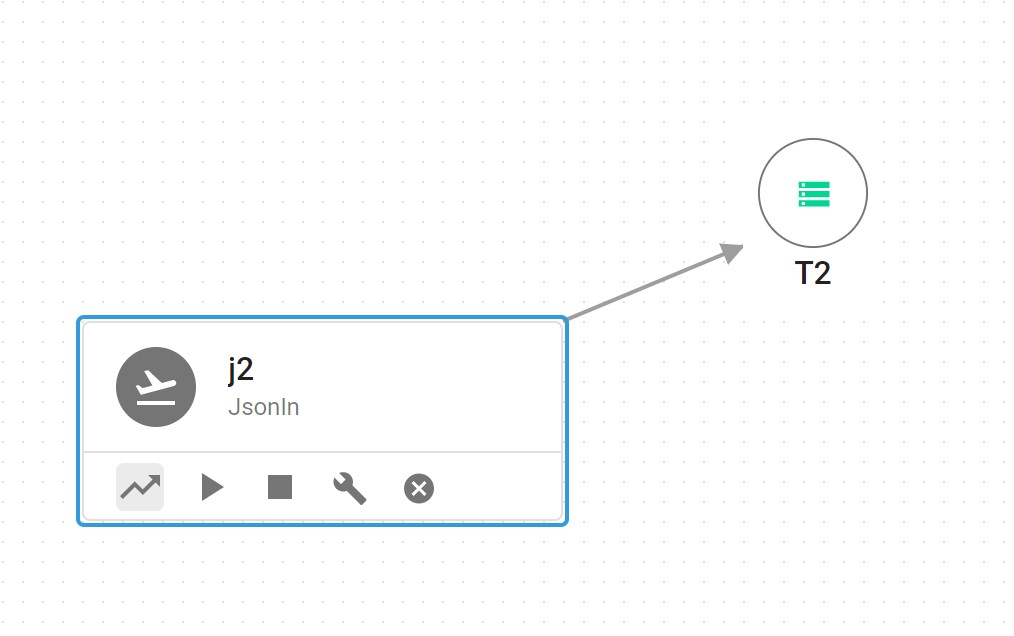
從pipeline-only topic無法拉線連接到JsonOut
Updated: Cannot be reproduced
chia7712
on 20 Feb 2020
Type.Duration的預設值沒有顯示 (#4098)
chia7712
on 20 Feb 2020
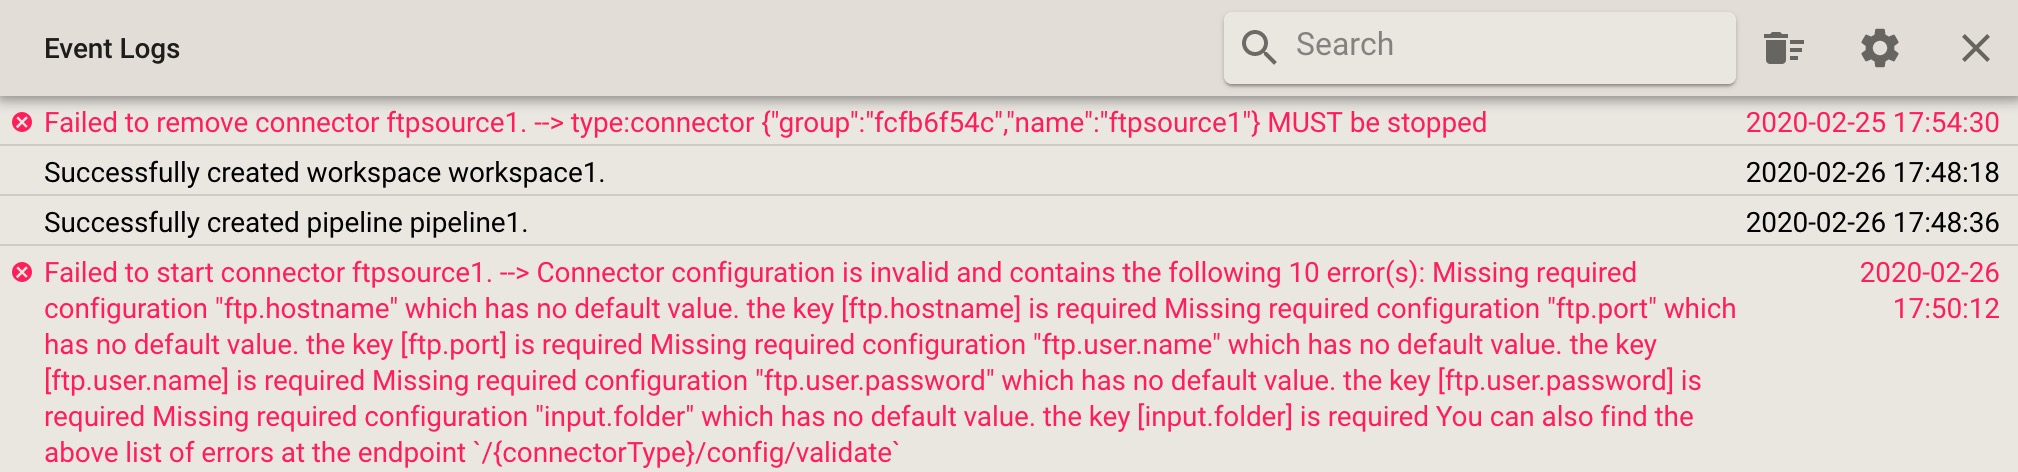
Quickstart VM --> Nodes --> ADD NODE --> 填入正確資料 --> ADD
- Dialog 直接關閉, 畫面沒有任何改變.
- 過了數秒後, 左下方會出現: Failed to create node xxx.xxx.xxx.xxx
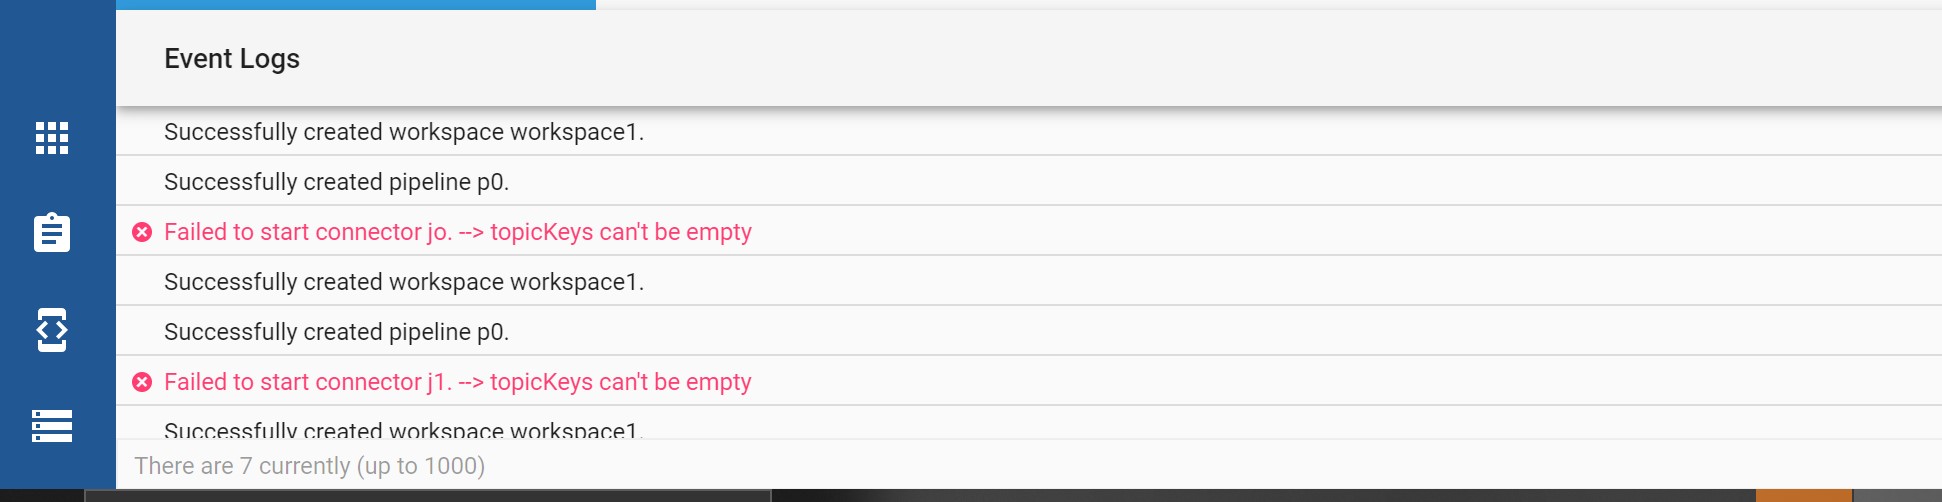
- Event log 資訊顯示如下:
Update:
- Memory 8G --> 12G 這個情形就消失了.
 vitojeng
on 21 Feb 2020
vitojeng
on 21 Feb 2020
QuickstartVM(Mem 12GB), 操作步驟:
- Add node, Create workspace 成功
- 建立 pipeline, 建立 ftp source connector, ftp sink connector, 建立 source/sink 連線
- 在 ftp source connector 填入 settings, 然後按下 Start
- ftp source connector 顯示橘燈(Pending), 然後一直在橘燈狀態
- 實際上 API 拋出錯誤
- Even log 沒有訊息
issue #4099
vitojeng
on 21 Feb 2020
Display name is not capitalized
*first

Issue: #4151
konekoya
on 24 Feb 2020
We should confirm before deleting
Thanks for reporting @eechih! The issue is tracked in #4152
eechih
on 24 Feb 2020
Error "Failed to inspect topic XX Info" when open new window(#4109)
vitojeng
on 24 Feb 2020
重開所有服務後,event logs裡面依舊有前世的記憶
chia7712
on 24 Feb 2020
錯誤訊息不正確
Update: required by #4124
chia7712
on 24 Feb 2020
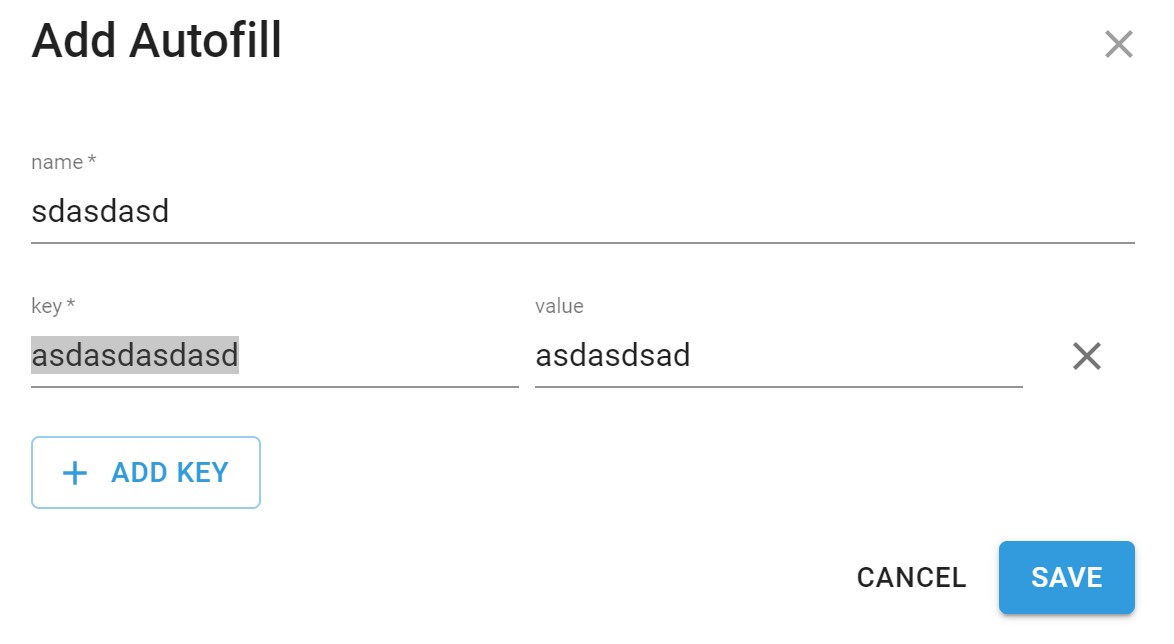
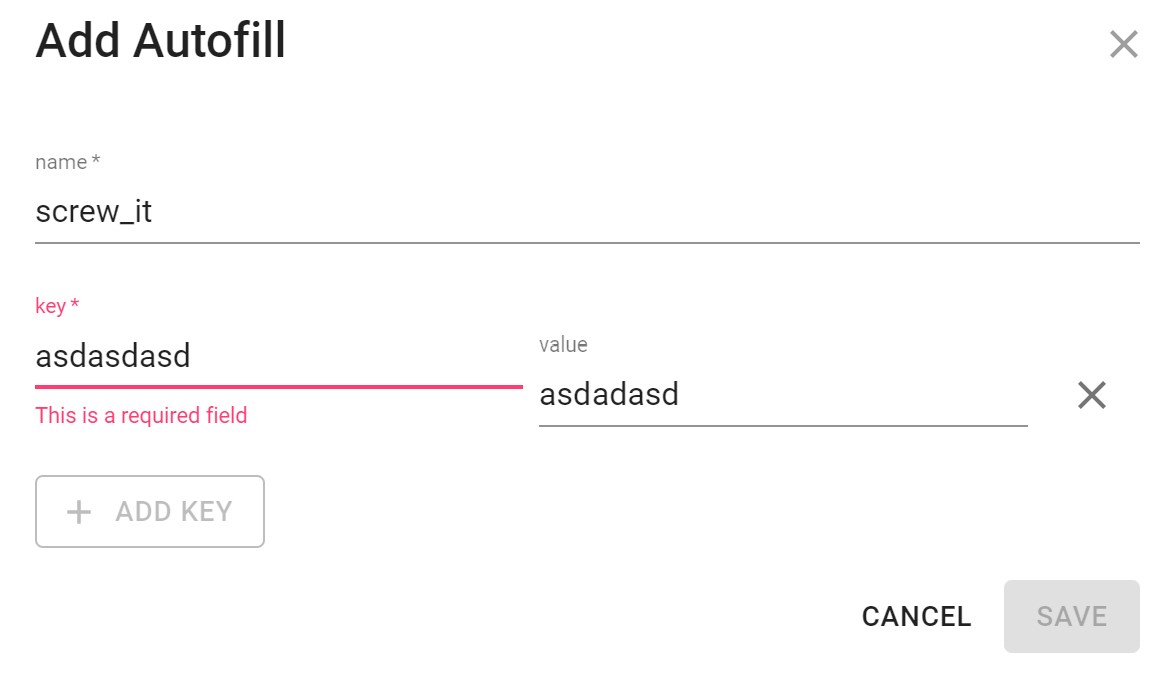
不存在的key但允許儲存,儲存完後再開會變成另外一個key
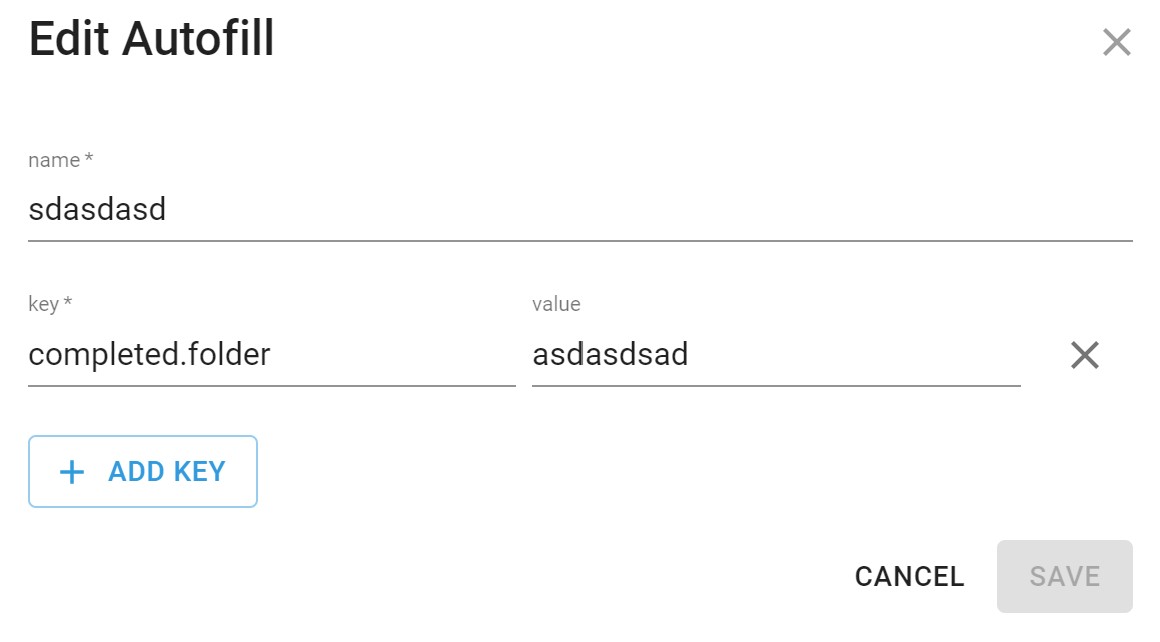
重現方式:
- 先選任意一個可用的key
- 手動更動該key
- 點選儲存
Update: required by #4124
chia7712
on 24 Feb 2020
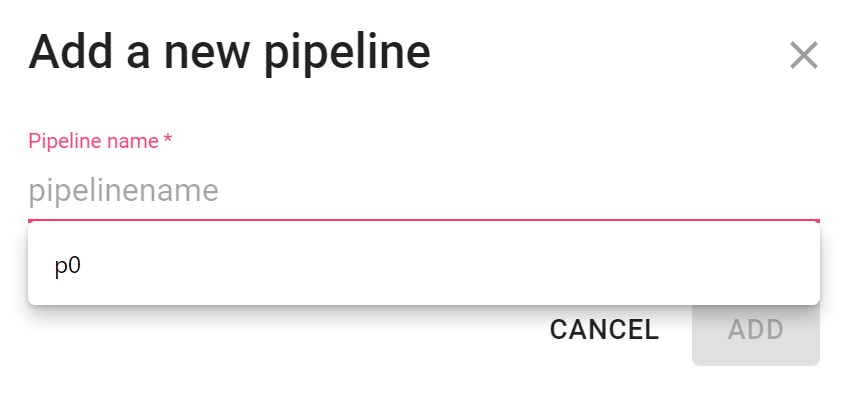
pipelinename應該換成拼法正確的字,或者加上編號的單字 (如pipeline0)
Thanks for raising this. The issue is tracked in #4153
chia7712
on 24 Feb 2020
點選"delete this pipeline"後並沒有幫忙刪除該pipeline上原有的元件
重現方式:
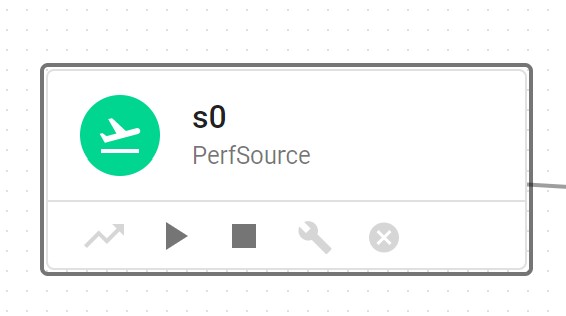
- 建立PerfSource
- 建立pipeline-only topic
- 啟動PerfSource
- 點選"delete this pipeline"
Issue is tracked in #4140
chia7712
on 24 Feb 2020
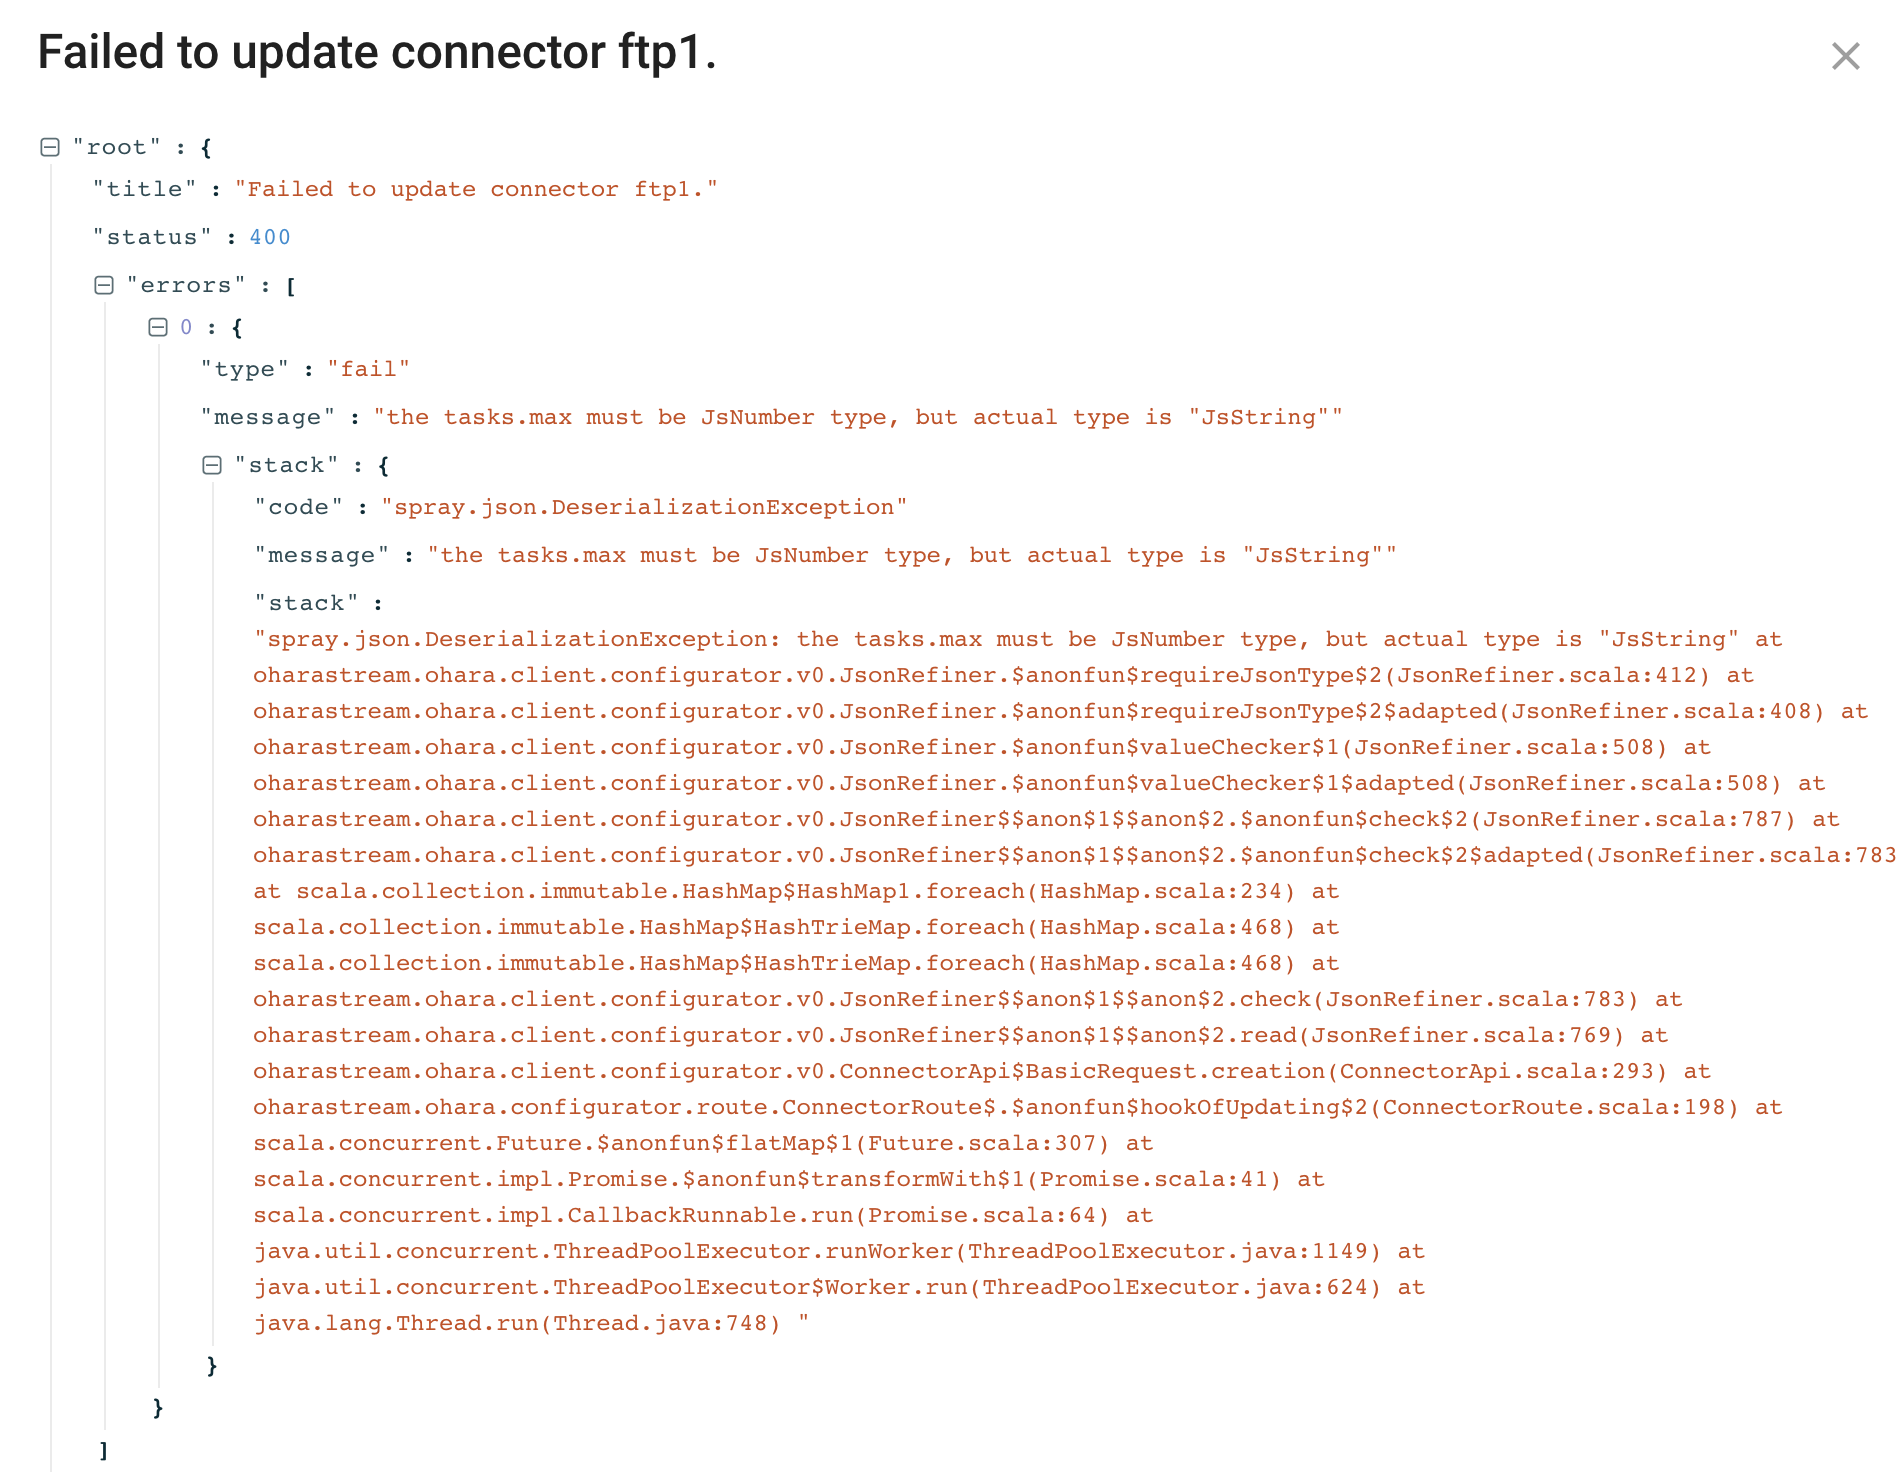
在 connector 因後端出現錯誤而進入 FAILED 狀態下, 若使用者需要修改 property, 目前操作流程需要先將 connector stop, 才能 edit property.
因此, 在 FAILED 時應該要 disable "Edit" button.
Issue is tracked in #4173
vitojeng
on 24 Feb 2020
Log 內容自動跳到最前面
操作順序: Develop Tools -> LOGS -> select worker
- 顯示 logs 內容
- Scrollbar 捲至最後
- 內容慢慢向上移動(按 Up key or 使用滑鼠), 重覆幾次後就會發現自動跳到最上面了
fixed in #4262
vitojeng
on 24 Feb 2020
有時候會出現下列情形(目前尚無法重現), 目前遇到 4-5 次:
在 Develop Tools, 從 LOGS tab 切換至 TOPICS tab 後即跳至 500 page:
500: Oops, something went terribly wrong!
You either tried some shady route or you came here by mistake. Whichever it is, try using the navigation
refresh page 後似乎沒遇到什麼問題~
Update: 應該抓到了, 請見 #4121
vitojeng
on 24 Feb 2020
有時候會出現下列情形(目前尚無法重現), 目前遇到 4-5 次:
在 Develop Tools, 從 LOGS tab 切換至 TOPICS tab 後即跳至 500 page:500: Oops, something went terribly wrong!
You either tried some shady route or you came here by mistake. Whichever it is, try using the navigationrefresh page 後似乎沒遇到什麼問題~
This may be related to #4091, could you pull the PR and test the same scenario again?
saivirtue
on 24 Feb 2020
The error.folder setting in FtpSource is defined with Optional, but the backend require it...
saivirtue
on 25 Feb 2020
Failed to inspect topic XX info after delete topic(#4139)
vitojeng
on 25 Feb 2020
FTP Sink 的 File Need Header 無法打勾
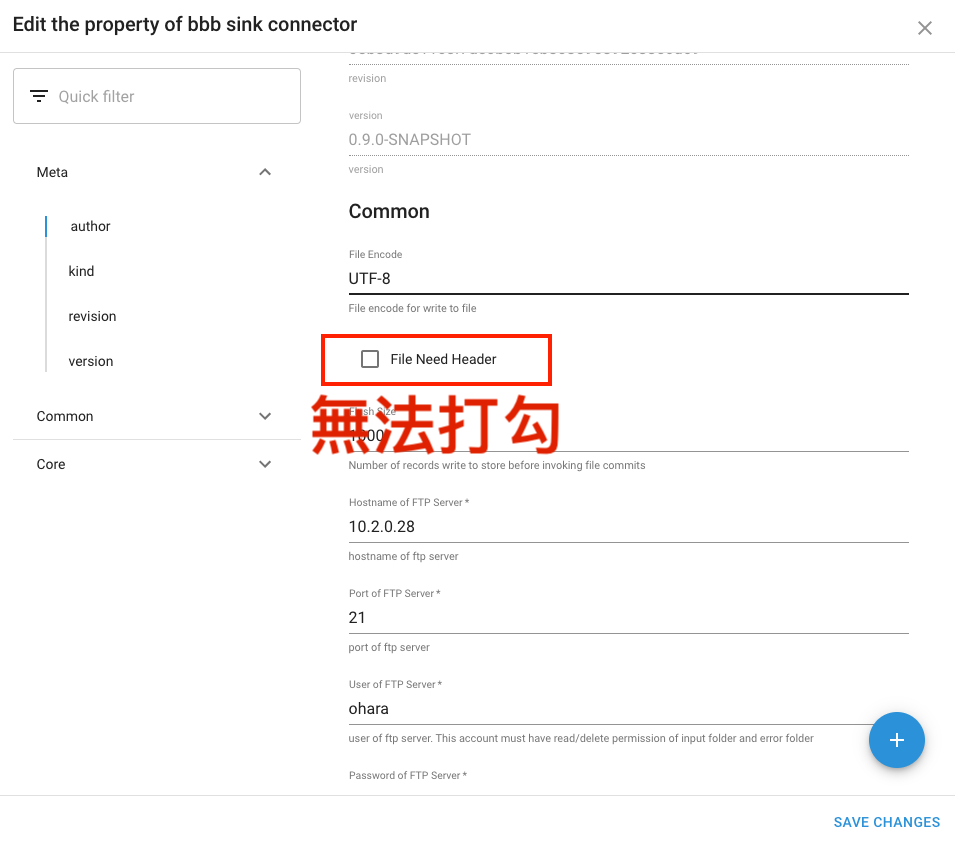
[Updated by sam]
ping @eechih
This issue should be fixed in #4187, could you help me to verify after merged?
eechih
on 25 Feb 2020
重開所有服務後,event logs裡面依舊有前世的記憶
@chia7712 我會在下個版本處理 #4143
eechih
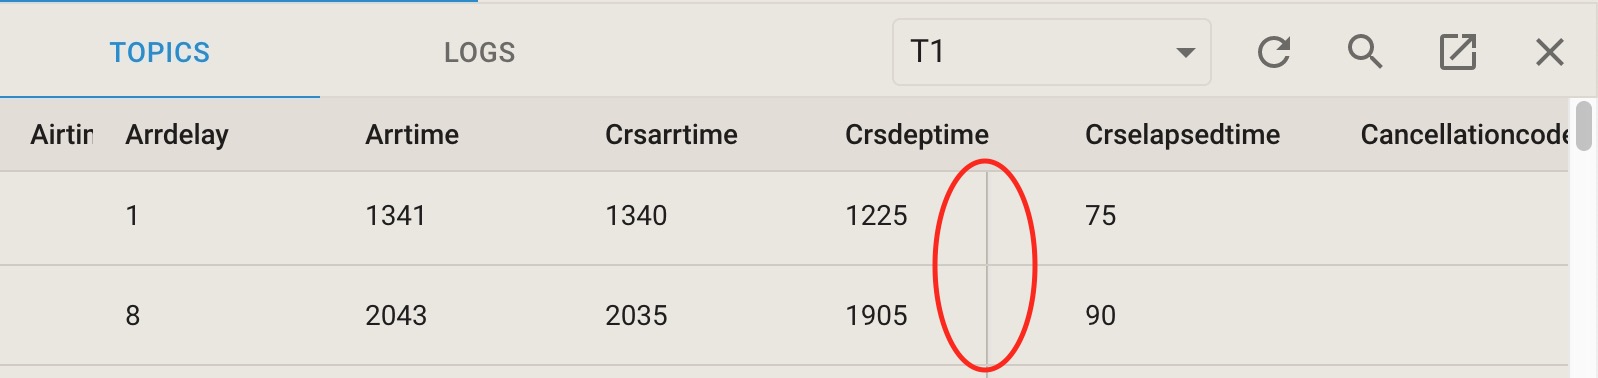
on 25 Feb 2020
Minor: a vertical line in the TOPICS tab.
vitojeng
on 25 Feb 2020
從pipeline-only topic無法拉線連接到JsonOut
@chia7712 Are you still experiencing this? I'm unable to repro this on my machine...
konekoya
on 26 Feb 2020
Are you still experiencing this? I'm unable to repro this on my machine...
I fail to produce this error :(
chia7712
on 26 Feb 2020
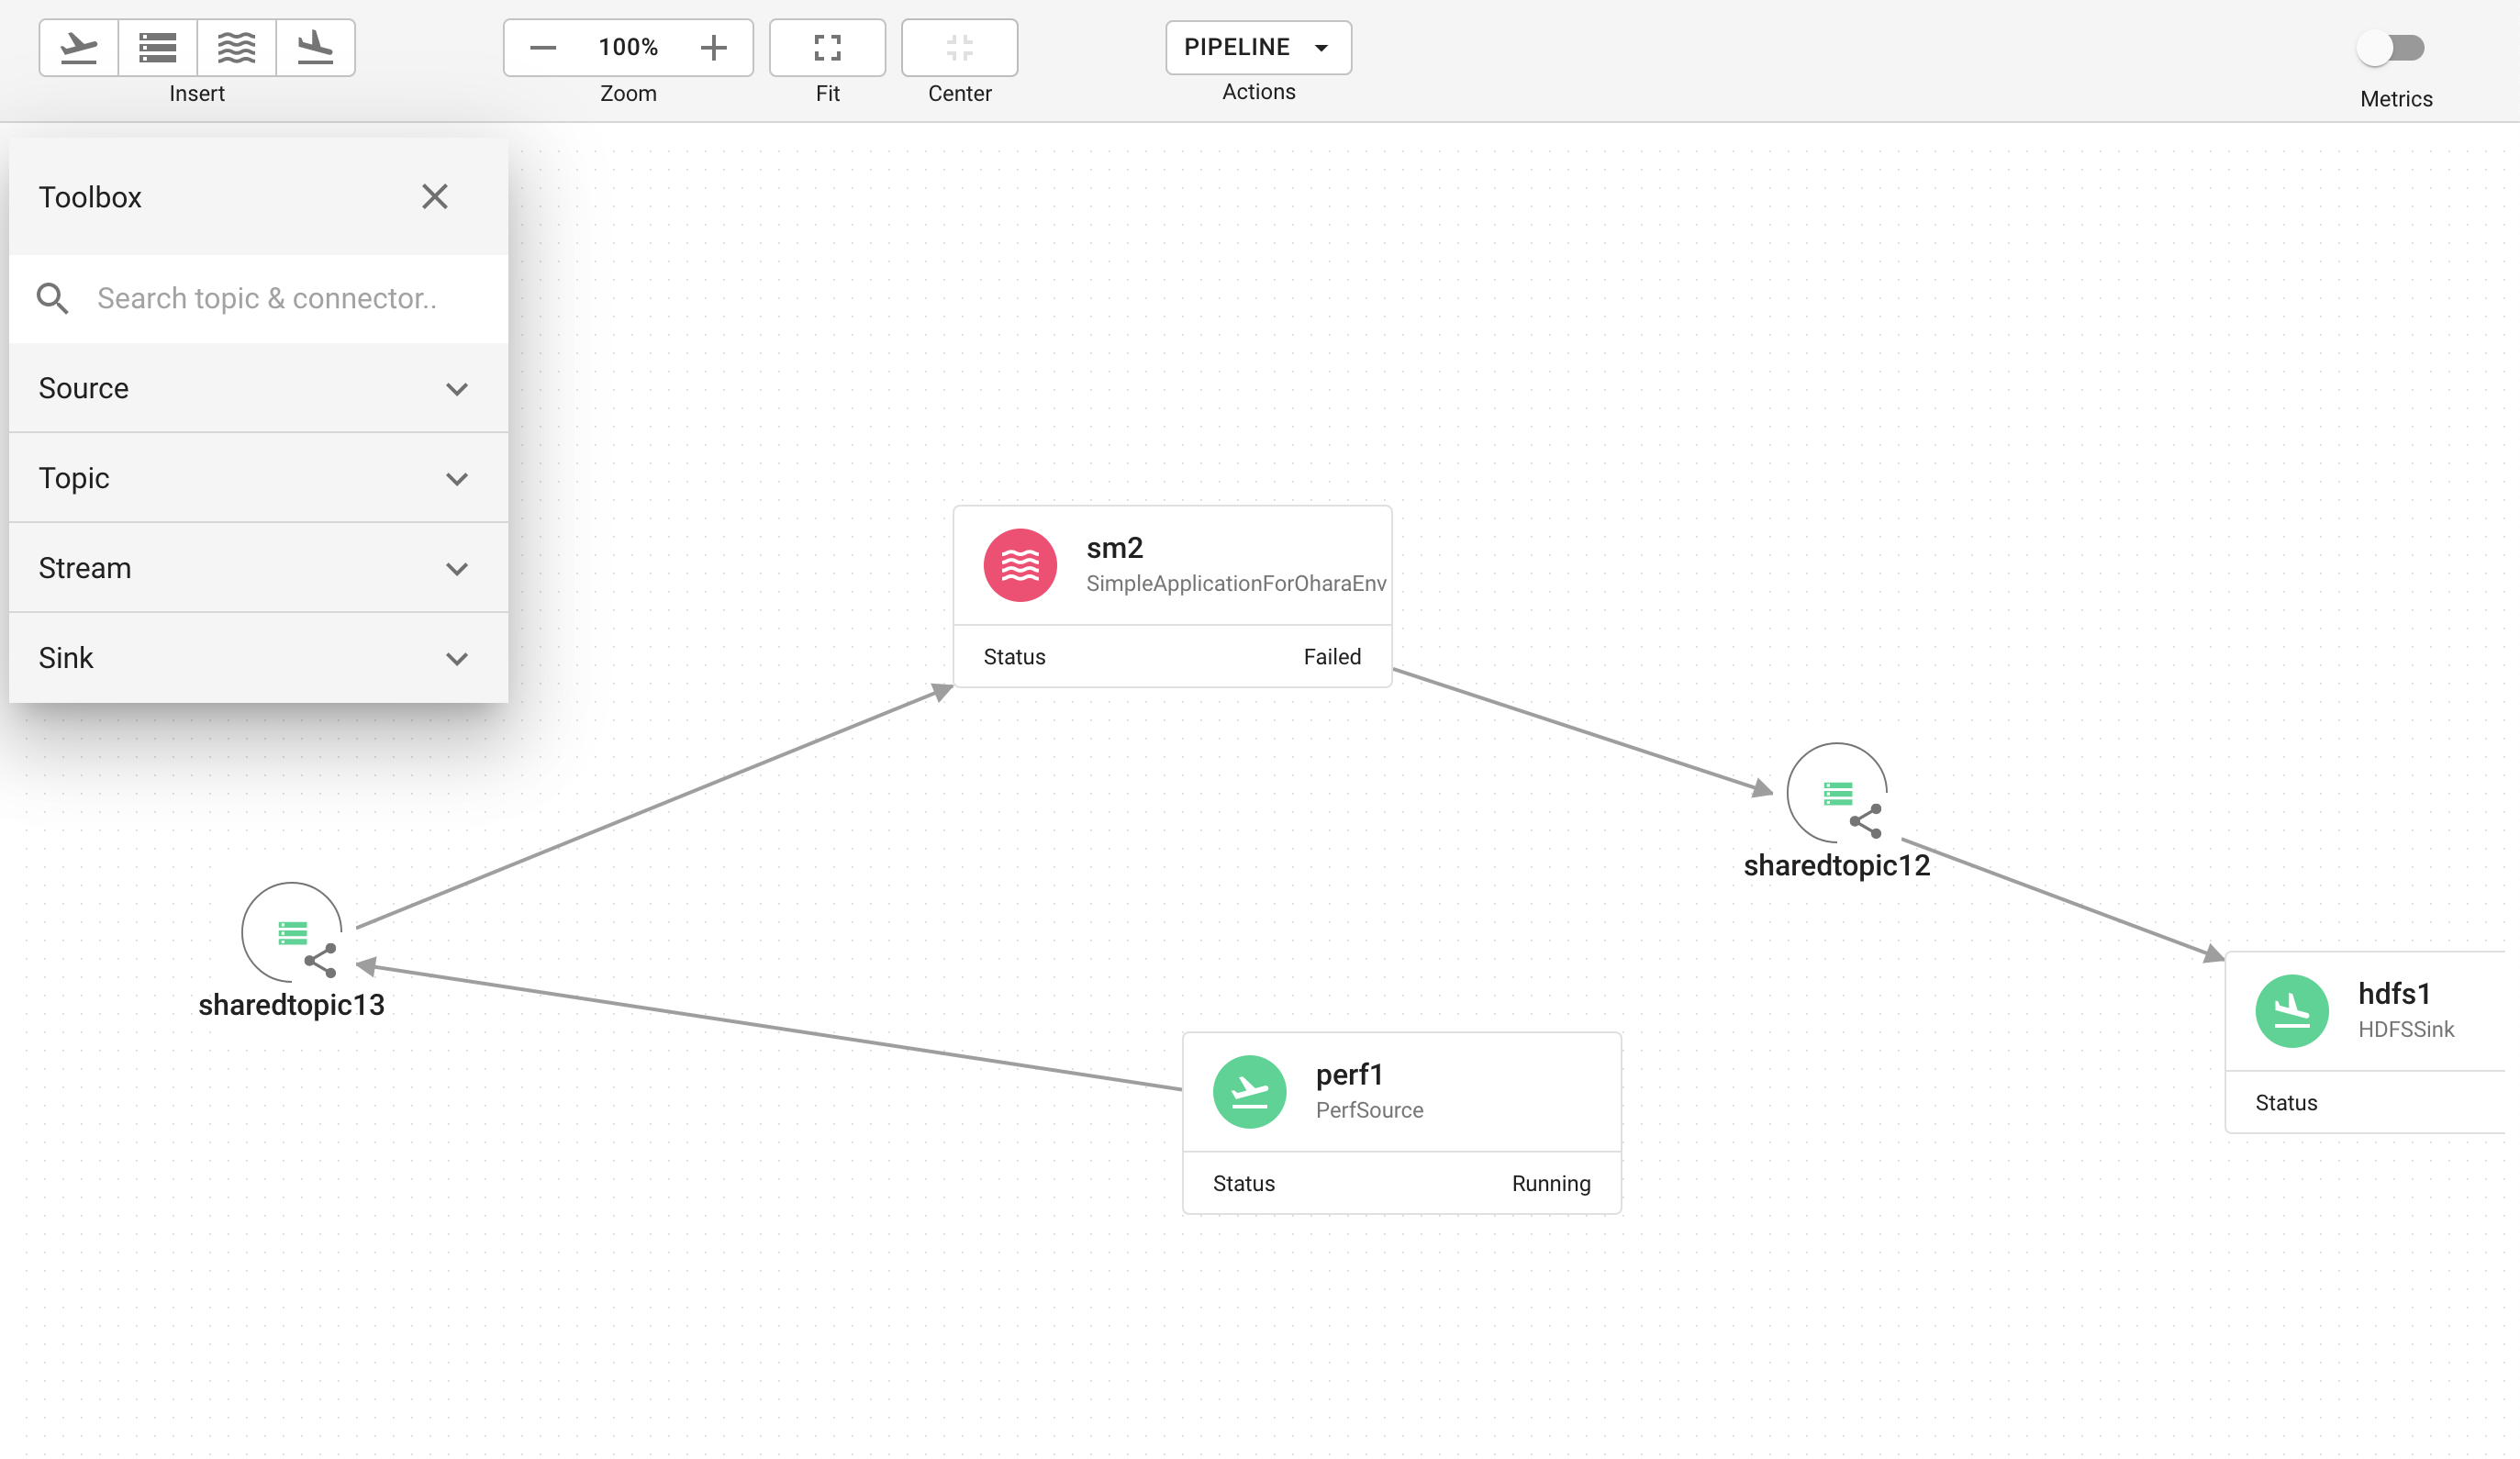
Failed to create shared topic
Describe the bug
建立 Shared Topic 遇到啟動失敗後,沒有出現在 Toolbox 或 Topics,也無法再次建立(使用相同名稱)。
To Reproduce
- 新增 Shared Topic (Name: sharedtopic11, Partitions: 3, Replication factor: 3)
- 錯誤訊息 "Failed to start topic sharedtopic11"
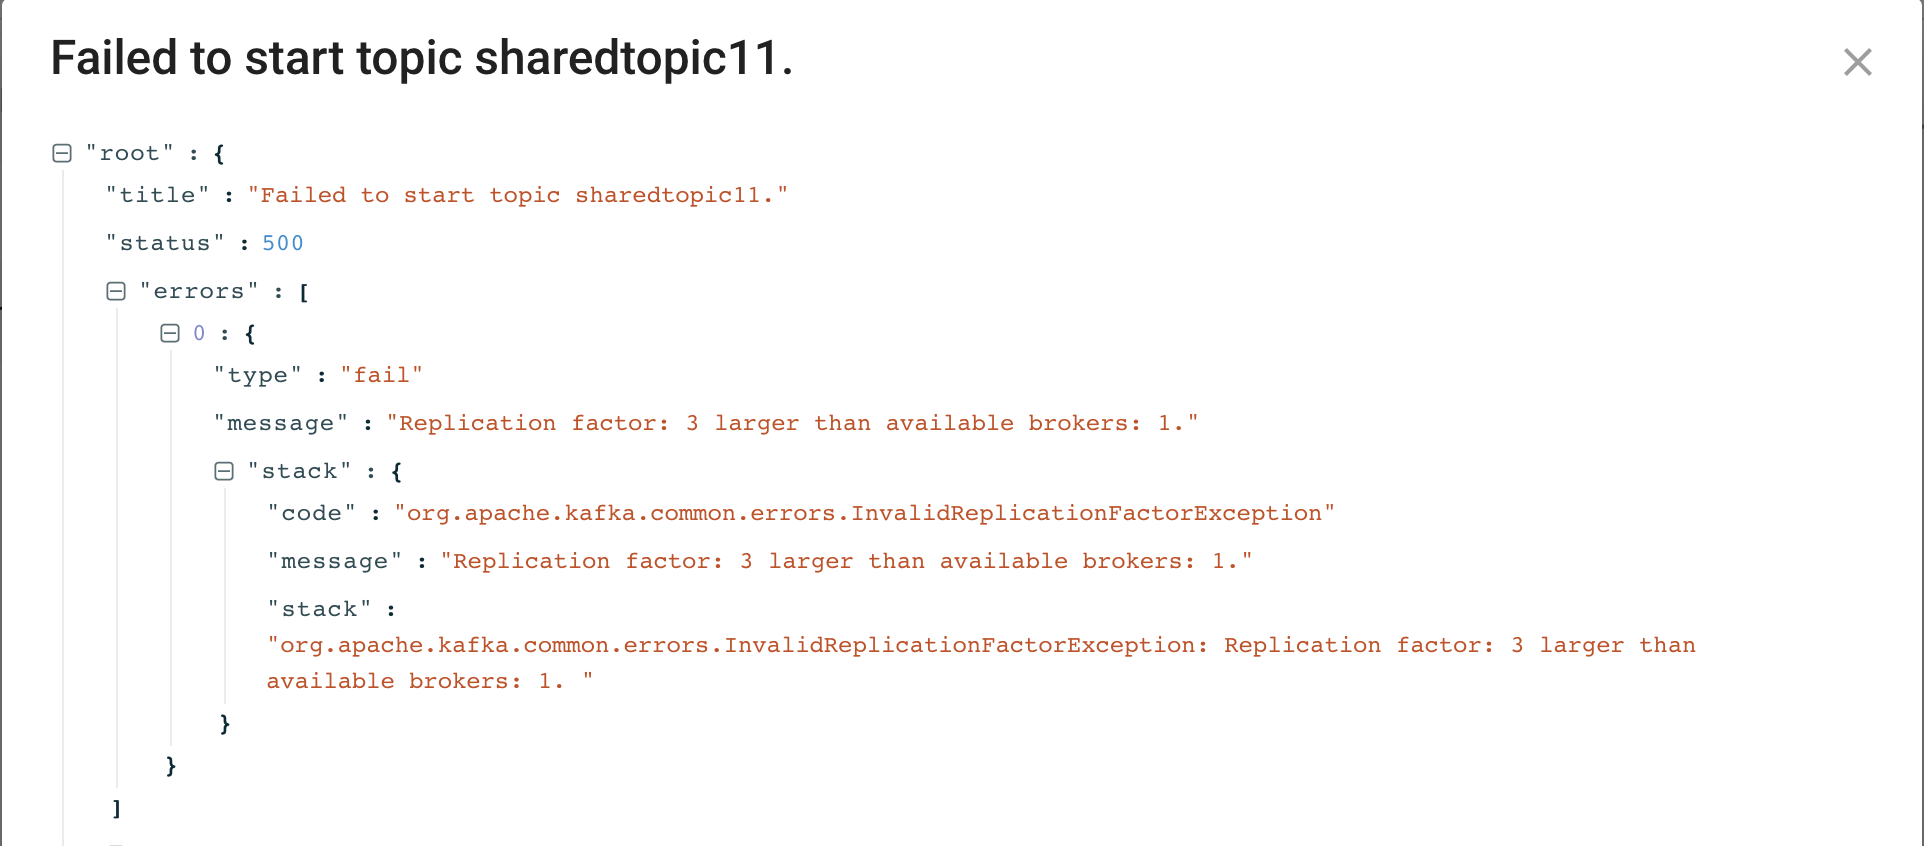
- 再次新增 Shared Topic (Name: sharedtopic11, Partitions: 1, Replication factor: 1)
- 錯誤訊息 "Failed to create topic sharedtopic11"
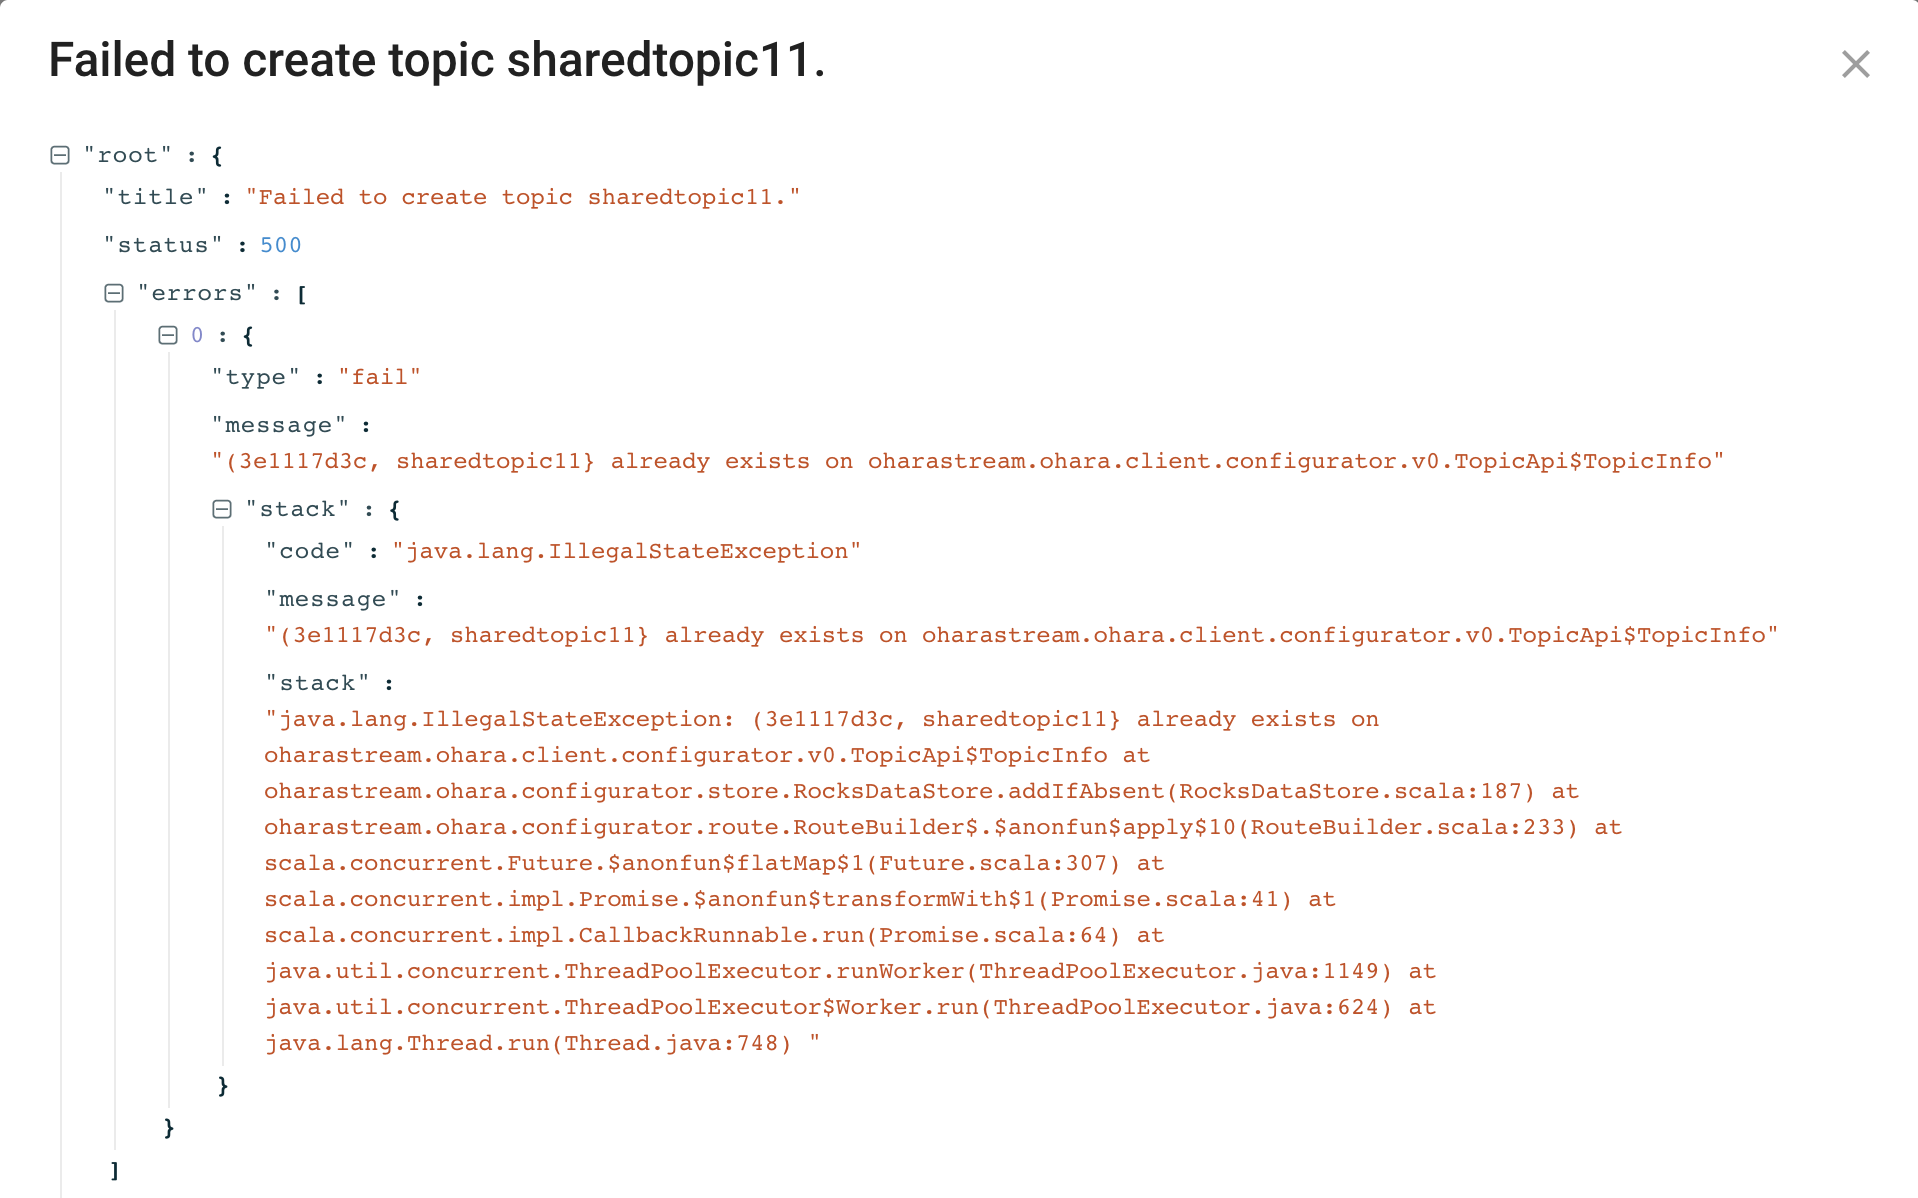
- 刷新頁面後,Topic sharedtopic11 有出現在 Toolbox 上,加到 Pipeline 裡,它的狀態是 stopped,沒有啟動的 Topic 是無法使用
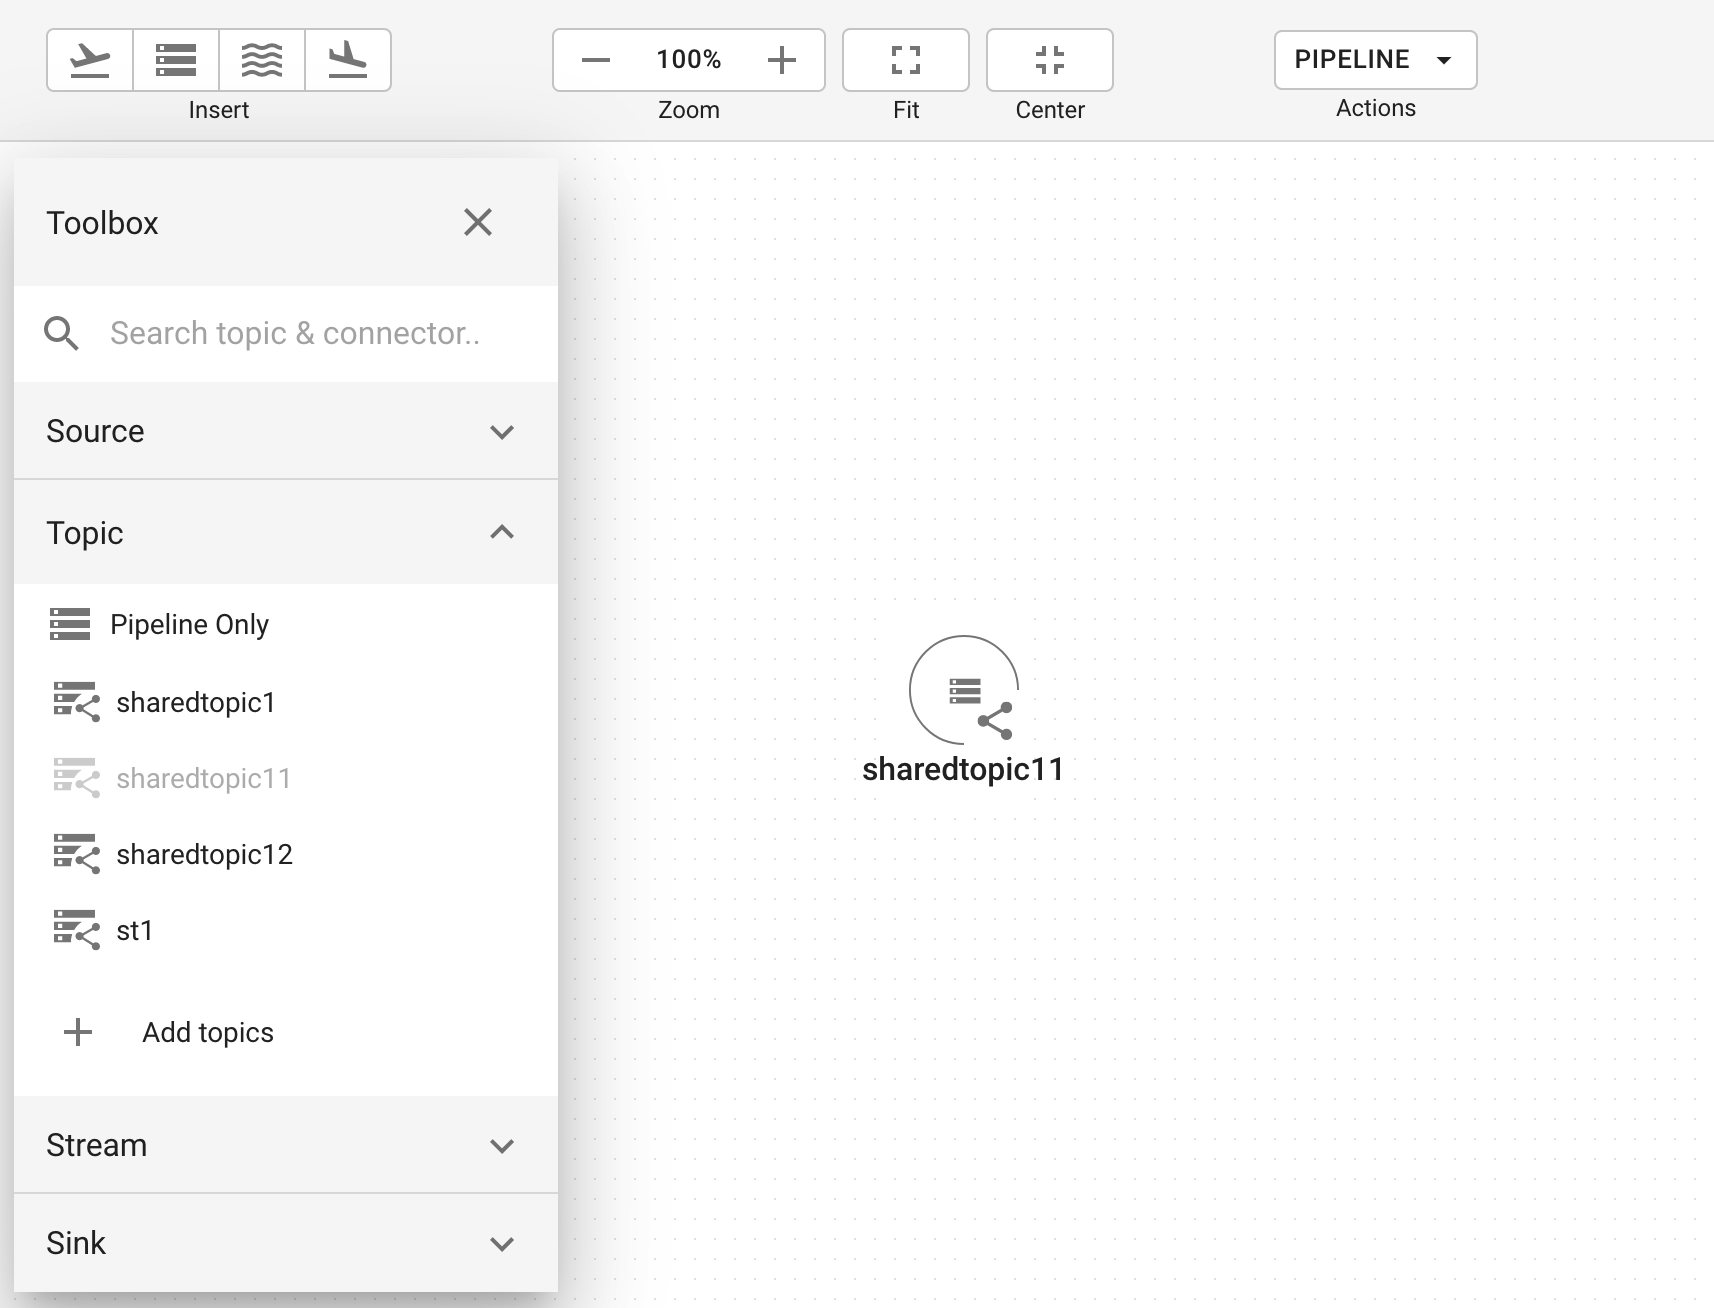
related to #4175
eechih
on 26 Feb 2020
沒有加入到 Pipeline 的 Topic,不應該出現在選單中
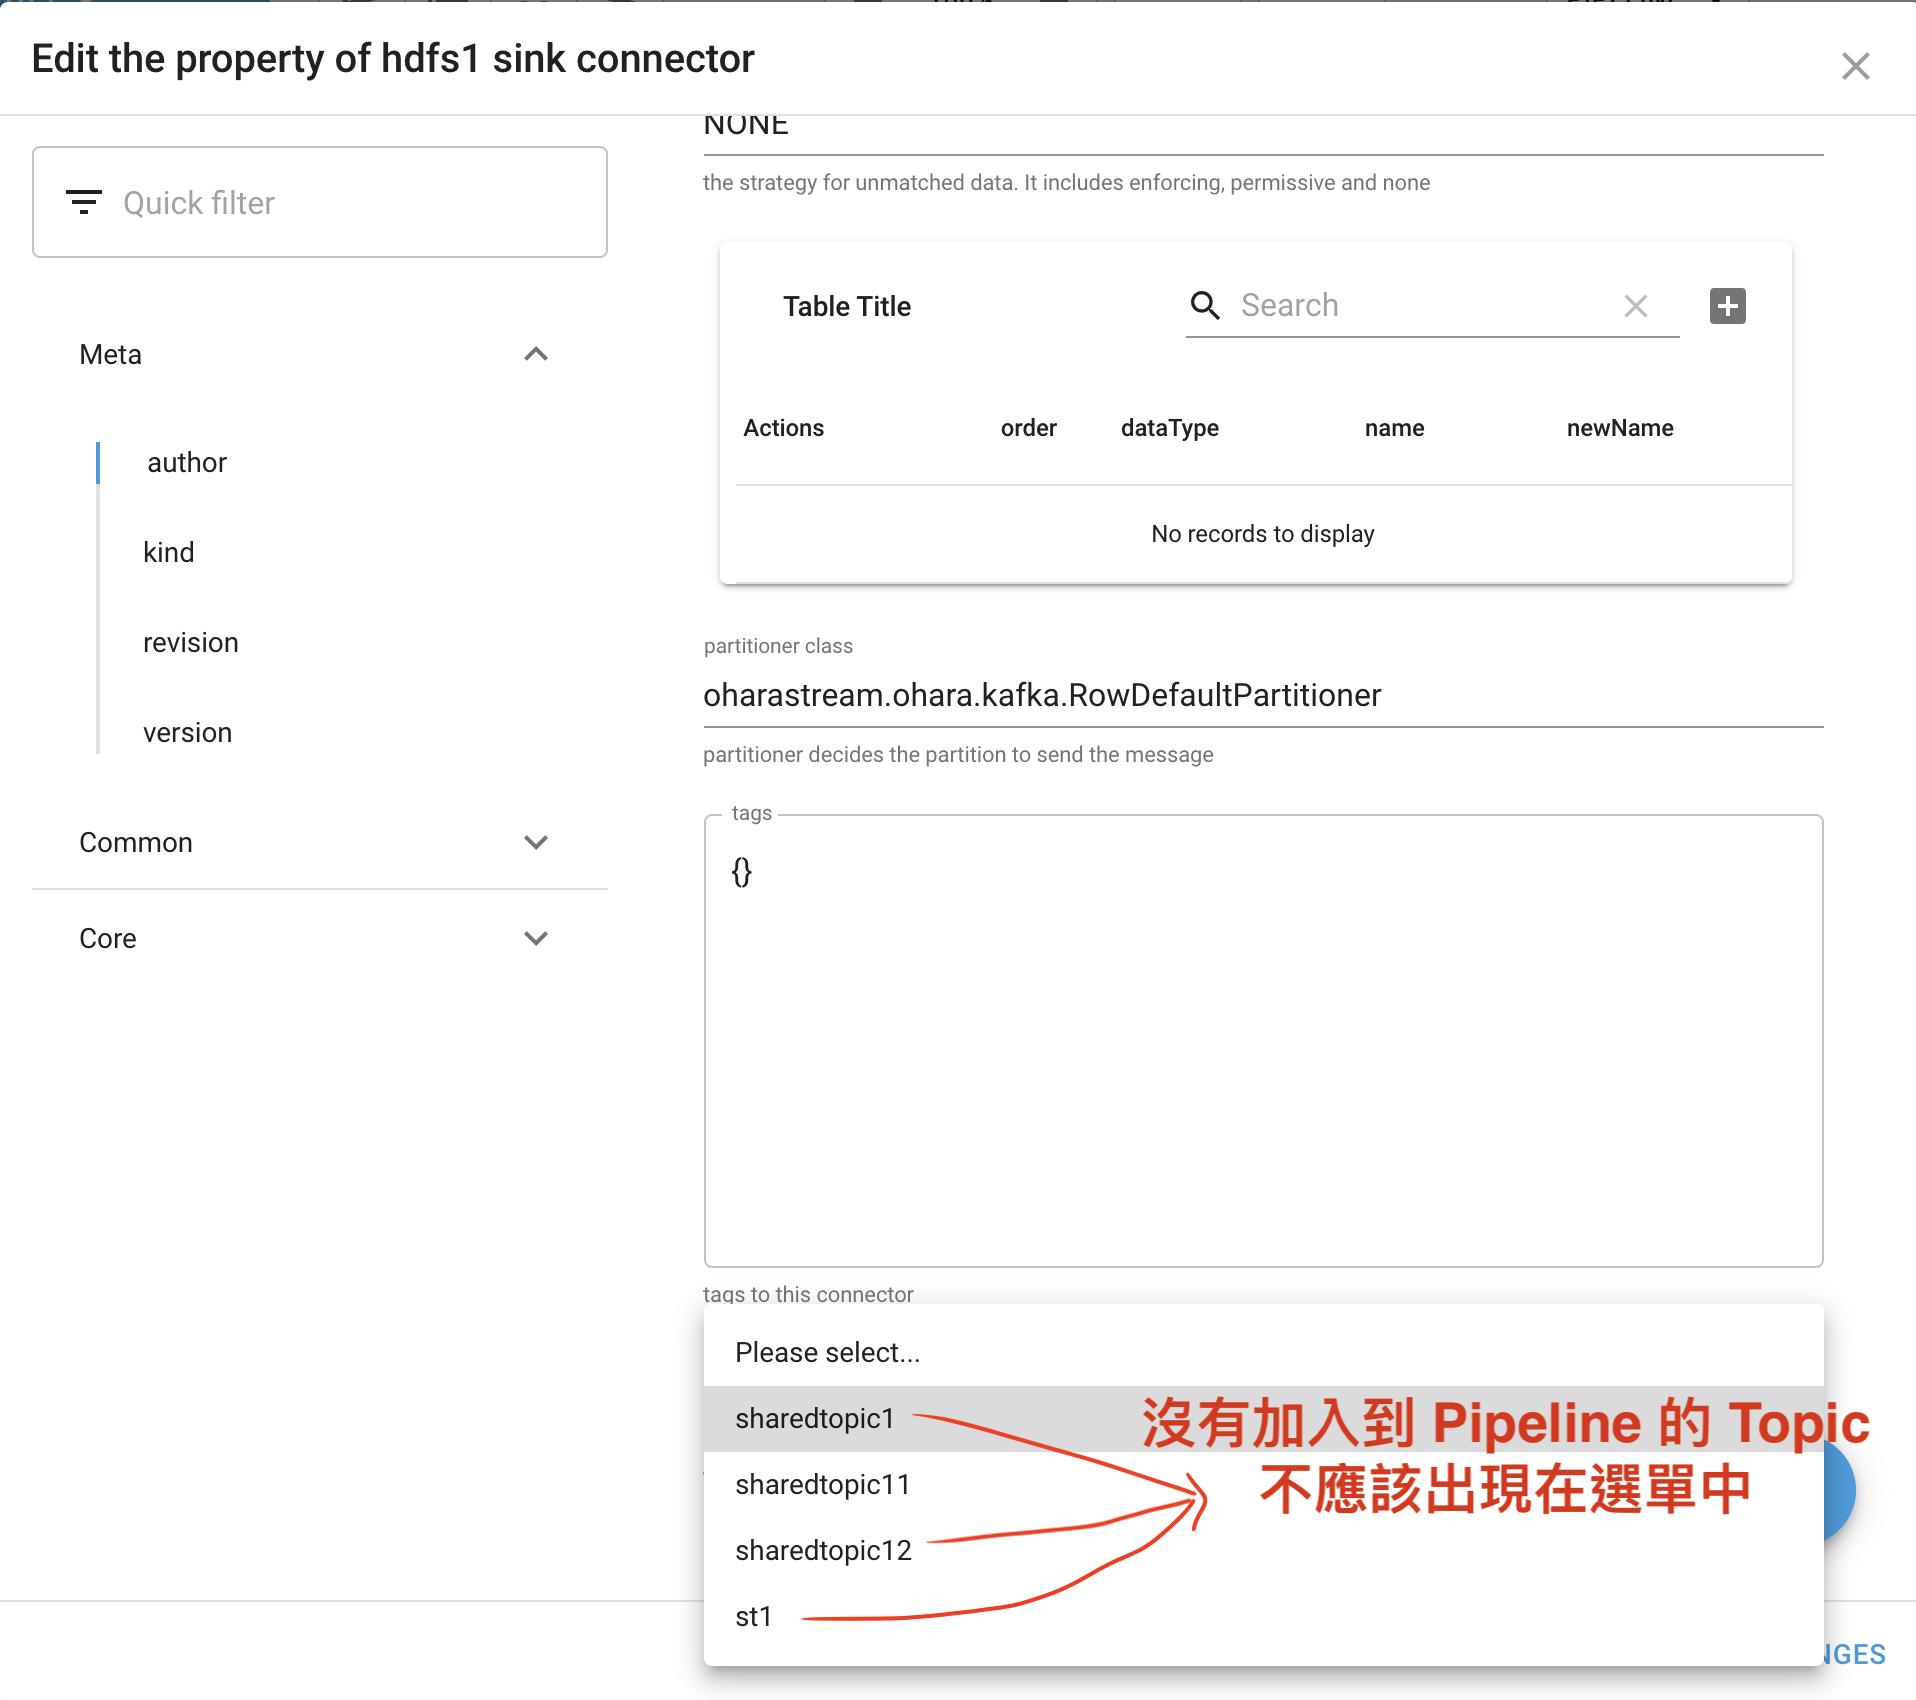
Issue is tracked in #4176
eechih
on 26 Feb 2020
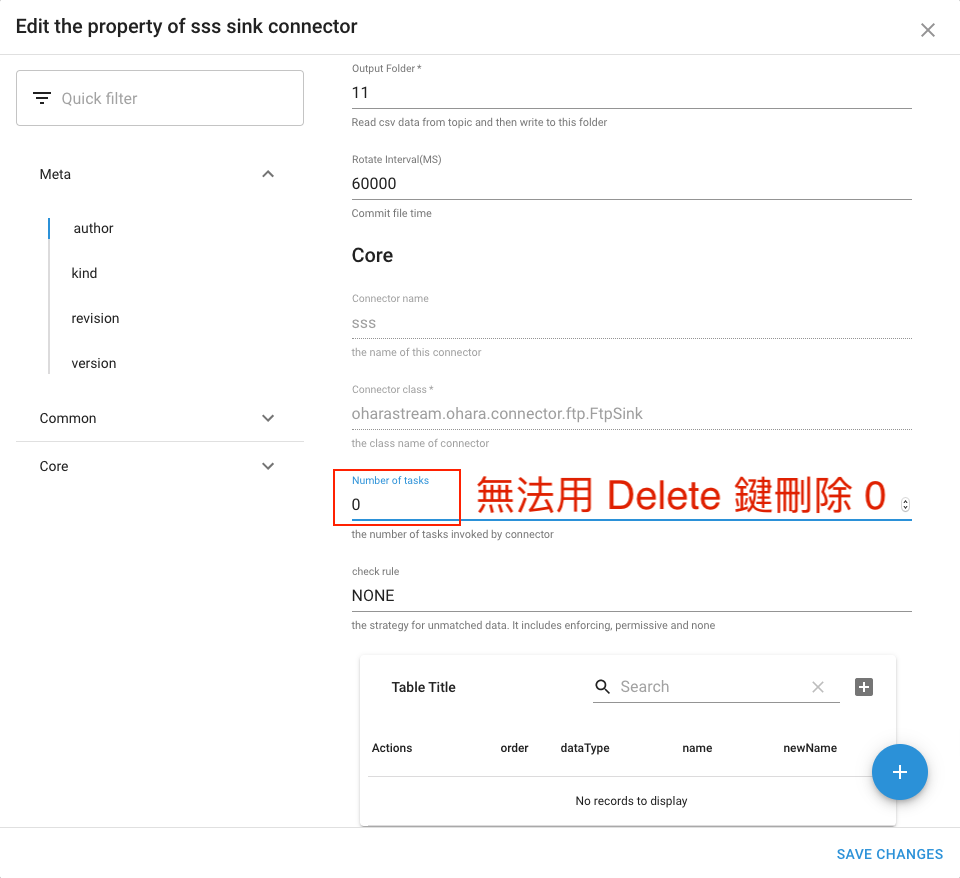
調整 number of task 後,存檔會失敗
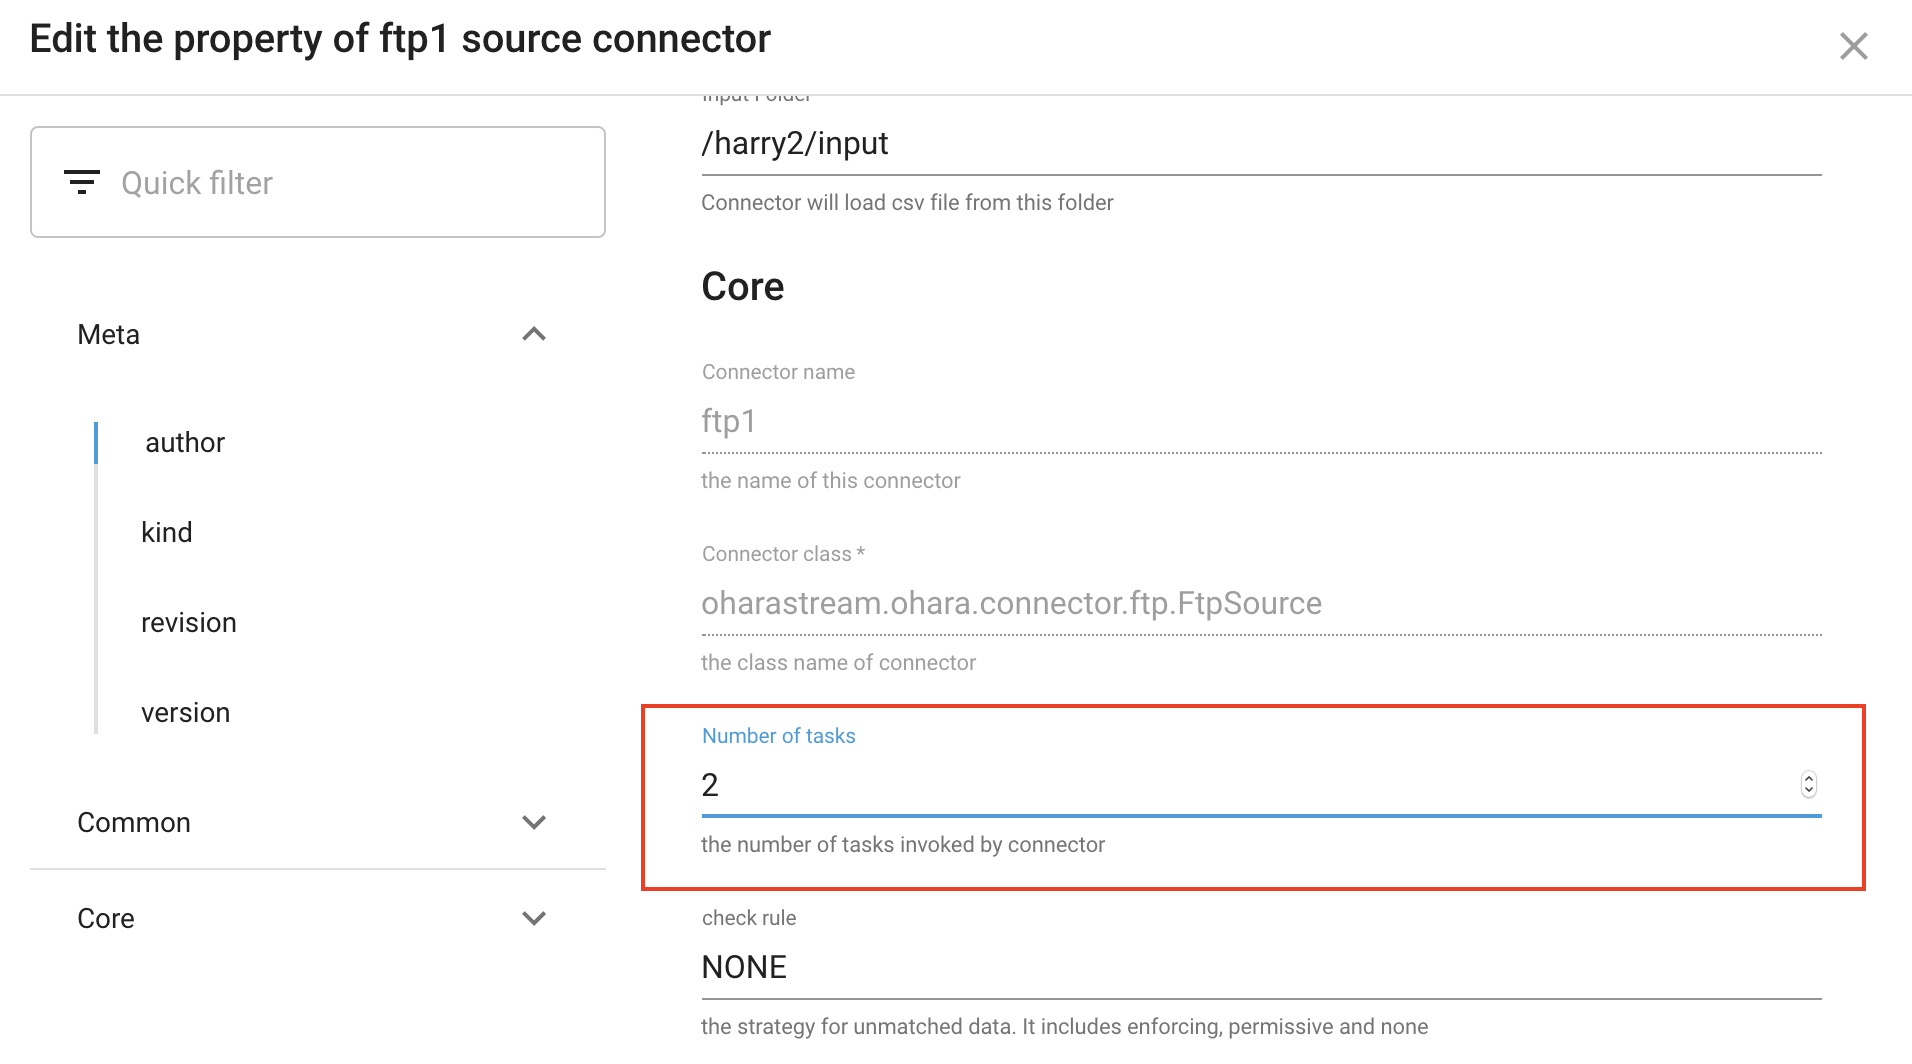
related to #4177
eechih
on 26 Feb 2020
I fail to produce this error :(
Not problem. I will mark the issue as resolved then :)
konekoya
on 26 Feb 2020
啟動中的 Stream,如果 Save Change 會造成 Stream 的狀態變成 Failed
related to #4178
eechih
on 26 Feb 2020
Minor: Event log 訊息太長時, row 高度會暴增, 建議將訊息截斷
vitojeng
on 26 Feb 2020

port的顯示不用逗號,那個不是薪水
chia7712
on 3 Mar 2020
已經啟動的connector依然可以再次啟動?
This issue is tracked in #4236
chia7712
on 3 Mar 2020
sink connector的nodes和metrics沒有顯示出來
Fixed in #4196
chia7712
on 3 Mar 2020
sink connector的nodes和metrics沒有顯示出來
@chia7712 A fix is on the way... #4196
cc @wu87988622 Please mark the comment as resolve once the PR is in. Thanks :)
konekoya
on 3 Mar 2020
已經啟動的connector依然可以再次啟動?
@eechih I think we have missed this... So I will file another issue to fix this 😅
konekoya
on 4 Mar 2020
已經啟動的connector依然可以再次啟動?
@eechih I think we have missed this... So I will file another issue to fix this 😅
Ok~ Thanks @konekoya
eechih
on 4 Mar 2020
issues #4247
eechih
on 4 Mar 2020
Pipelines 清單自動只剩一個. refresh page 一開始有三個 pipeline:
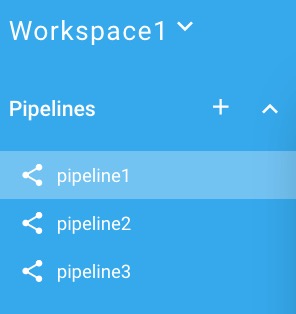
靜置約 10 秒剩一個:
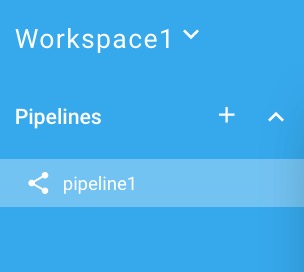
重現: 建一個 workspace, 接著再建三個 pipelines, 過一會兒應該就可發現
fix in #4148
vitojeng
on 4 Mar 2020
重現: 建一個 workspace, 接著再建三個 pipelines, 過一會兒應該就可發現
@wu87988622 it's happing again... 🙇
konekoya
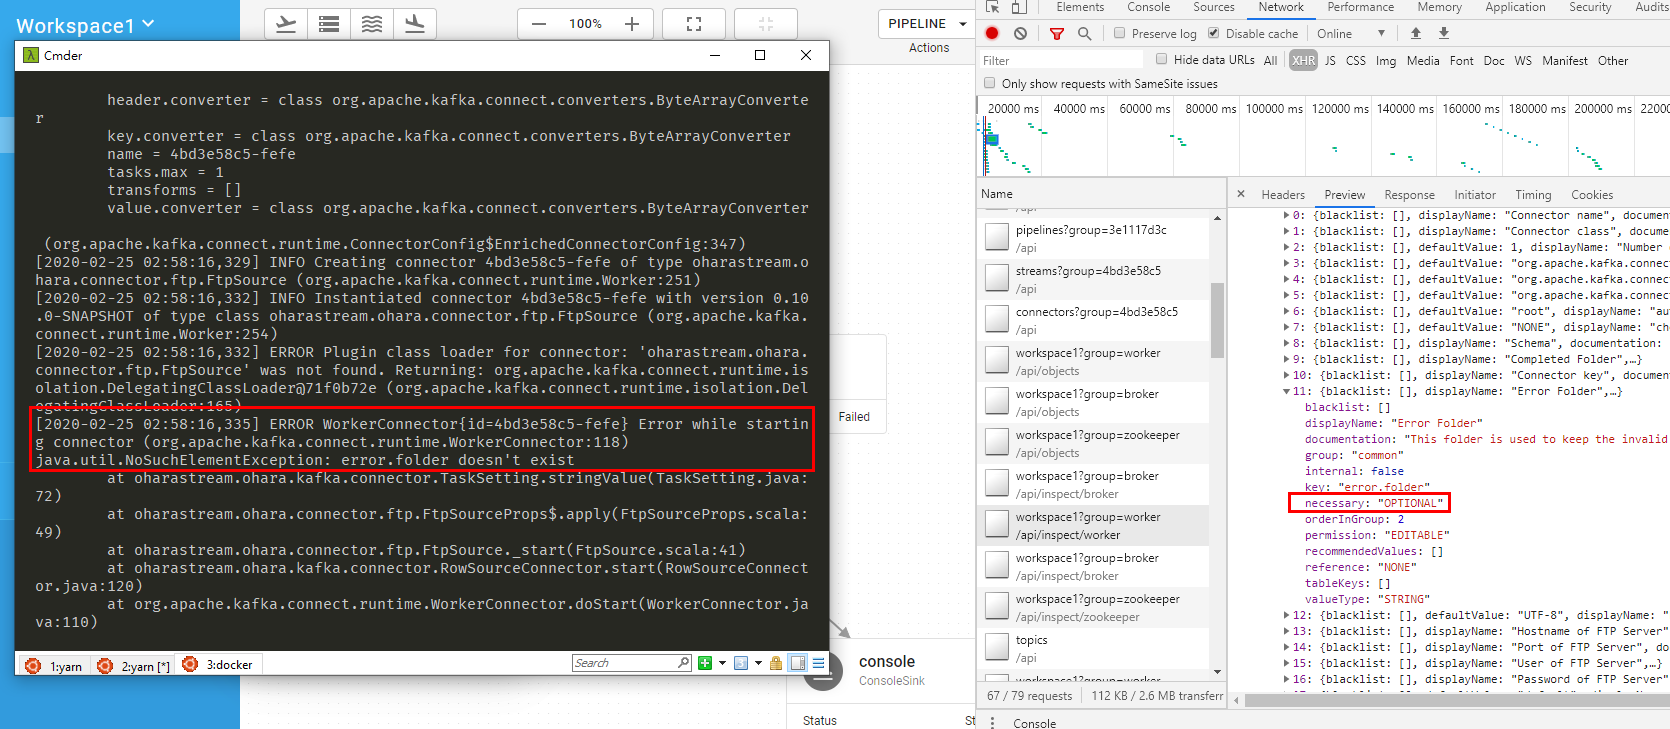
on 4 Mar 2020
FtpSourceConnector 相關.
重現:
- 填入相關 setting, 但是 input.folder 的資料夾填錯(不存在), 並連結 topic
- Start connector
- Response Error:
error: java.util.NoSuchElementException: /vito/source/files doesn't exist
    at oharastream.ohara.client.filesystem.ftp.FtpClient$Builder$FtpClientImpl.fileType(FtpClient.scala:497)
    at oharastream.ohara.client.filesystem.ftp.FtpClient$Builder$$anon$1.$anonfun$fileType$1(FtpClient.scala:304)
    at oharastream.ohara.client.filesystem.ftp.FtpClient$Builder$$anon$1.retry(FtpClient.scala:281)
    at oharastream.ohara.client.filesystem.ftp.FtpClient$Builder$$anon$1.fileType(FtpClient.scala:304)
    at oharastream.ohara.client.filesystem.ftp.FtpFileSystem$Builder$FtpFileSystemImpl.$anonfun$fileType$1(FtpFileSystem.scala:281)
    at oharastream.ohara.client.filesystem.FileSystem.wrap(FileSystem.scala:92)
    at oharastream.ohara.client.filesystem.FileSystem.wrap$(FileSystem.scala:90)
    at oharastream.ohara.client.filesystem.ftp.FtpFileSystem$Builder$FtpFileSystemImpl.wrap(FtpFileSystem.scala:136)
    at
:     :     :     :
==> 資料夾不存在但拋 NoSuchElementException 似乎有點奇怪?
vitojeng
on 4 Mar 2020
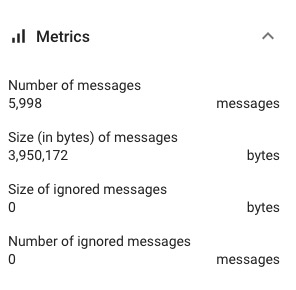
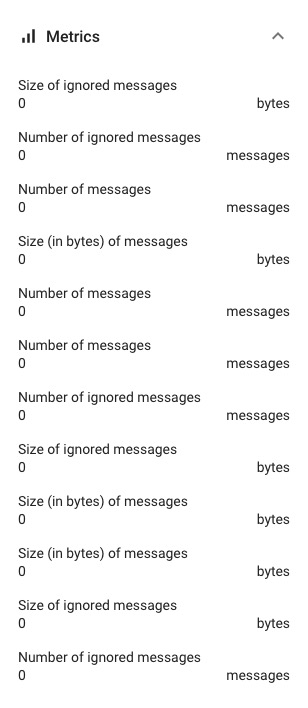
metrics 的數字與單位, 距離似乎太遙遠?
Tracked in #4255
vitojeng
on 5 Mar 2020
在 Property view -> Metrics 打開情形下, 若關閉 Property view 後再度打開, metrics 會處於關閉狀態.
希望能記住之前是否打開, 下次 Property view 打開時可以恢復之前的狀態
Tracked in #4256
vitojeng
on 5 Mar 2020
metrics 目前是反應後端 runtime 下的數字, 因此 pipeline component 在 stop 的狀態下, metrics 是否要歸 0 比較合理?
vitojeng
on 5 Mar 2020
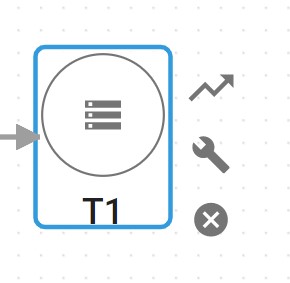
Internal Topic 的錯誤, 除了 name 之外, 可能還是附上 pipeline 上的名稱, 會比較清楚~
Ex: Failed to stop topic 59sn5fcc4y(T1)

Tracked in #4254
vitojeng
on 5 Mar 2020
metrics 目前是反應後端 runtime 下的數字, 因此 pipeline component 在 stop 的狀態下, metrics 是否要歸 0 比較合理?
@vitojeng 目前會做清除,但是要等到下一次更新,大約是等待五秒後,就會清掉了
wu87988622
on 5 Mar 2020
Internal Topic 的錯誤, 除了 name 之外, 可能還是附上 pipeline 上的名稱, 會比較清楚~
Ex: Failed to stop topic 59sn5fcc4y(T1)
@vitojeng Do you mean it should display __T1__ instead of __59sn5fcc4y__? The latter one actually doesn't mean anything to our users, so we always hide it from the UI :)
konekoya
on 5 Mar 2020
metrics 的數字與單位, 距離似乎太遙遠?
I think it's okay if we put them together anyway. Like 5,998 messages instead of breaking them apart
Pinging @eechih for idea :)
konekoya
on 5 Mar 2020
在 Property view -> Metrics 打開情形下, 若關閉 Property view 後再度打開, metrics 會處於關閉狀態.
希望能記住之前是否打開, 下次 Property view 打開時可以恢復之前的狀態
Pinging @eechih and everyone for thoughts @oharastream/frontend
konekoya
on 5 Mar 2020
資料夾不存在但拋 NoSuchElementException 似乎有點奇怪?
Or IllegalArgumentException?
chia7712
on 5 Mar 2020
metrics 的數字與單位, 距離似乎太遙遠?
Internal Topic 的錯誤, 除了 name 之外, 可能還是附上 pipeline 上的名稱, 會比較清楚~
Ex: Failed to stop topic 59sn5fcc4y(T1)
@vitojeng @konekoya 這兩個問題不影響使用者操作,等到下個版本再來討論,OK?
eechih
on 5 Mar 2020
@vitojeng @konekoya 這兩個問題不影響使用者操作,等到下個版本再來討論,OK?
OK~ 有需要 backport 的我會再額外提醒
vitojeng
on 5 Mar 2020
資料夾不存在但拋 NoSuchElementException 似乎有點奇怪?
Or IllegalArgumentException?
比 NoSuchElementException 好 10 倍
vitojeng
on 5 Mar 2020
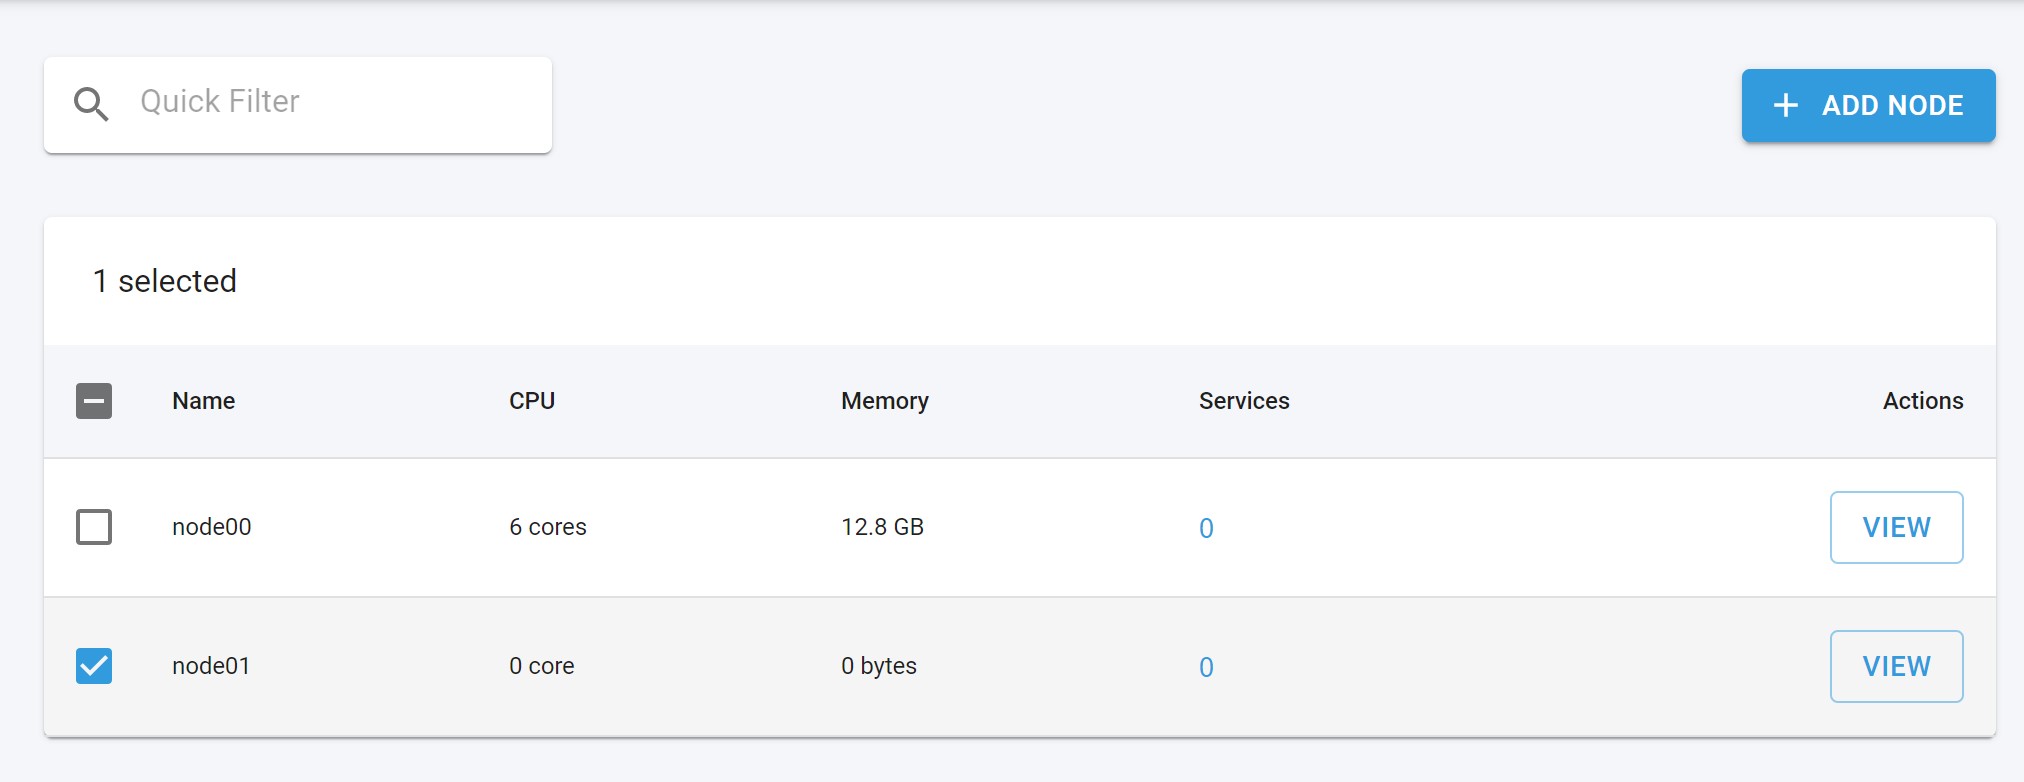
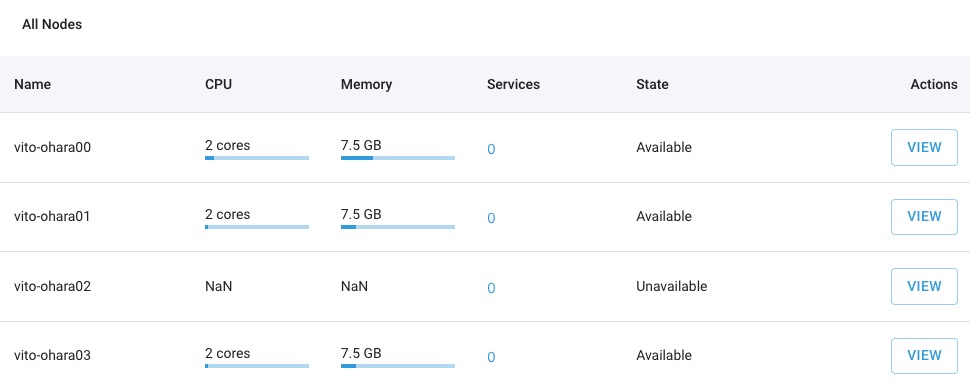
死掉的節點不應該讓使用者能選擇
fix in #4251
chia7712
on 5 Mar 2020
@vitojeng @konekoya 這兩個問題不影響使用者操作,等到下個版本再來討論,OK?
No problem :)
konekoya
on 5 Mar 2020
用 FtpSourceConnector 測試大型 csv file
Env:
- k8s mode
- 3 nodes, CPU 2 core, RAM 8 GB each node
Step:
- 建立一個 workspace, 3 nodes.
- 建立一個 pipeline, 並拉入: ftp source connector --> internal topic --> ftp sink connector
- Start source and sink connector
- 放一個 csv 小檔案(< 1 MB)到 input folder, 確認處理正常:
- input folder 移到 completed folder
- sink connector 有寫入 file.
- source/sink component 的 Metrics 顯示正確
- 再放一個 csv 小檔案到(< 1 MB) input folder, 確認處理正常. 同 step 3.
- 放入一個 csv 大檔案(600MB+)到 input folder. 觀察情形:
- Metrics: 前數分鐘, FtpSourceConnector 的 Property view 有顯示 Metrics, 但數字沒有更被新. 過更久的時間後, Metrics 即不再顯示(component 顯示 No metrics data available )
- input folder 的 csv 檔案仍然存在
- 用 Developer Tools/LOGS 觀察三個 node 的 worker, 沒有看到不正常的 exception.
- 此時再放一個 csv 小檔案, 發現也不會被處理了.
vitojeng
on 5 Mar 2020
切換 pipeline 時出現 error: Failed to stop topic XXXXX
- pipeline 1: 有一個 internal topic
- pipeline 2: 完全空的
在 pipeline1 切換到 pipeline 2 時, 出現 error: Failed to stop topic XXXXX
而pipeline2 切到 pipeline 1 時, 沒有出現 error.
不知為何在切換 pipeline 時會需要做這個動作?
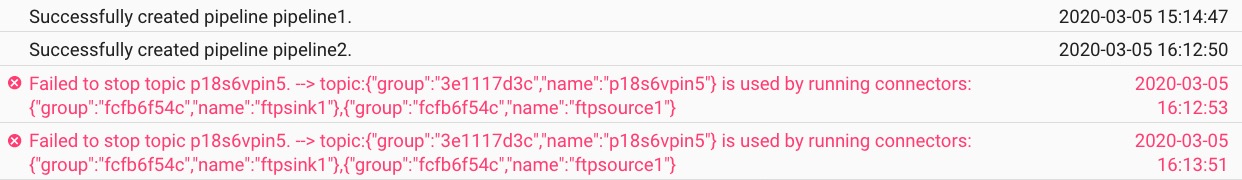
Detail
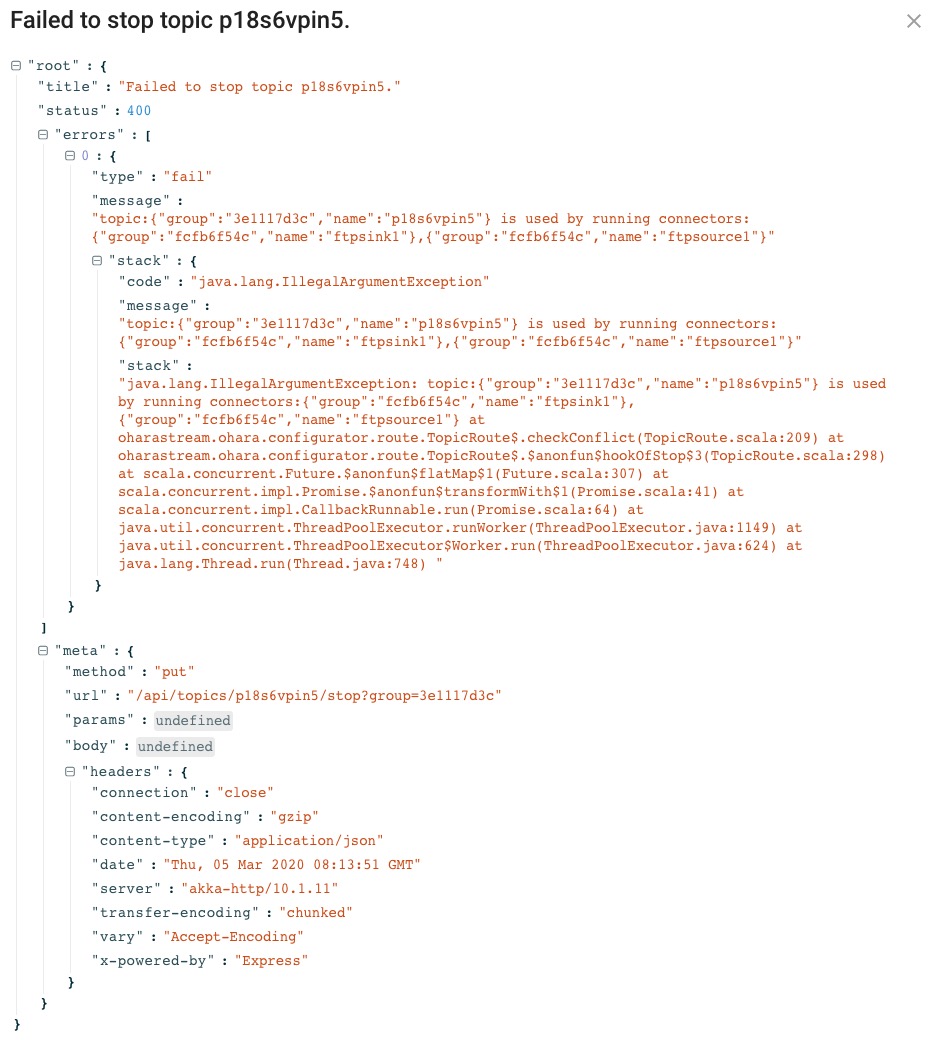
確認後若不是太困難, 希望這個 issue 可以 backport 到 0.9.x :)
vitojeng
on 5 Mar 2020
確認後若不是太困難, 希望這個 issue 可以 backport 到 0.9.x :)
Vito, there's already a PR addresses this issue. I'll try to get it in today and ping you again for testing. (Sorry, it seems like GitHub's mention feature is broken so I somehow couldn't tag you in this comment)
konekoya
on 6 Mar 2020
related with https://github.com/oharastream/ohara/issues/3706#issuecomment-595061071
dead node 的資訊顯示怪怪的~
fix #4263
vitojeng
on 6 Mar 2020
觀察 Snackbar 目前容易被忽略的因素: 一個是顯示在左下角, 另一個是顯示時間不長.
目前 layout 大部份操作都集中在畫面上半部, 使用者目光停留在上半部機會很高. 在高解晰度的大螢幕下, 左下角的 Snackbar 相信被忽略的機會大增. 因此建議 Snackbar 顯示在畫面中上方, 應該可以增加被使用者注意到的機會~ (希望可以 backport 到 0.9.x)
Fixed in #4268
vitojeng
on 6 Mar 2020
Property view 會自動關閉
在 Property view 開啟的情形下, 從 Developer Tools/LOGS 切換到 Developer Tools/Topic 時, Property view 會自動被關閉.
vitojeng
on 6 Mar 2020
確認後若不是太困難, 希望這個 issue 可以 backport 到 0.9.x :)
@vitojeng The PR has been merged. But It still needs some time to build the image :)
konekoya
on 6 Mar 2020
觀察 Snackbar 目前容易被忽略的因素: 一個是顯示在左下角, 另一個是顯示時間不長.
目前 layout 大部份操作都集中在畫面上半部, 使用者目光停留在上半部機會很高. 在高解晰度的大螢幕下, 左下角的 Snackbar 相信被忽略的機會大增. 因此建議 Snackbar 顯示在畫面中上方, 應該可以增加被使用者注意到的機會~ (希望可以 backport 到 0.9.x)
Pinging @oharastream/frontend for thoughts
konekoya
on 6 Mar 2020
related with #3706 (comment)
dead node 的資訊顯示怪怪的~
@vitojeng can you get me unavailable node response, i can't reproduce that, thanks
fix in #4263
wu87988622
on 6 Mar 2020
@vitojeng can you get me unavailable node response, i can't reproduce that, thanks
Just shutdown the one of kubernetes slave node and you should be able to reproduce it.
vitojeng
on 6 Mar 2020
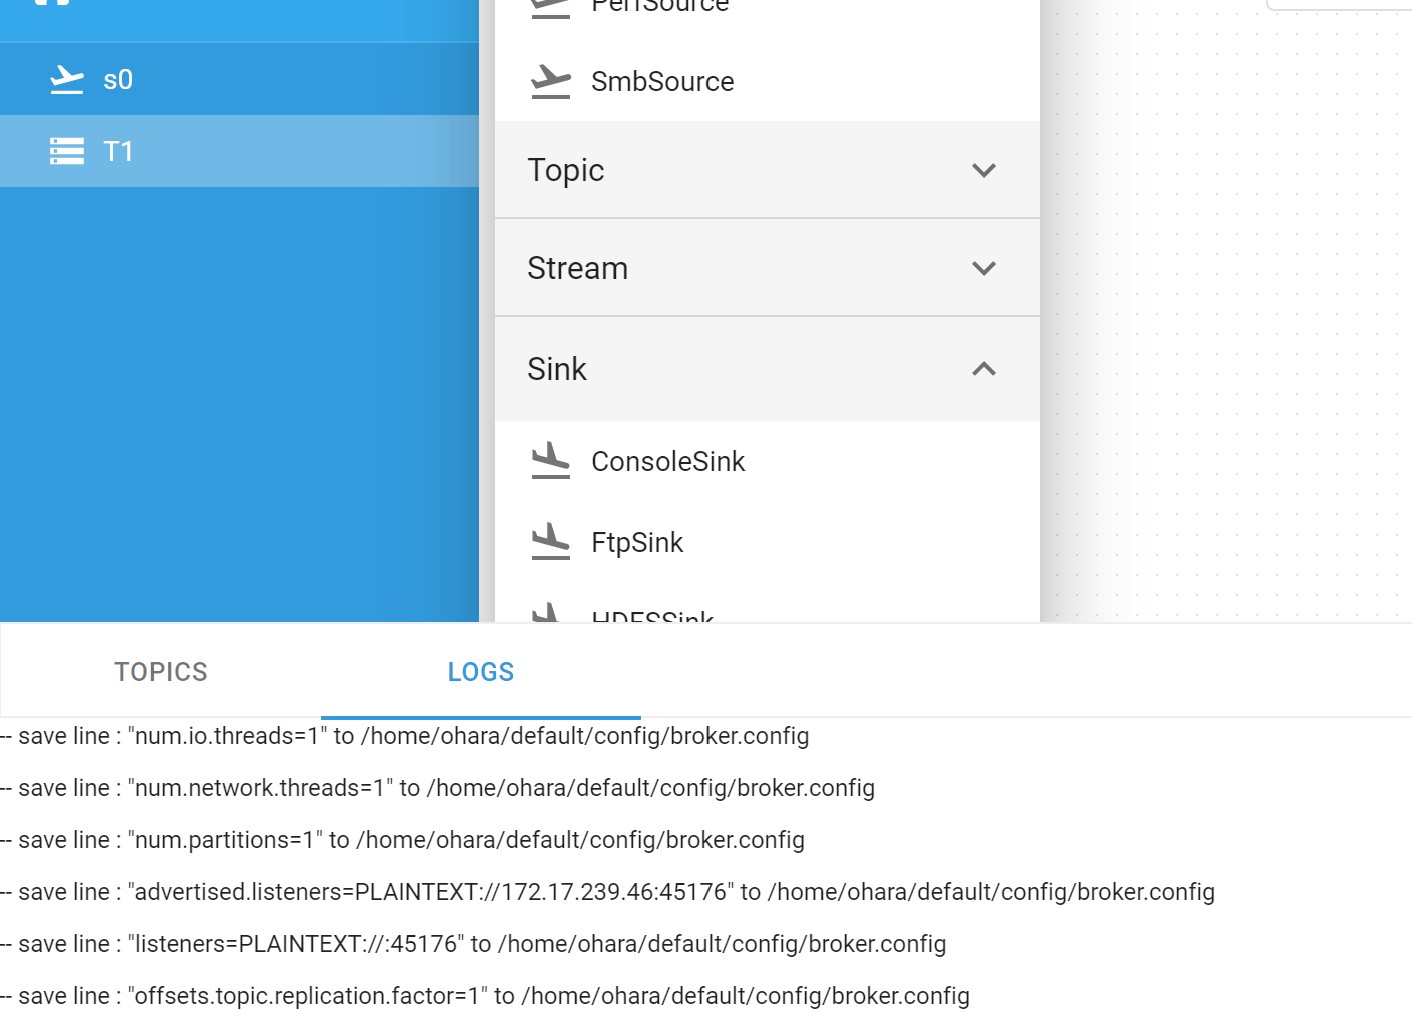
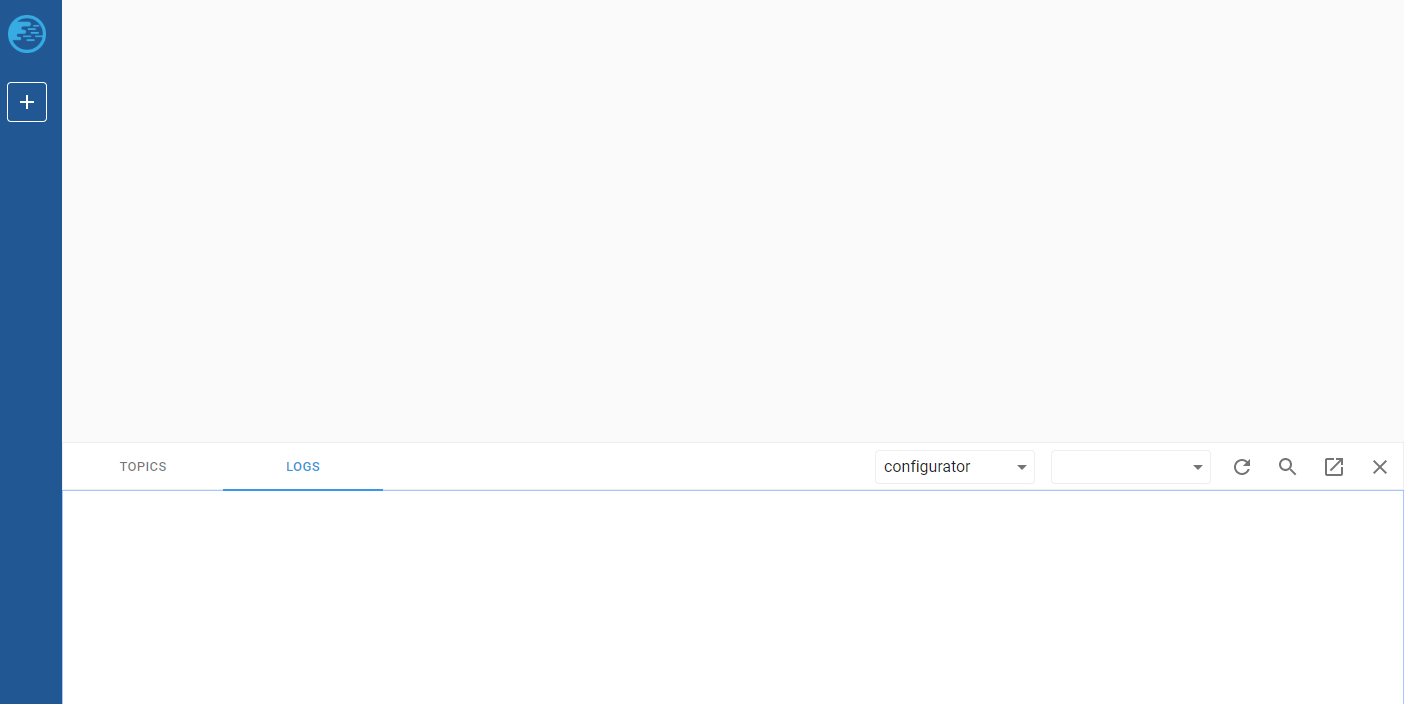
toolbox被log畫面擋住,沒有卷軸可以使用
Issue tracked in #4267
chia7712
on 9 Mar 2020
log畫面開著的時候,pipeline上的"變更"都會觸發重拉log...這是預期的行為嗎?
chia7712
on 9 Mar 2020
log畫面開著的時候,pipeline上的"變更"都會觸發重拉log...這是預期的行為嗎?
DevTool工具打開的時候,Pipeline上選中的component會觸發搜尋對應的log / topicData:
DevTool - topic tab :
- 選中topic => query topic data
- 選中stream => switch to log tab, query stream log
- 選中connector => switch to log tab, query worker log
DevTool - log tab :
- 選中topic => query broker log
- 選中stream => query stream log
- 選中connector => query worker log
saivirtue
on 9 Mar 2020
@saivirtue 了解,就是之前討論的選種哪個物件就找尋可能的logs
chia7712
on 9 Mar 2020
@saivirtue 了解,就是之前討論的選種哪個物件就找尋可能的logs
You are right :)
saivirtue
on 9 Mar 2020
如果現在UI嚴格限制只能1-to-1的話,那在連線後就應該把"連線"的按鈕遮掉...
Will be fixed in #4278
chia7712
on 9 Mar 2020
同一個workspace,不同pipeline裡面新增一個重複名稱的物件,會顯示錯誤但該物件依然留在畫布上
@chia7712 Hmm, I'm not able to repro this. Not sure if I understand this right:
- pipeline1 -> create FTP source named "aaa"
- pipeline2 => create FTP source named "aaa"
This works okay for me
konekoya
on 9 Mar 2020
@konekoya it seems a temporary connection error so I remove this comment :)
chia7712
on 9 Mar 2020
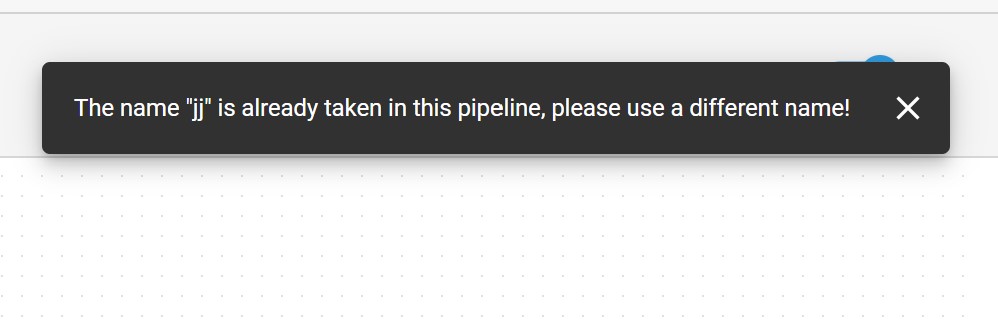
在 Create Pipeline 時, 若使用重覆的 name, 會在左下角顯示 "Failed to create pipeline XXX".
比較好的做法應該是 Create Pipeline Dialog 時通知使用者修正. (0.10 only)
Tracked in #4286
vitojeng
on 9 Mar 2020
在 Edit Property Dialog, 我們使用 * 顯示 password; 但在 Property View 裡並沒有使用 *:
Please backport to 0.9.x
4190 this pr is waiting for merge
vitojeng
on 9 Mar 2020
目前 Metrics 開關, 似乎是所有 Pipeline 都共用同一組.
每個 Pipeline , 應該有自己的 Metrics 開關, 預設是關. (0.10 only)
vitojeng
on 10 Mar 2020
討論: Pipeline componet name 目前只能小寫與數字.
使用者在想要以多個單字組合來命名時, 全部小寫會難以辦認, 可能需要討論如何修正.(0.10 only)
vitojeng
on 10 Mar 2020
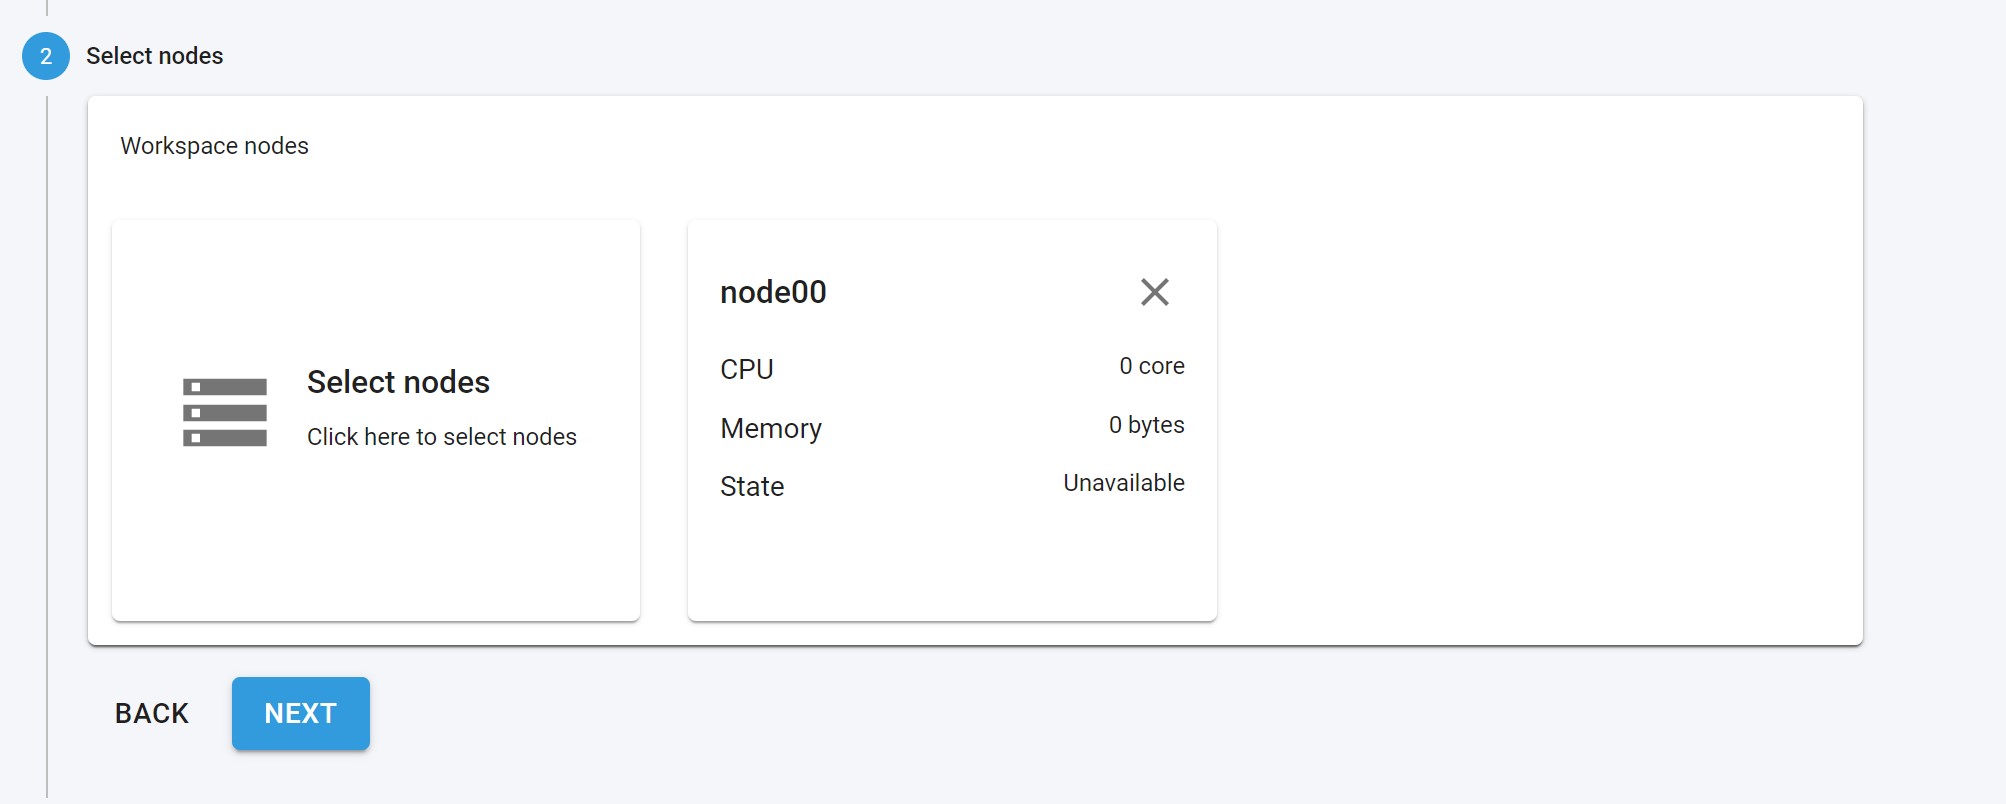
(我好像之前回報過) unavailable nodes should NOT be selectable!
Tracked in #4313
chia7712
on 10 Mar 2020
討論: Pipeline componet name 目前只能小寫與數字.
因為k8s對名稱有強烈要求,為了一致性所以讓所有物件都套用相同限制
chia7712
on 10 Mar 2020
確認一下,錯誤訊息跑到右上角是預期的行為嗎?
chia7712
on 10 Mar 2020
確認一下,錯誤訊息跑到右上角是預期的行為嗎?
Yep. This was recently changed in #4268 :)
konekoya
on 10 Mar 2020

欄位"c"跑版了
Tracked in #4306
chia7712
on 10 Mar 2020
欄位"c"跑版了
IIRC, the "latest column" will align field to right.
/cc @konekoya Am I right?
saivirtue
on 10 Mar 2020
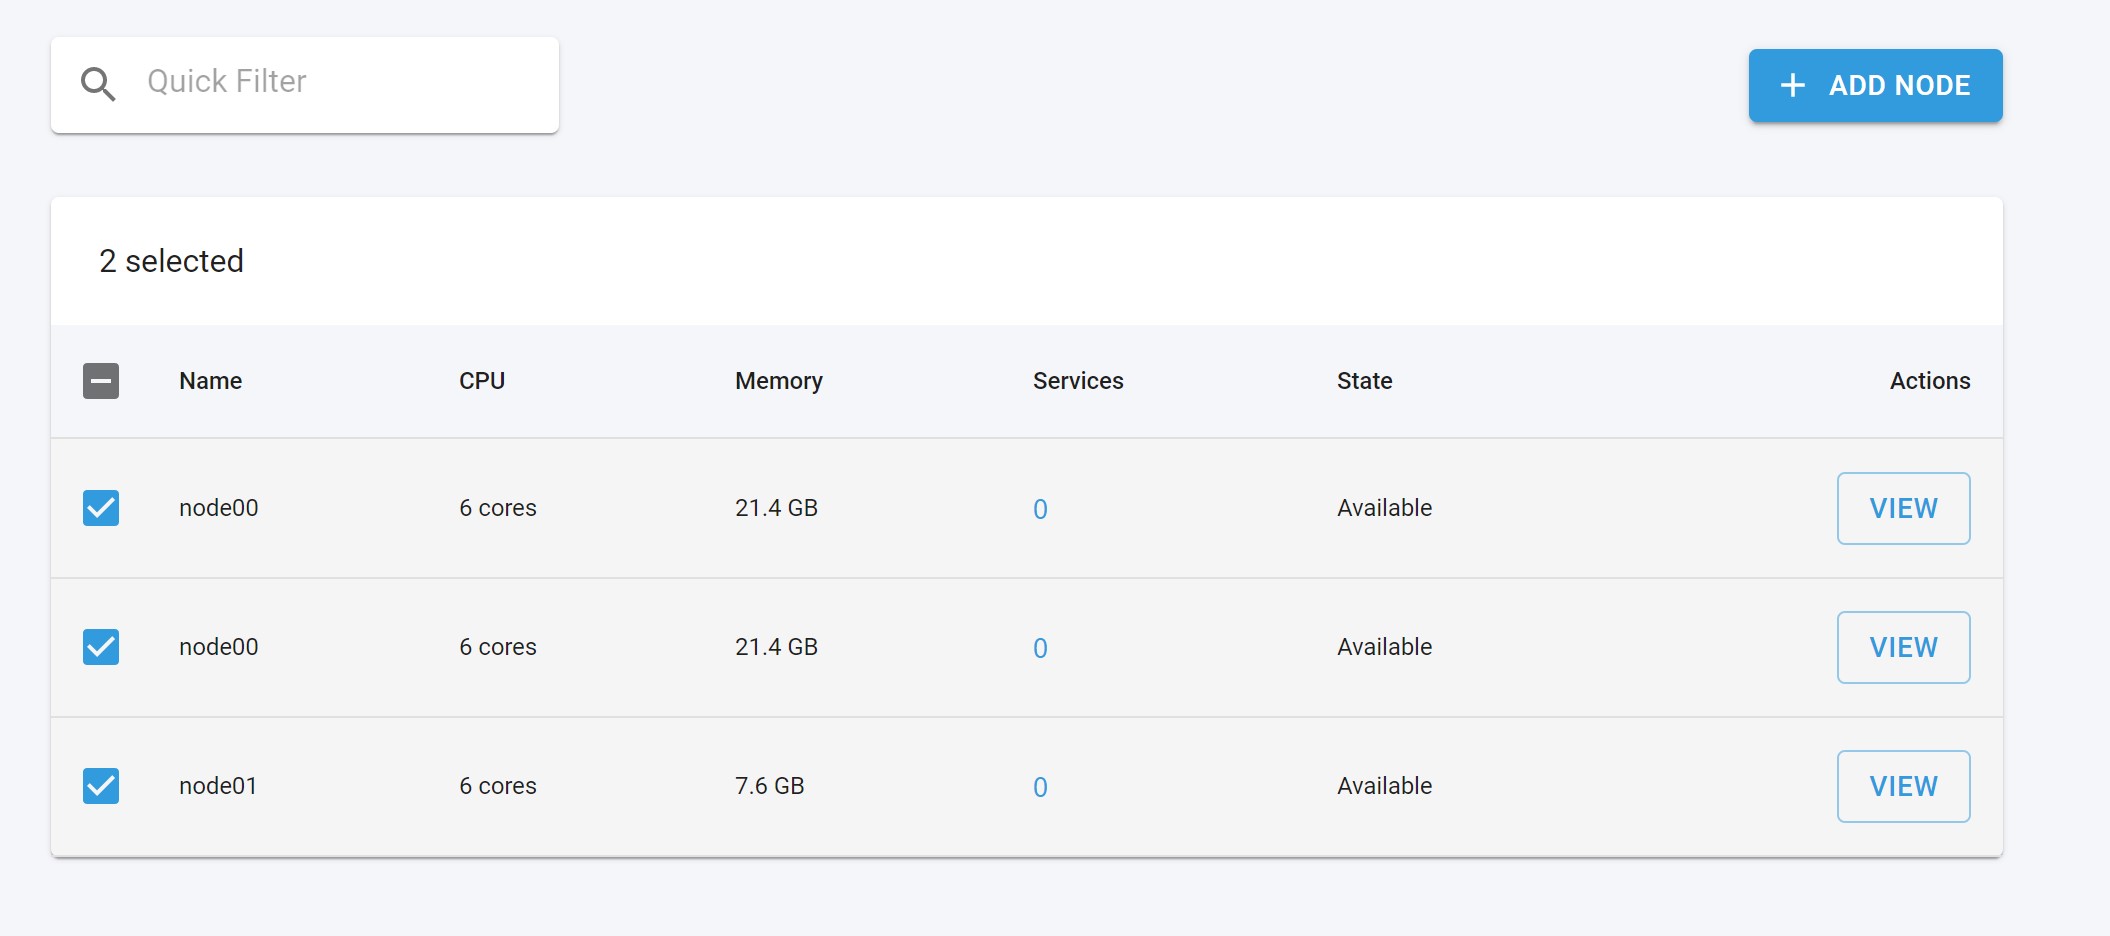
~應該要禁止加入重複的節點~
更正,該節點並沒有成功被加入到後端,不過畫面上卻有顯示...
補充,嘗試刪除"多出來的節點":
- 刪除本尊 -> 成功
- 刪除複製人 -> 失敗,因為刪除的按鈕不能按
chia7712
on 10 Mar 2020
FtpSource Connector 沒有顯示 Nodes 資訊
- 1 個 workspace, 只有一個 pipeline.
- FtpSource Connector(A) --> Internal topic(B) --> ConsoleSink(C)
- 填入參數, 啟動成功. 等待一會兒, 出現 Metrics Panel
- 上傳 csv file, 確認 A,C 的 metrics 有正確顯示
- 發現 C 有 Nodes 資訊, 但 A 沒有.
- 觀察 Response, API(/connectors) 裡 A 的 taskStatus 是空的, C 的 taskStatus 有值
tracked in #4303
vitojeng
on 10 Mar 2020
觀察 Response, API(/connectors) 裡 A 的 taskStatus 是空的, C 的 taskStatus 有值
connector.state有值嗎? 這可能是開connector成功,但開task的時候失敗。可以看一下worker logs
chia7712
on 10 Mar 2020
IIRC, the "latest column" will align field to right.
/cc @konekoya Am I right?
Right, but the cell data should also align to the right. I can submit a PR to fix this if you're busy with the API refactoring :)
konekoya
on 11 Mar 2020
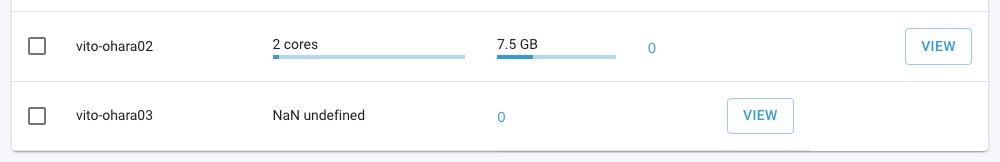
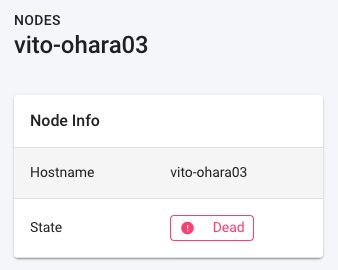
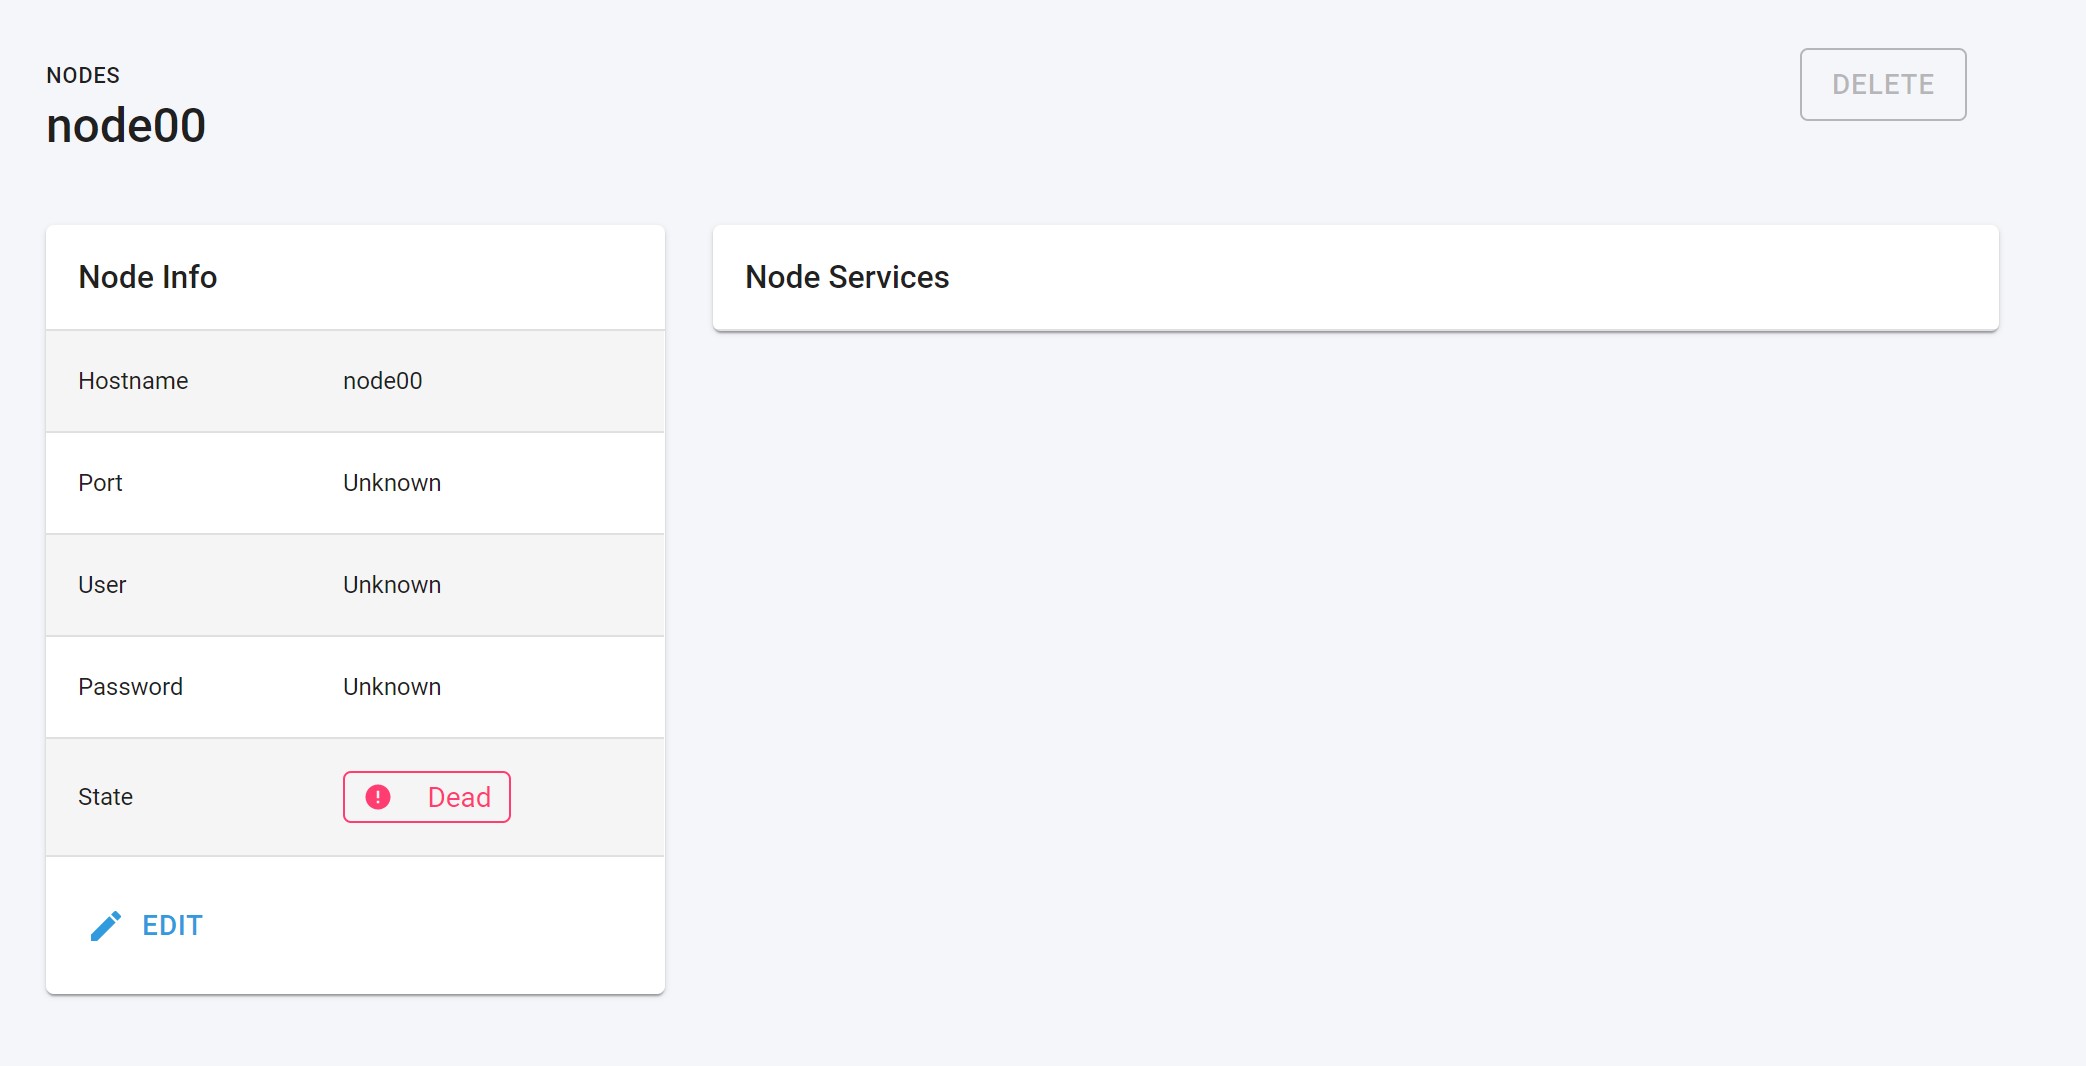
Node unavailable 時:
- CPU/Memory: NaN 應該顯示
-Fixed in #4313 - State: 應與其他地方一致, 顯示
Alive(綠色) orDead(紅色) #4368
vitojeng
on 11 Mar 2020
(我好像之前回報過) unavailable nodes should NOT be selectable!
@chia7712 Thanks for reporting, I will look into it today (for both node related issues) :)
konekoya
on 11 Mar 2020
CPU/Memory: NaN 應該顯示 -
@vitojeng This will be fixed in #4313 :)
konekoya
on 11 Mar 2020
前幾天有遇到, 現在又遇到...但重現不出來 QQ
updated: Due to multiple tasks of connector's metrics, not a bug
vitojeng
on 11 Mar 2020
更正,該節點並沒有成功被加入到後端,不過畫面上卻有顯示...
補充,嘗試刪除"多出來的節點":
刪除本尊 -> 成功
刪除複製人 -> 失敗,因為刪除的按鈕不能按
@chia7712 I'm unable to repro this. Adding two same name nodes is blocked by the APIs
konekoya
on 11 Mar 2020
I'm unable to repro this. Adding two same name nodes is blocked by the APIs
I will report this issue if I find a way to reproduce this bug :)
chia7712
on 11 Mar 2020
Node unavailable 時:
CPU/Memory: NaN 應該顯示 -
State: 應與其他地方一致, 顯示 Alive(綠色) or Dead(紅色)
@oharastream/frontend Is there a issue ?
chia7712
on 18 Mar 2020
CPU/Memory: NaN 應該顯示
Fixed in #4313 :)
State: 應與其他地方一致, 顯示 Alive(綠色) or Dead(紅色)
Tracked in #4368
konekoya
on 18 Mar 2020
all issues are resolved so close this issue now.
feel free to raise issue on #3019
FYI @oharastream/developer
chia7712
on 18 Mar 2020
Related issues
konekoya
·
3Comments
chia7712
·
4Comments
 HarryChiang143
·
3Comments
jackyoh
·
4Comments
wu87988622
·
3Comments
HarryChiang143
·
3Comments
jackyoh
·
4Comments
wu87988622
·
3Comments
Most helpful comment
all issues are resolved so close this issue now.
feel free to raise issue on #3019
FYI @oharastream/developer