Office-js: Outlook add-in dialog memory leak
In the latest desktop client version of Outlook for Windows (see version info below), calling the dialog.close method seems to be causing (or linked to) a memory leak. We have spent significant time working on isolating and reproducing the issue, which can be observed in dev tools in various third-party add-in applications as well as our own.
Since our application relies on communication between the dialog and the task pane, we find this to be a serious problem for our users, who will experience slow-downs and warning messages if the dialog is opened and closed repeatedly. The problem is only present in the newer Edge-backed version of Outlook (see version info below), not the previous versions, which ran on IE.
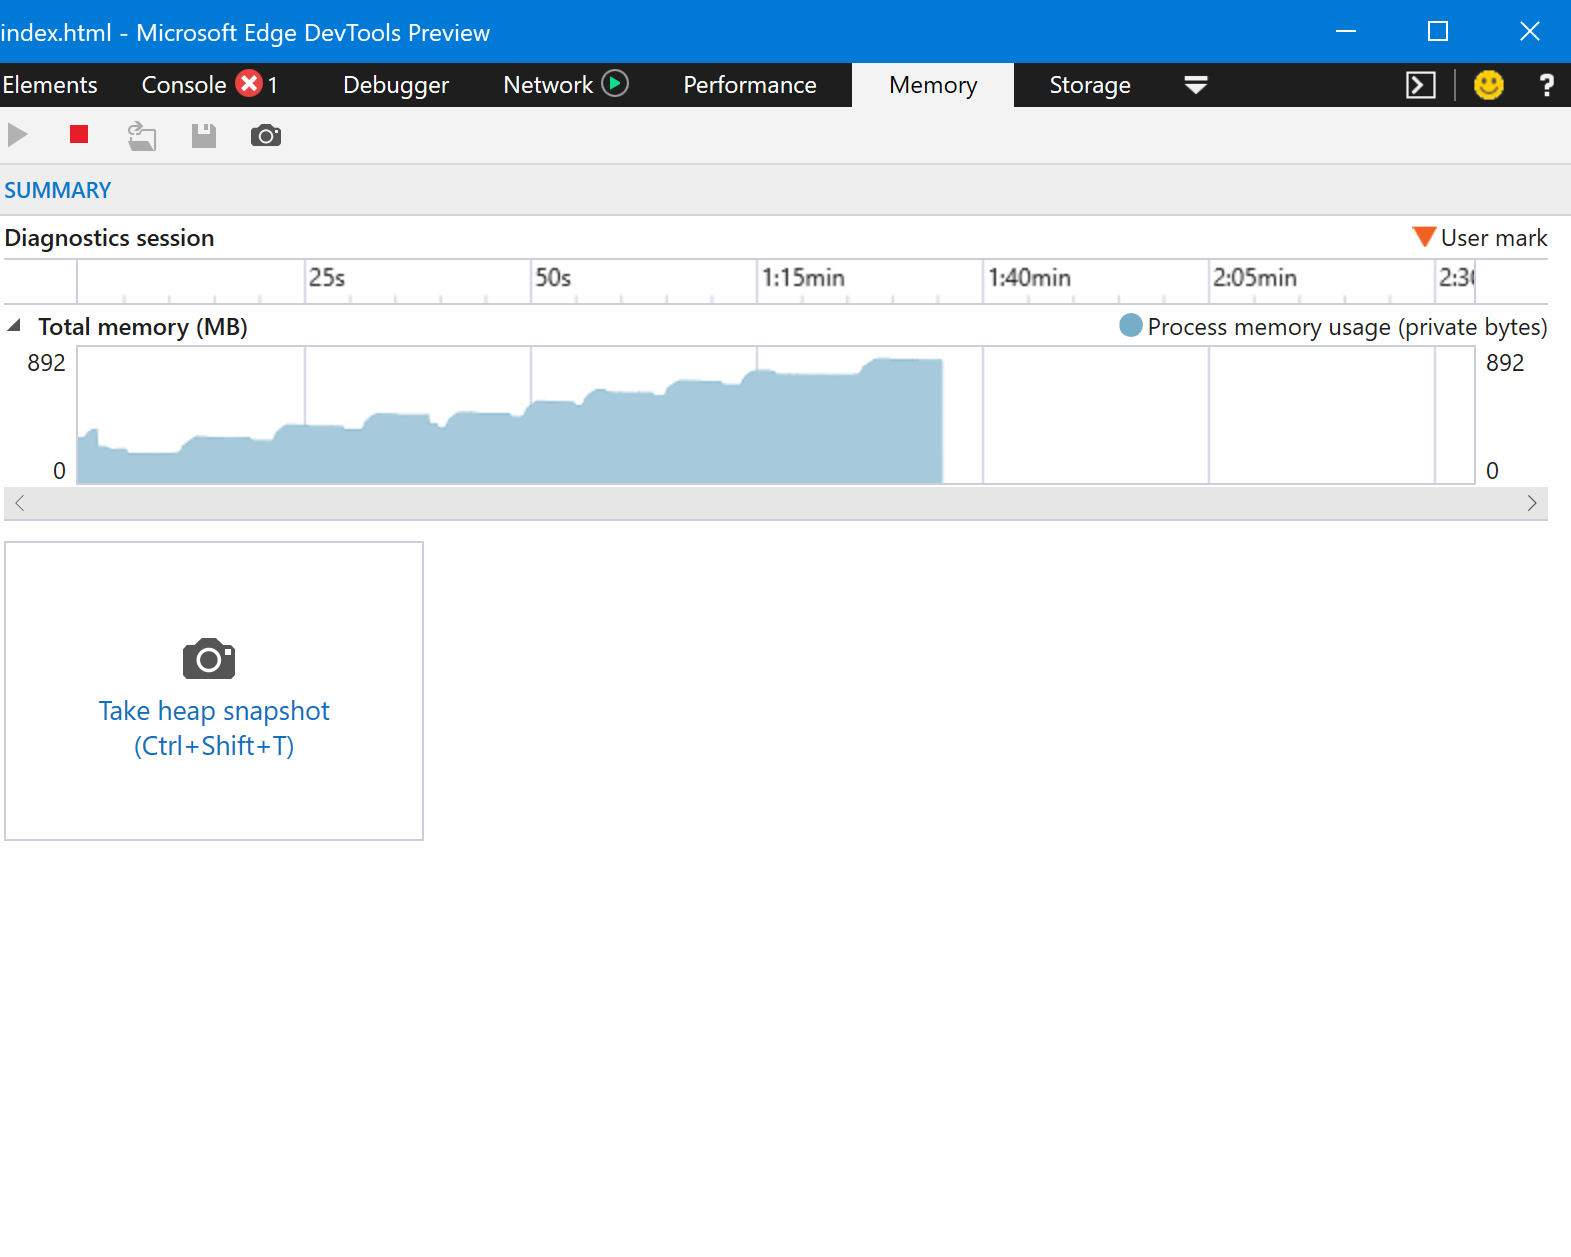
Memory profile in our application after opening and closing dialog eight times:
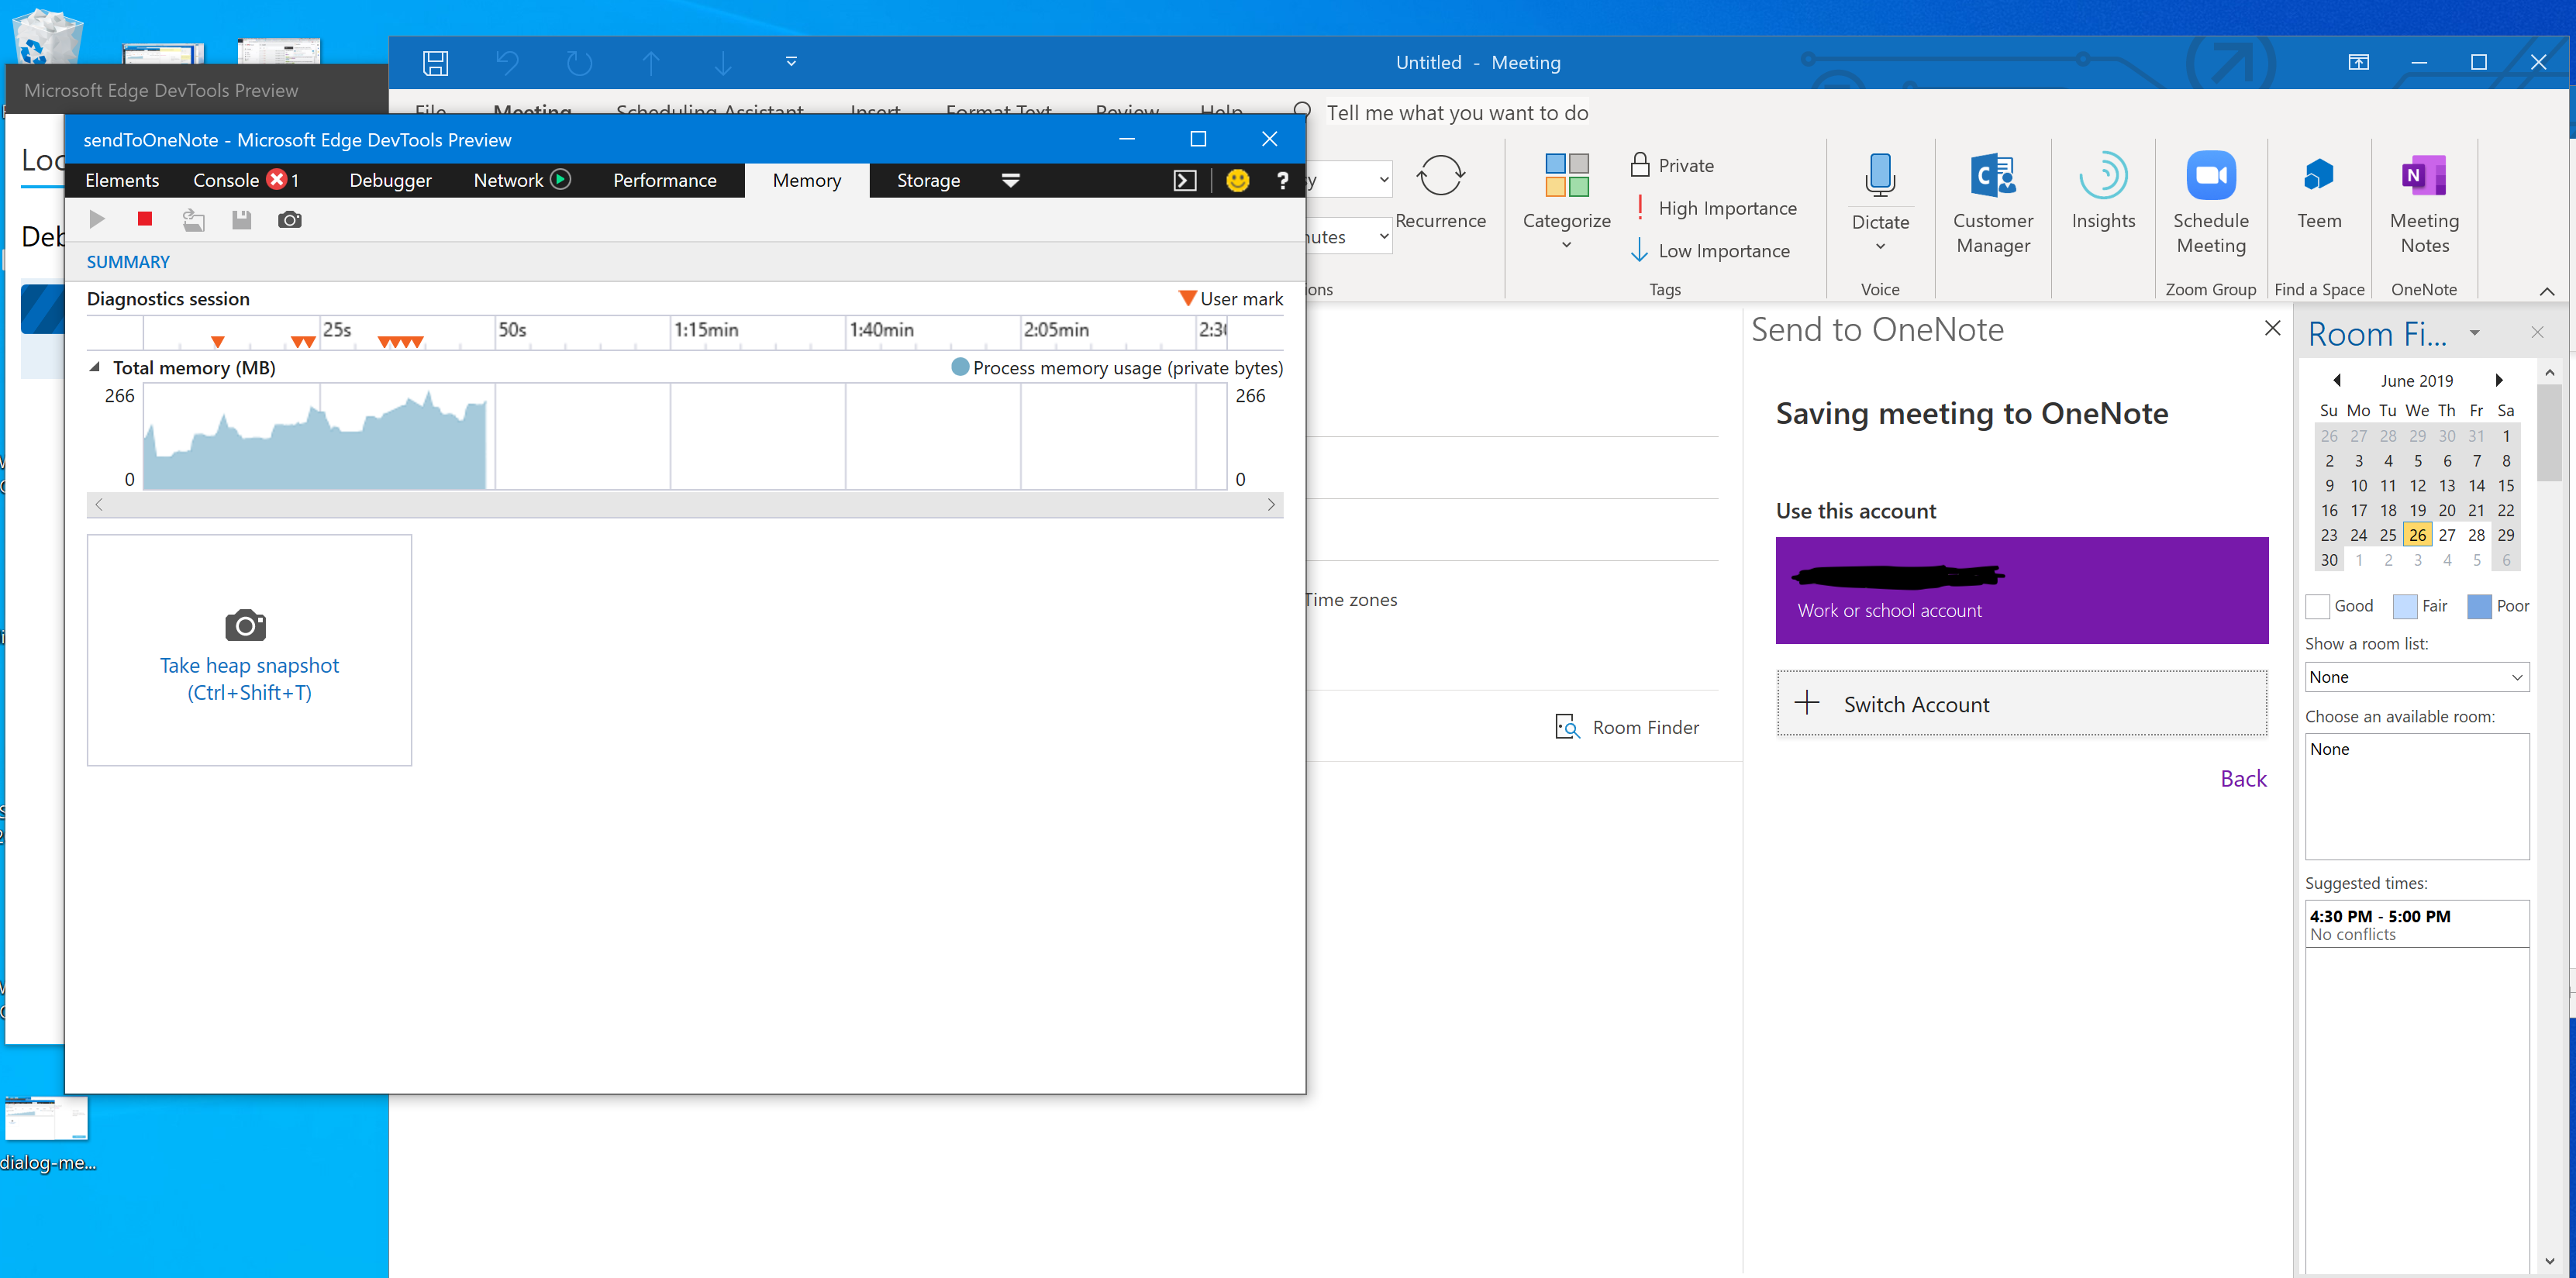
Memory profile in Send To One Note after opening authentication dialog three or four times:
Expected Behavior
When closing the dialog, memory allocation should return to the level the that it was at before the user opened the dialog.
Current Behavior
Closing the dialog by calling dialog.close() on the dialog instance returned from Office.context.ui.displayDialogAsync does not seem to disallocate the memory apportioned to it.
This behavior is not present if the user clicks the “X” button in the upper-right of the dialog, but only occurs when we call dialog.close() on the dialog instance.
Steps to Reproduce, or Live Example
- Open Outlook desktop client for Windows.
- Create a new message or new appointment and load add-in.
- Open developer tools and start profiling the memory for the add-in.
- Open a dialog from the add-in.
- Close the dialog in a way that calls
dialog.close()— not via the “X” in the upper-right-hand corner. In Send To OneNote you can do this by clicking on a user account inside the authentication dialog, rather than closing it.
If you have trouble reproducing with these steps, I can build a simple add-in application for demonstration purposes.
Context
This issue will have a negative impact on our users because it causes the add-in to slow down and eventually displays an alarming yellow warning.
Your Environment
- Platform [PC desktop, Mac, iOS, Office Online]: PC desktop
- Host [Excel, Word, PowerPoint, etc.]: Outlook
- Office version number: Version 1906 (Build 11727.20210)
- Operating System: Windows 10 Version 1903 for x64
Useful logs
- [ ] Console errors
- [X] Screenshots
- [ ] Test file (if only happens on a particular file)
 nathandpeterson
All 26 comments
@nathandpeterson sorry to hear that you're experiencing this issue; thank you for reporting it and providing such detailed information.
@jargil FYI, since this issue seems related to EdgeWeb view, I've assigned it to you for investigation. Please let me know if you're not the right person to investigate.
 kbrandl
on 1 Jul 2019
kbrandl
on 1 Jul 2019
@kbrandl @jargil Any update on this? I am happy to provide more context if you are having trouble with repro.
nathandpeterson
on 16 Jul 2019
@nathandpeterson thanks for the ping about this, and apologies for the delayed response.
@jargil are you the right person to investigate this issue, or should it be assigned to someone else?
kbrandl
on 16 Jul 2019
@kbrandl @jargil I went ahead and created a repo that can be used to recreate the memory leak: https://github.com/nathandpeterson/dialog-memory-leak. I deployed a simple add-in that simply opens and closes a dialog and I'm still seeing the memory problem in Edge Webview.
The relevant code that seems to be causing the problem is here:
Office.context.ui.displayDialogAsync(
    DIALOG_URL,
    { height: 30, width: 20, displayInIframe: true },
    (asyncResult) => {
      if(asyncResult) {
        const dialog = asyncResult.value

        function processMessage(arg) {
          var messageFromDialog = JSON.parse(arg.message);
          if(messageFromDialog.dialog === false) {
            dialog.close()
          }
        }
        dialog.addEventHandler(Office.EventType.DialogMessageReceived, processMessage);

      } else {
        console.error('asyncResult failed check', asyncResult)
      }
    }
   )
I would appreciate any update on whether you have been able to recreate this issue. Thanks so much.
nathandpeterson
on 24 Jul 2019
@nathandpeterson thanks for providing this repro info.
@jargil can you investigate this issue, or should it go to someone else?
kbrandl
on 24 Jul 2019
Thanks for reporting, looking into this.
 jargil
on 25 Jul 2019
jargil
on 25 Jul 2019
@nathandpeterson - Edge's dev tools chart is a bit misleading with regards to how much the actual runtime process is consuming. Have you looked at the process private working set? I'm seeing the privates bytes getting consistently freed. Also please take a couple of heap snapshots to see comparisons, I'm not seeing much difference, perhaps a few Bytes difference.
jargil
on 27 Jul 2019
@jargil Thanks for taking a look. I should have mentioned earlier that the main reason why we are concerned about this leak is the yellow banner that pops up when an add-in "uses too much memory." We've seen this banner both in our application and in other production add-ins. For example, take a look at Send To One Note:
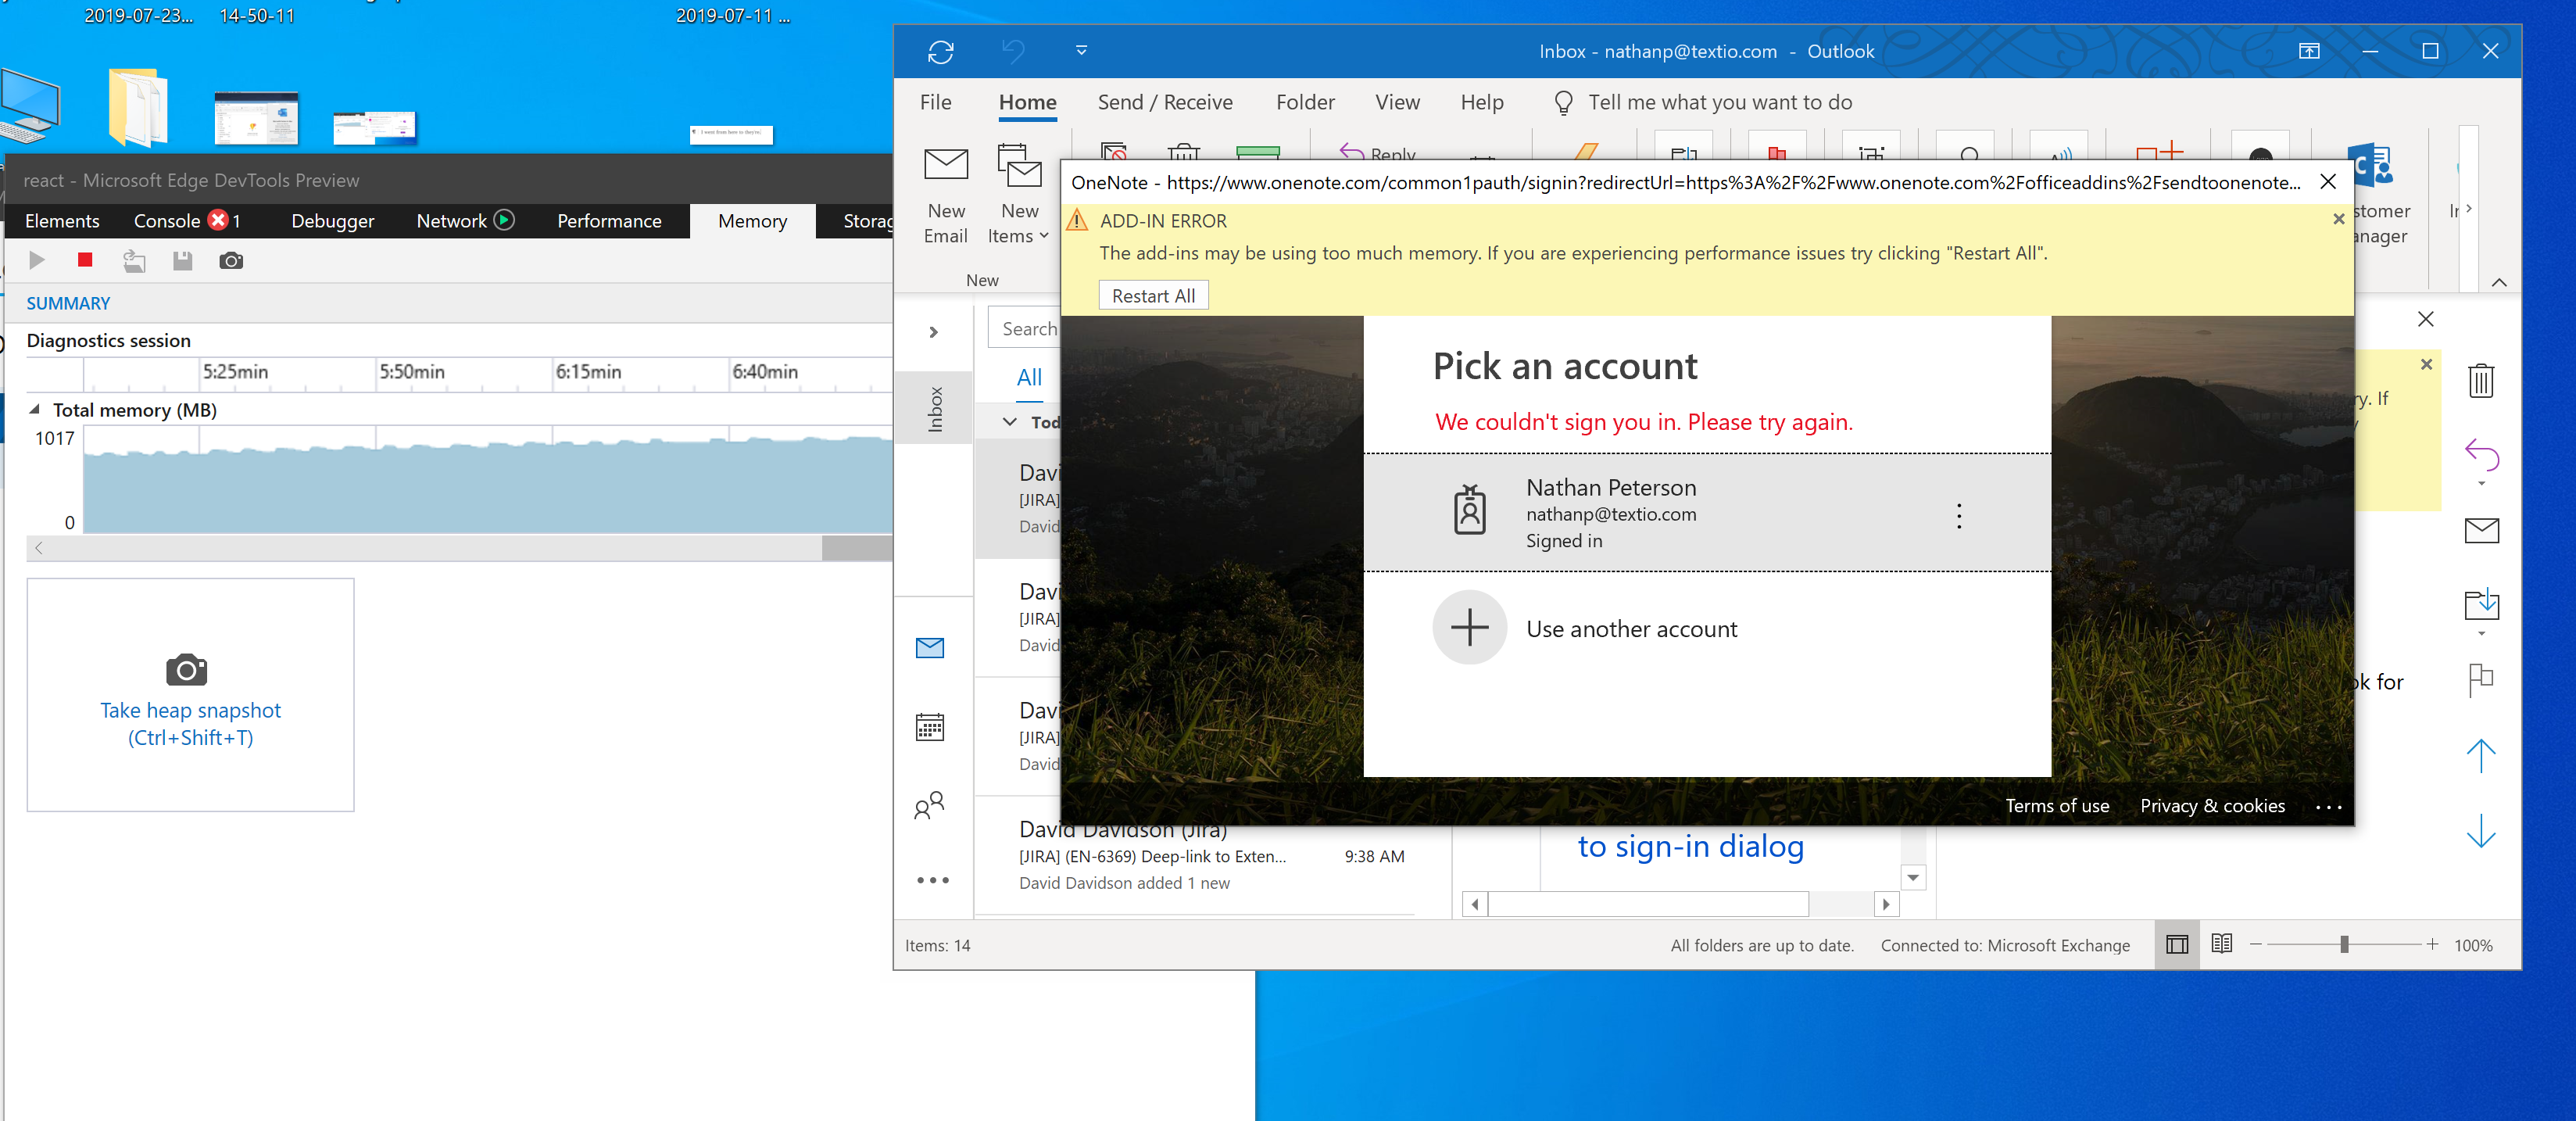
I got this banner by opening and closing the auth dialog 50-60 times. I realize that this is not realistic user behavior. Nevertheless, our application makes non-trivial use of the dialog and we are able to trigger the same banner after opening the dialog 8-10 times:
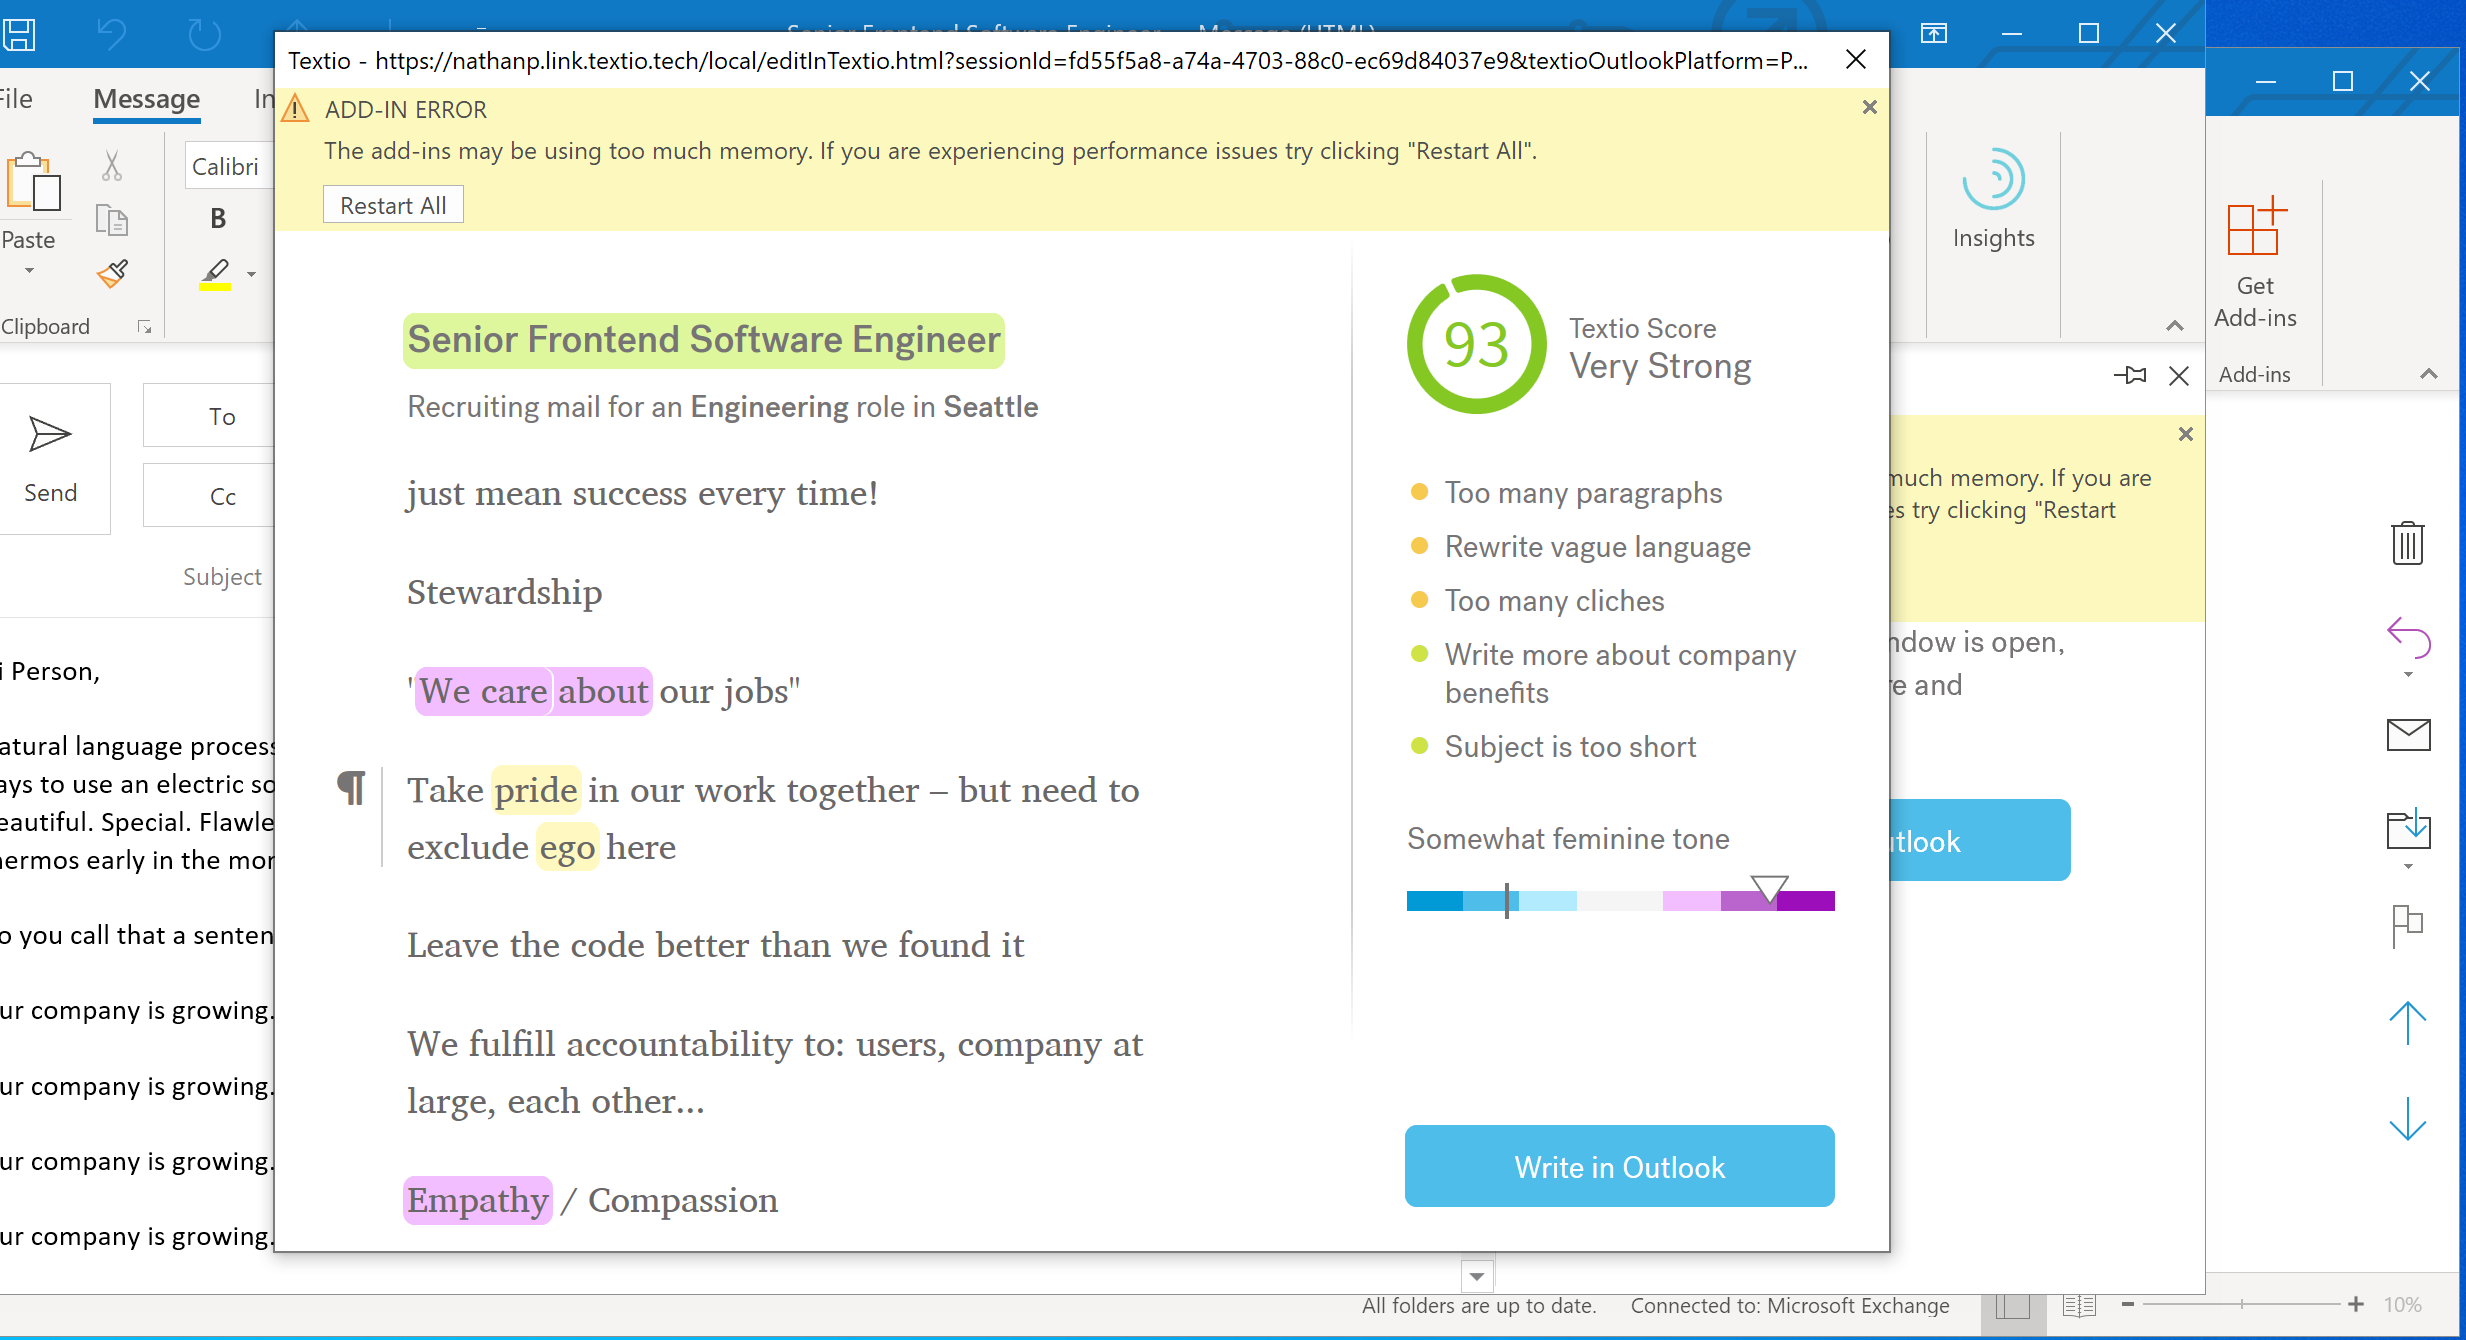
In our application, it is expected behavior that users will open and close the dialog some number of times more than two or three, so we are very concerned about the warning banners that Outlook is putting on the add-in. I realize that the repo (https://github.com/nathandpeterson/dialog-memory-leak) that I linked in my comment above has a much smaller allocation but the same upward trend of memory can be seen at a much smaller scale (using the Edge devtools).
Edit: I looked at some heap snapshots. As you suggest, the snapshot profile does not reveal anything on the scale of what the Edge tools is showing. Yet we are still seeing yellow banners when dialogs are opened and closed repeatedly.
nathandpeterson
on 31 Jul 2019
@nathandpeterson - thanks for the additional information! When you get that yellow bar, could you share a quick snapshot of how much memory your system has total (RAM), how much available, and how much the wwahost.exe process associated to add-ins is consuming for both shared and private working set (you can get the pid from the Edge DevTools)? When we show the yellow bar it means you're running low in memory overall in your system, and we're seeing that wwahost.exe is a big contributor to that. I'll look further here.
jargil
on 2 Aug 2019
@jargil I'm attaching some screenshots below:
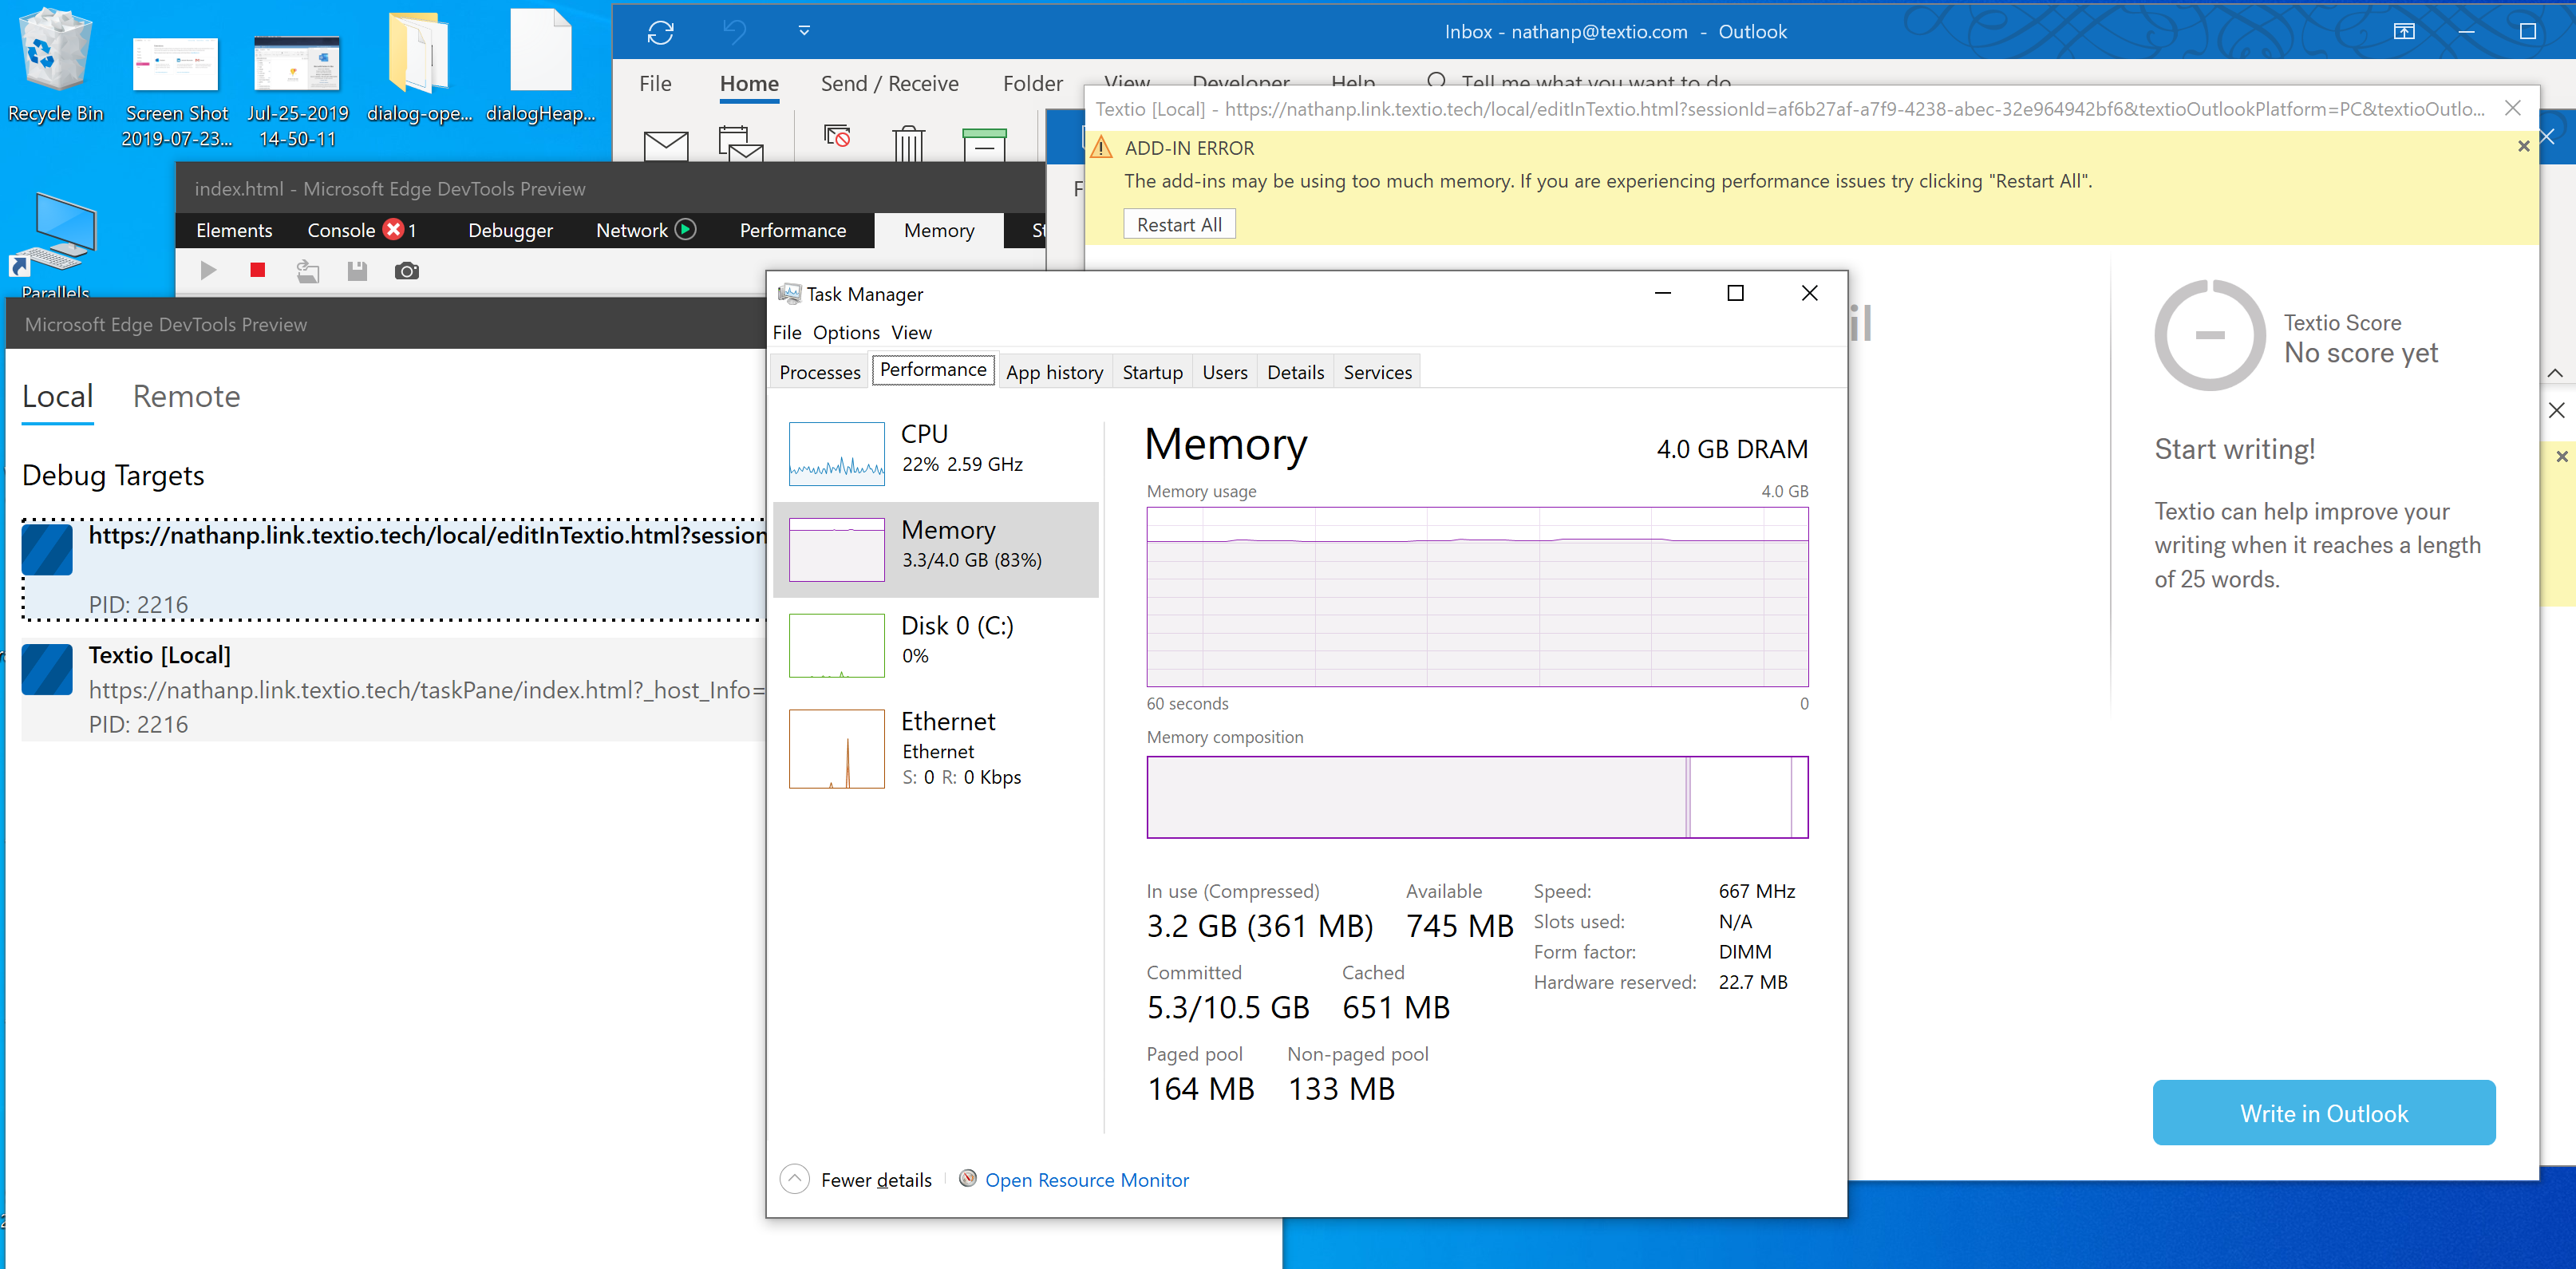
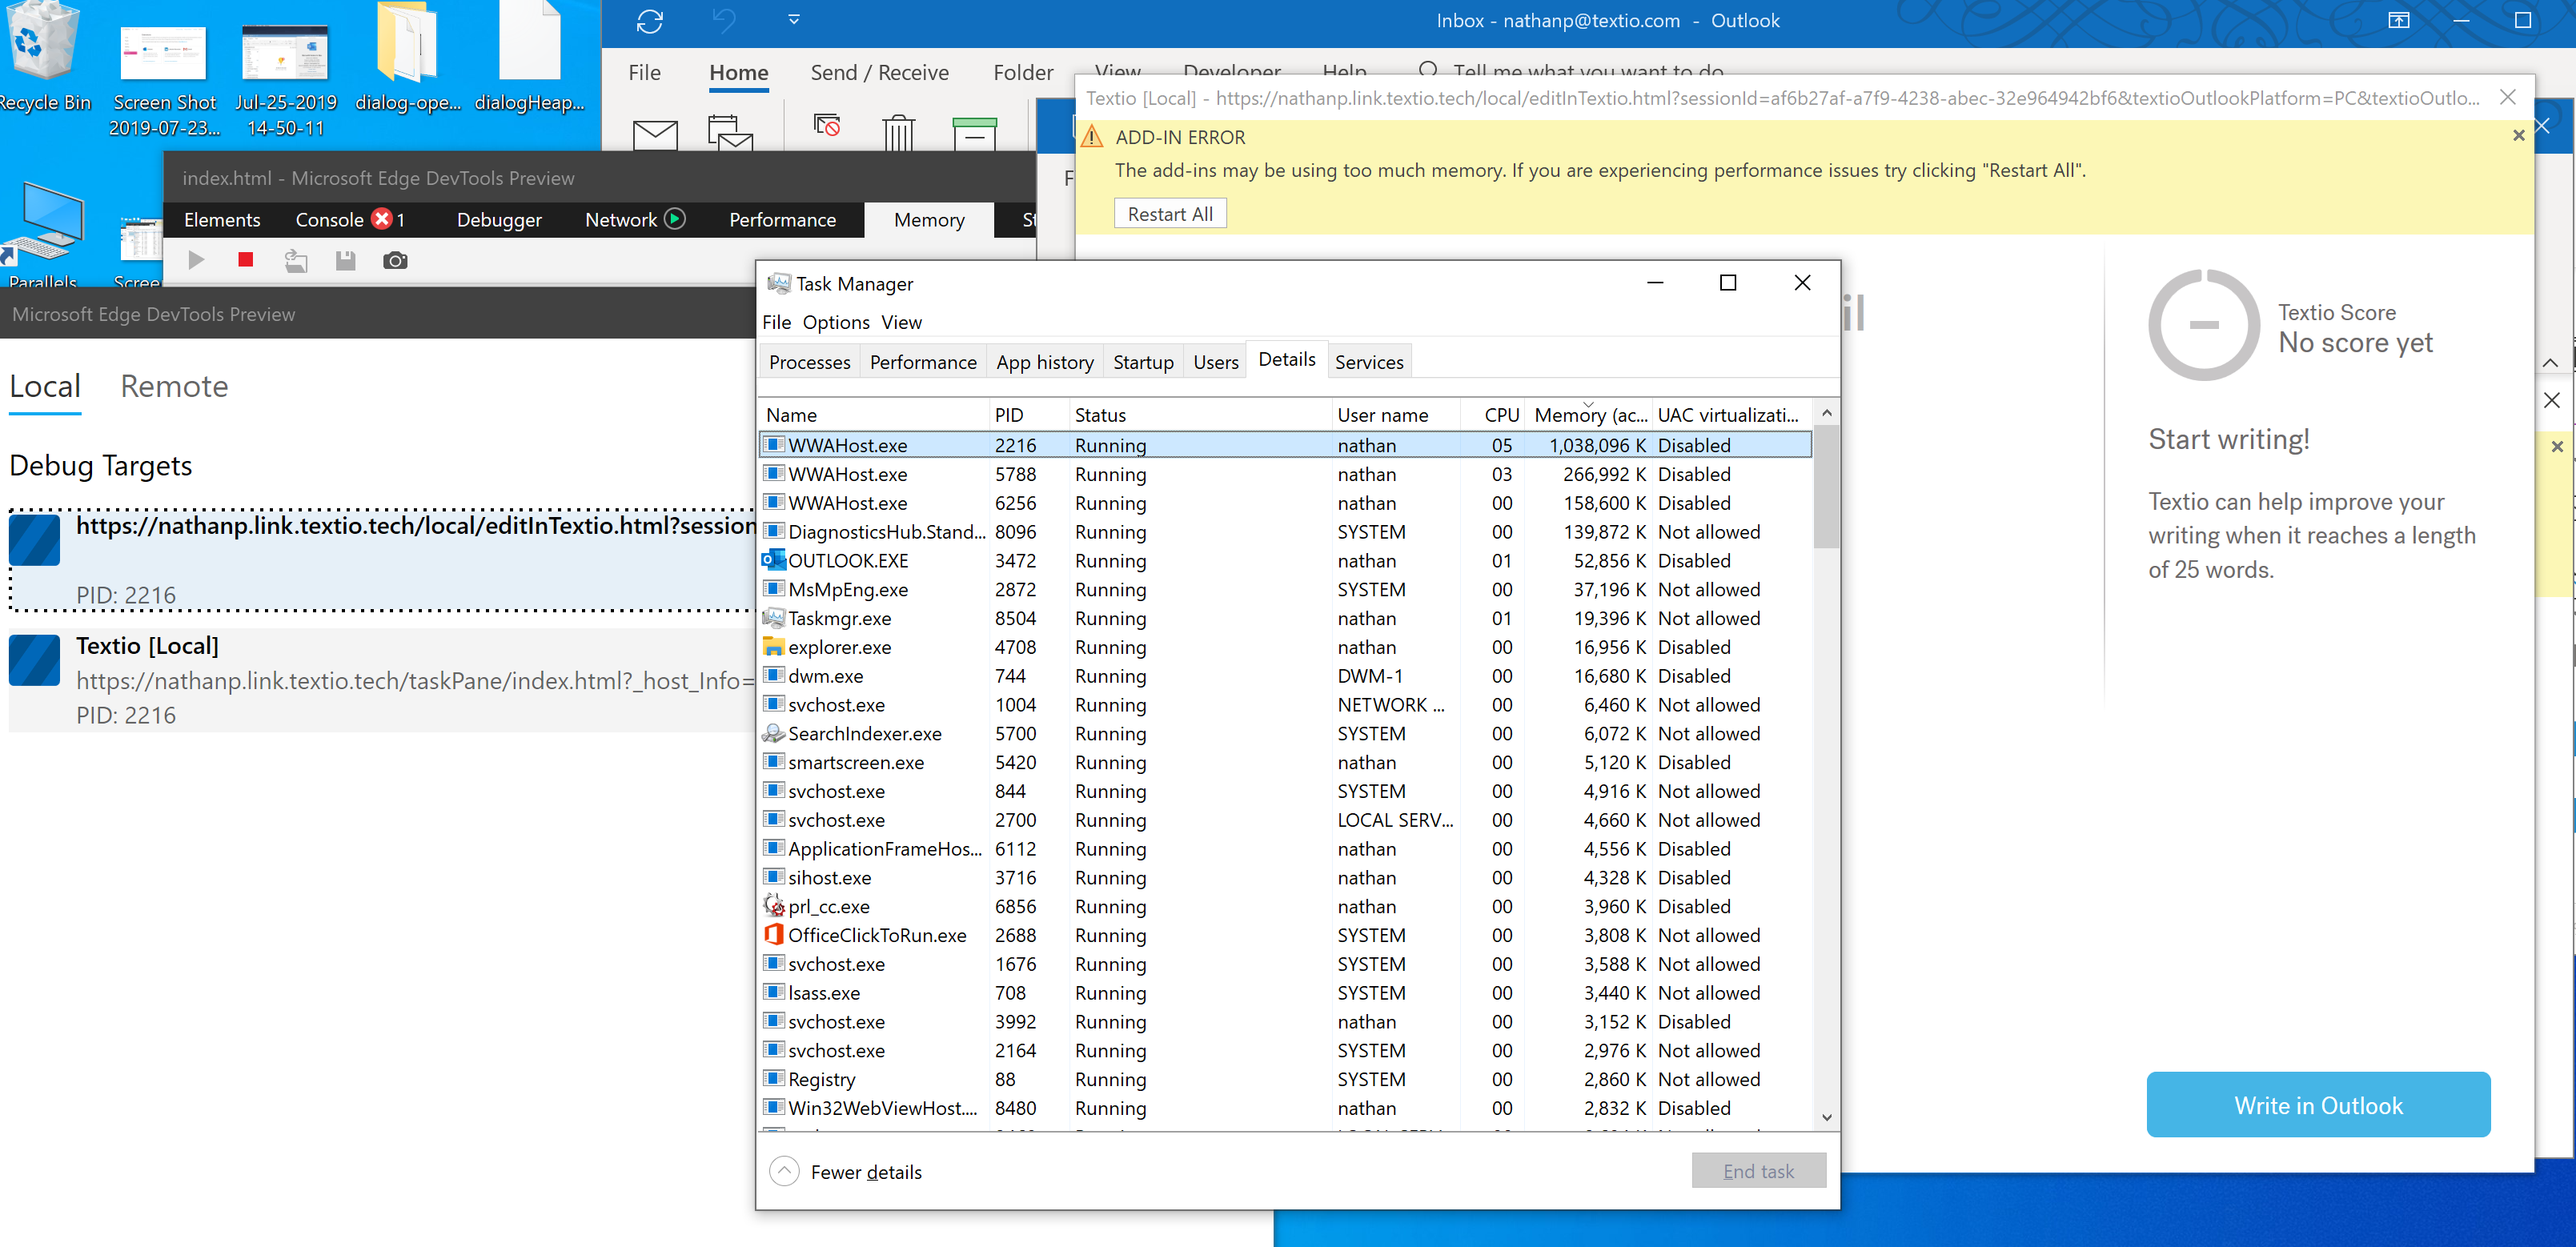
I see what you are talking about with wwahost.exe as contributor to this problem. Is there another profiling tool that you would recommend to get a more finely grained snapshot of shared and private working set? Thanks again.
nathandpeterson
on 3 Aug 2019
Adding my voice to the issues reported here: I am seeing the same thing. It does appear to be due to WWAHost.exe not releasing memory - and it is not just due to the usage of the Dialog API.
My clients open and close Word multiple times a day, and we are noticing that WWAHost.exe both survives the Word closure and seems to increase in memory usage as each instance of our add-in is opened.
We are also seeing Word itself seeming to hang after closing the dialog window (either directly via the red 'X' or programmatically via dialog.close from the taskpane). We cannot get Word to respond to any actions, including bring-to-front.
EDIT: If I kill WWAHost.exe, it is restarted and Word becomes responsive again.
This all does seem related to the large amount of memory being kept by WWAHost.exe.
 TheSamsterZA
on 5 Aug 2019
TheSamsterZA
on 5 Aug 2019
@nathandpeterson - when you load your html/js directly to Edge how much memory is using?
@TheSamsterZA - I believe you're in Office Insider? Could you confirm your Office build number? I believe we have already published the fix for the hang you comment and I want to confirm if you have the proper build to test.
jargil
on 5 Aug 2019
@jargil Here is my updated list of versions:
Platform: PC Desktop
Host: Word
Office version number: Word 2016 for Windows Version 1909 (Build 12001.20000 Click-to-Run), Office Insider
Operating System: Windows 10 Version 1903 (OS Build 18362.239)
I am still seeing the hang - but it does seem to take longer to happen. I see it after ~5 dialogs are opened, then closed. WWAHost.exe looks like it's stuck (CPU usage ~30% continuously).
Please let me know if you need more info.
TheSamsterZA
on 6 Aug 2019
I don't know whether this is root cause or not but i found serious memory leak inside Web control <-> OfficeJS internal API marshaling code.
Each asynс call to Web control host leaks callback function. This is true either for oneoff calls or event registrations. See code below, you can find it in "eval" debugger section (Office injects it using AddInitializeScript API):
window.external.UnregisterEvent = function (id, target, callback) {
    var agaveResponseCallback = function (payload) {
        if (callback) {
            return callback(new WebViewSafeArray(payload));
        }
    };
    var parameters = {
        methodId: 3,
        params: {
            id: parseInt(id),
            targetId: target
        },
        callbackFunction: "agaveHostCallback",
        callbackId: registerFunction(agaveResponseCallback)
    };
    window.external.proxy.notify(JSON.stringify(parameters));
};
window.agaveHostEventCallback = function (callbackId, payload) {
    if (eventHandlerList[callbackId]) {
        try {
            eventHandlerList[callbackId](JSON.parse(payload));
        } catch (e) { }
    }
};
window.agaveHostCallback = function (callbackId, payload) {
    if (callbackList[callbackId]) {
        try {
            callbackList[callbackId](JSON.parse(payload));
        } catch (e) { }
    }
};
Each agaveHostCallback call doesn't remove callback from callbackList array.
This is unacceptable bug for production and must be fixed ASAP. Looks very close to the root cause of the bug posted here.
@kbrandl FYI
 vputsenko
on 6 Aug 2019
vputsenko
on 6 Aug 2019
@jargil You asked
when you load your html/js directly to Edge how much memory is using?
I'm a little unclear on what you are asking. Since we don't usually load html/js directly to Edge (without Office), I cannot easily test the memory usage in isolation. That said, I did create a tiny little add-in to show that the issue that concerns me is not the _size_ of the memory allocation but the pattern over time. It seems that others are having this problem as well. Please let me know if I can provide any other information that might be valuable in helping to get to the root cause of the leak.
nathandpeterson
on 6 Aug 2019
@nathandpeterson - I definitely understand there's a problem you're getting into where this memory error is being reported after opening the dialog multiple times. I've opened a bug in our internal bug database to track this.
Additionally, this is a good document that explains a bit better how Office monitor memory and CPU usage:
https://docs.microsoft.com/en-us/office/dev/add-ins/concepts/resource-limits-and-performance-optimization
@TheSamsterZA - thanks for the info, that's useful.
@vputsenko - thanks for pointing that out. That was definitely a miss that I've just addressed.
jargil
on 13 Aug 2019
@jargil Thanks again for looking into this. I took a look at the link that you sent, which makes it clear that the yellow banner reflects memory consumption as a percentage of total available system resources. Are these values available through the Office.js api? It would be helpful if we could log how often our users are hitting this issue.
You also mentioned that you addressed a fix to the issue that @vputsenko identified. Is that fix in production now? If not, do you have a timeline? I'm curious to see if it is related to our issue. Thanks.
nathandpeterson
on 14 Aug 2019
@nathandpeterson - They're not available through Office.js. Search here to see if someone else had suggested this such API, else feel free to suggest it:
https://officespdev.uservoice.com/
For the other fix you ask about, Office build 16.0.12013 or newer should have it already.
jargil
on 14 Aug 2019
Update:
While it appears that the memory consumption issue has been resolved, I am still seeing on an intermittent basis Word seeming to hang after closing the dialog window (either directly via the red 'X' or programmatically via dialog.close from the taskpane). I cannot get Word to respond to any actions, including bring-to-front.
WWAHost.exe looks like it's stuck (CPU usage ~30% continuously). If I kill WWAHost.exe, it is restarted and Word becomes responsive again.
@jargil Do you perhaps have any idea what could be happening here?
Platform: PC Desktop
Host: Word
Office version number: Word 2016 for Windows Version 1910 (Build 12105.20000 Click-to-Run), Office Insider
Operating System: Windows 10 Version 1903 (OS Build 18362.295)
TheSamsterZA
on 13 Sep 2019
I see the fix in Outlook version 1908 (Build 11929.20300 Click to Run) which is available in monthly channel. New code looks like:
window.external.UnregisterEvent = function(id, target, callback) {
    var agaveResponseCallback = function(payload) {
        if (callback) {
            return callback(new WebViewSafeArray(payload));
        }
    };
    var parameters = {
        methodId: 3,
        params: {
            id: parseInt(id),
            targetId: target
        },
        callbackFunction: "agaveHostCallback",
        callbackId: registerFunction(agaveResponseCallback)
    };
    window.external.proxy.notify(JSON.stringify(parameters));
    for (var key in eventHandlerList) {
        if (eventHandlerList.hasOwnProperty(key)) {
            var eventCallback = eventHandlerList[key];
            if (eventCallback.id == id && eventCallback.target == target) {
                delete eventHandlerList[key];
            }
        }
    }
};
window.agaveHostEventCallback = function(callbackId, payload) {
    var eventHandler = eventHandlerList[callbackId];
    if (eventHandler) {
        try {
            eventHandler.handler(JSON.parse(payload));
        } catch (e) {}
    }
};
window.agaveHostCallback = function(callbackId, payload) {
    var callback = callbackList[callbackId];
    if (callback) {
        try {
            var done = callback(JSON.parse(payload));
            if (done === undefined || done === true) {
                delete callbackList[callbackId];
            }
        } catch (e) {}
    }
};
So callbacks are now deleted.
vputsenko
on 25 Sep 2019
Possibly related. I've noticed that if I'm developing an add-in with a Dialog and working with the add-in a lot, opening and closing dialogs, eventually, the login dialog will start to flicker and seem to reload itself over and over. When this happens, I see in Task Manager that there are many Desktop App Web Viewer processes using a great deal of memory. Closing them all fixes the problem.
 Rick-Kirkham
on 26 Sep 2019
Rick-Kirkham
on 26 Sep 2019
One more thing here. Even when we have that fix, i think that still memory leak is possible there:
var done = callback(JSON.parse(payload));
            if (done === undefined || done === true) {
                delete callbackList[callbackId];
            }
if callback returns false then what? Host (Outlook) knows nothing about the result so it will not call agaveHostCallback again and in this case callback will still live forever... IMHO it should be deleted anyway.
@jargil What do you think?
vputsenko
on 26 Sep 2019
@vputsenko - APIs that support batching return false until eventually their work is complete. Office.js takes care of returning false/true.
@TheSamsterZA - I'll try to repro. Is there a particular add-in you're using where you see these hangs? LEAP Mail?
jargil
on 27 Sep 2019
@jargil This appears to be an issue on Word, not Outlook.
You can try to replicate by following these steps:
- Install the LEAP Document Manager from AppSource and run it. You should see a Welcome Screen.
- Click on the LEAP Document Manager heading on the top left of the taskpane (next to the icon). A Debug Tools dropdown should appear.
- Pick either the Log Viewer or the Custom XML Part Editor. A dialog should open.
- Close the dialog, either by clicking on the Close button or by clicking the red X on the top right.
- Repeat steps 3 and 4 until it appears that Word is frozen (~15 dialogs).
- On Task Manager, look at Desktop App Web Viewer on the Processes tab, or WWAHost.exe on the Details tab. It should be stuck at ~30% CPU usage.
- Kill the offending WWAHost.exe and notice, the add-in restarts and Word is responsive again.
Please let me know if you need anything further.
Platform: PC Desktop
Host: Word
Office version number: Word 2016 for Windows Version 1910 (Build 12119.20000 Click-to-Run), Office Insider
Operating System: Windows 10 Version 1903 (OS Build 18362.356)
TheSamsterZA
on 27 Sep 2019
We made multiple fixes, at this point I cannot reproduce anymore. Let us know if you're still having this problem.
Thank you for reporting this!
jargil
on 30 Jul 2020
@jargil That's great news, thank you!
Do you perhaps have a version of Office that contains these fixes? Do I need to be on Office Insider at this point to receive them?
Thanks again for your hard work and commitment to fixing these issues, it is much appreciated. 😄
TheSamsterZA
on 30 Jul 2020
Related issues
 tido-ms
·
3Comments
tido-ms
·
3Comments
 gordonmleigh
·
3Comments
gordonmleigh
·
3Comments
 dgrudenic
·
4Comments
dgrudenic
·
4Comments
 Jarch09
·
3Comments
Jarch09
·
3Comments
 mattblackdev
·
4Comments
mattblackdev
·
4Comments
Most helpful comment
Thanks for reporting, looking into this.