Node: memory leak starting with node v11.0.0-nightly20180908922a1b03b6
- Version: node v11.0.0-nightly20180908922a1b03b6 and all subsequent releases
- Platform: Linux fd989fc725a7 4.15.0-1031-aws #33-Ubuntu SMP Fri Dec 7 09:32:27 UTC 2018 x86_64 GNU/Linux
- Subsystem:
uname reports the host container but the application is running in a docker container, from /etc/os-release:
PRETTY_NAME="Debian GNU/Linux 9 (stretch)"
NAME="Debian GNU/Linux"
VERSION_ID="9"
VERSION="9 (stretch)"
ID=debian
The leak also occurs running alpine 3.9.4 in a container. I have not been able to reproduce it outside of a docker container running on a native ubuntu 18.04 machine.
I am looking for some guidance on steps I can take to help narrow this down; I don't believe that the information I currently have is enough to isolate the problem.
The situation occurs running a memory/cpu benchmark of a todo application instrumented by our APM product. The APM product comprises JavaScript, a C/C++ library, and C++ code that uses the node-addon-api. The todo application is derived from todomvc-mongodb and runs express and mongo.
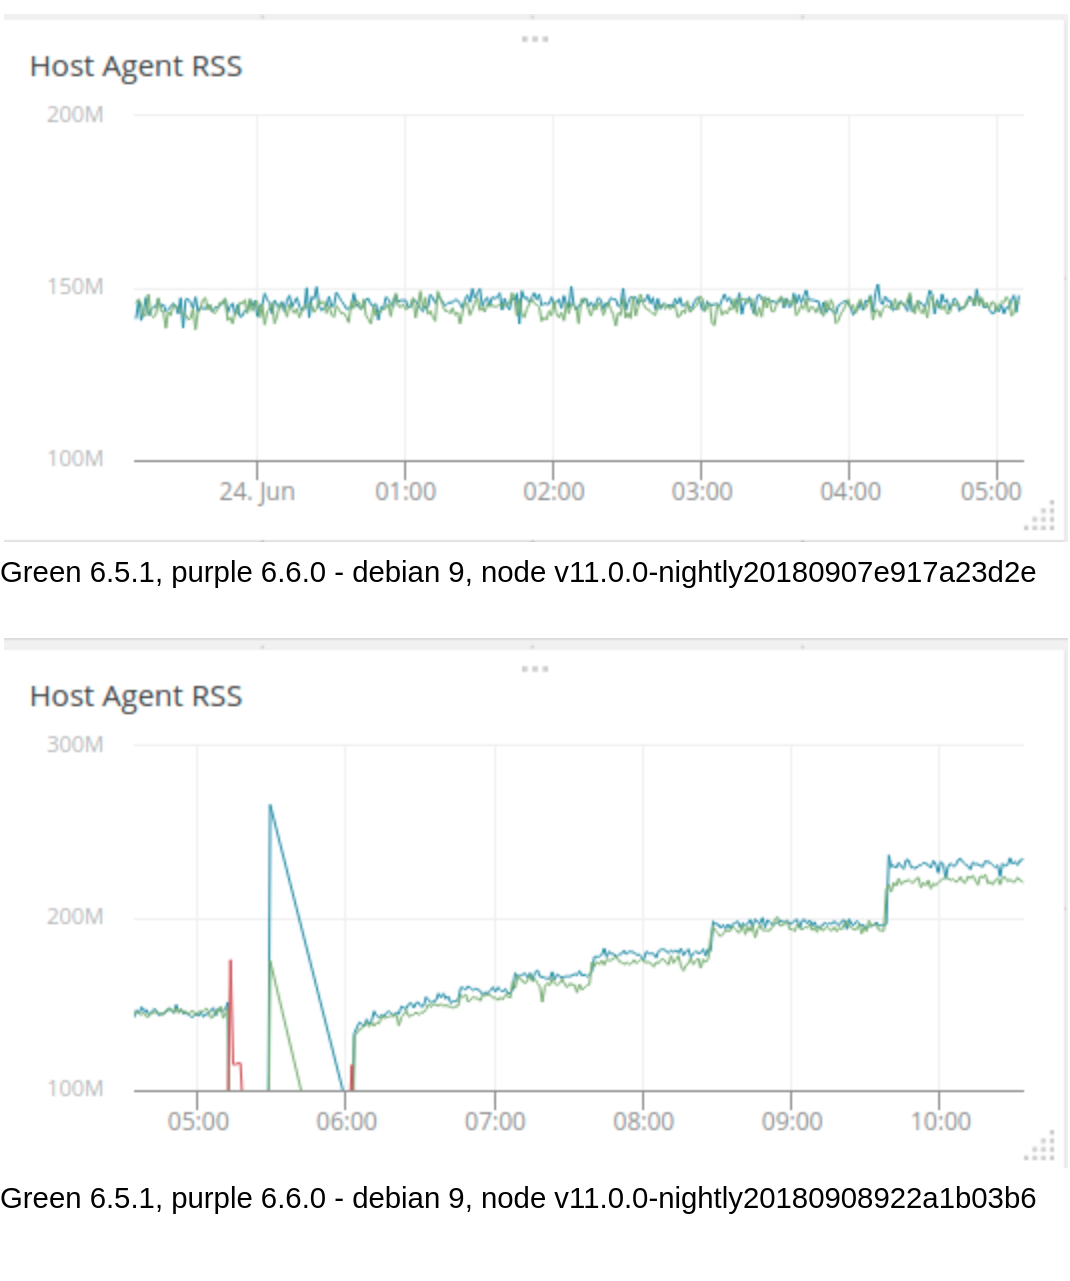
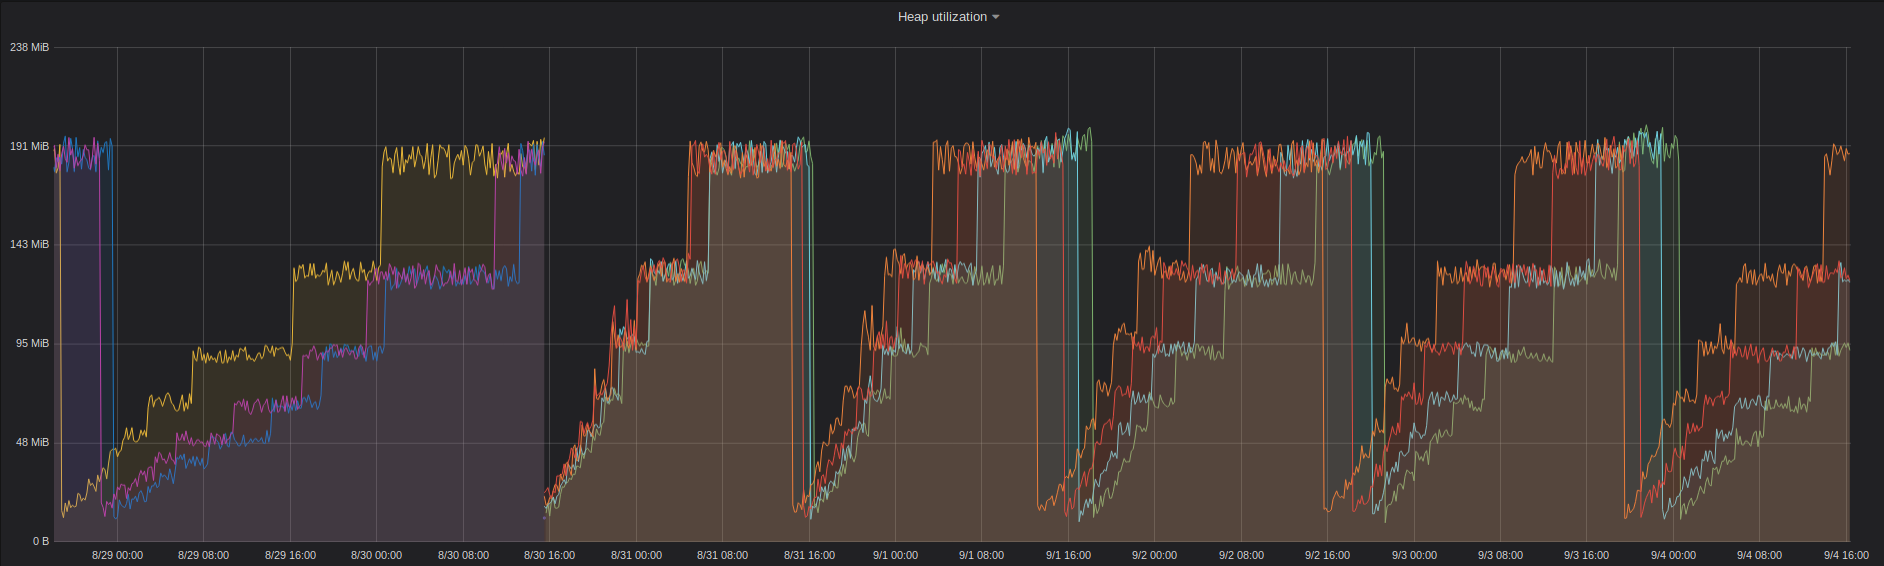
The graph below shows runs against two consecutive nightly releases (the scale changes so that the increased memory usage isn't off the top of the chart). node v11.0.0-nightly20180907e917a23d2e shows no memory leak while node v11.0.0-nightly20180908922a1b03b6 shows a stair-step memory leak. I took a quick look at the commits between the two nightlies but nothing stood out to me other than the v8 changes. I don't know enough of v8 to evaluate them. (6.5.1 and 6.6.0 are the versions of our agent being tested. and at one time the blue line was purple but the legend didn't change.)
Here is output from valgrind for an 11 hour run. This is the first time I've used valgrind so I don't have much to compare it with, but nothing stands out to me - there's nothing that looks like it could account for the memory growth shown in the second graph. Hopefully it will mean more to you.
^C==12927==
==12927== Process terminating with default action of signal 2 (SIGINT)
==12927==    at 0x5DE3469: syscall (syscall.S:38)
==12927==    by 0xA50AA9: uv__epoll_wait (linux-syscalls.c:321)
==12927==    by 0xA4E96D: uv__io_poll (linux-core.c:289)
==12927==    by 0xA3E3AA: uv_run (core.c:370)
==12927==    by 0x96F8E7: node::WorkerThreadsTaskRunner::DelayedTaskScheduler::Start()::{lambda(void*)#1}::_FUN(void*) (in /bmark/.node-get-run/bin/node)
==12927==    by 0x5AE94A3: start_thread (pthread_create.c:456)
==12927==    by 0x5DE7D0E: clone (clone.S:97)
==12927==
==12927== HEAP SUMMARY:
==12927==     in use at exit: 31,449,945 bytes in 40,429 blocks
==12927==   total heap usage: 486,096,918 allocs, 486,056,489 frees, 183,817,581,480 bytes allocated
==12927==
==12927== 8 bytes in 1 blocks are possibly lost in loss record 251 of 2,853
==12927==    at 0x4C2E5F9: memalign (vg_replace_malloc.c:909)
==12927==    by 0x4011F57: allocate_and_init (dl-tls.c:603)
==12927==    by 0x4011F57: tls_get_addr_tail (dl-tls.c:791)
==12927==    by 0x4017137: __tls_get_addr (tls_get_addr.S:55)
==12927==    by 0xA3C3C32: boost::asio::async_result<boost::asio::handler_type<urdl::detail::connect_coro<urdl::detail::http_read_stream<boost::asio::basic_stream_socket<boost::asio::ip::tcp, boost::asio::stream_socket_service<boost::asio::ip::tcp> > >::open_coro<urdl::read_stream::open_coro<urdl::detail::istreambuf_open_handler> > >, void (boost::system::error_code, boost::asio::ip::basic_resolver_iterator<boost::asio::ip::tcp>)>::type>::type boost::asio::ip::resolver_service<boost::asio::ip::tcp>::async_resolve<urdl::detail::connect_coro<urdl::detail::http_read_stream<boost::asio::basic_stream_socket<boost::asio::ip::tcp, boost::asio::stream_socket_service<boost::asio::ip::tcp> > >::open_coro<urdl::read_stream::open_coro<urdl::detail::istreambuf_open_handler> > > >(boost::shared_ptr<void>&, boost::asio::ip::basic_resolver_query<boost::asio::ip::tcp> const&, urdl::detail::connect_coro<urdl::detail::http_read_stream<boost::asio::basic_stream_socket<boost::asio::ip::tcp, boost::asio::stream_socket_service<boost::asio::ip::tcp> > >::open_coro<urdl::read_stream::open_coro<urdl::detail::istreambuf_open_handler> > > const&) (in /bmark/node_modules/appoptics-bindings/oboe/liboboe-1.0-x86_64.so.0.0.0)
==12927==    by 0xA3CB37E: urdl::detail::connect_coro<urdl::detail::http_read_stream<boost::asio::basic_stream_socket<boost::asio::ip::tcp, boost::asio::stream_socket_service<boost::asio::ip::tcp> > >::open_coro<urdl::read_stream::open_coro<urdl::detail::istreambuf_open_handler> > >::operator()(boost::system::error_code, boost::asio::ip::basic_resolver_query<boost::asio::ip::tcp> const*) (in /bmark/node_modules/appoptics-bindings/oboe/liboboe-1.0-x86_64.so.0.0.0)
==12927==    by 0xA3CB792: void urdl::detail::async_connect<urdl::detail::http_read_stream<boost::asio::basic_stream_socket<boost::asio::ip::tcp, boost::asio::stream_socket_service<boost::asio::ip::tcp> > >::open_coro<urdl::read_stream::open_coro<urdl::detail::istreambuf_open_handler> > >(boost::asio::basic_socket<boost::asio::ip::tcp, boost::asio::stream_socket_service<boost::asio::ip::tcp> >&, boost::asio::ip::basic_resolver<boost::asio::ip::tcp, boost::asio::ip::resolver_service<boost::asio::ip::tcp> >&, urdl::url const&, urdl::detail::http_read_stream<boost::asio::basic_stream_socket<boost::asio::ip::tcp, boost::asio::stream_socket_service<boost::asio::ip::tcp> > >::open_coro<urdl::read_stream::open_coro<urdl::detail::istreambuf_open_handler> >) (in /bmark/node_modules/appoptics-bindings/oboe/liboboe-1.0-x86_64.so.0.0.0)
==12927==    by 0xA3CA00F: urdl::detail::http_read_stream<boost::asio::basic_stream_socket<boost::asio::ip::tcp, boost::asio::stream_socket_service<boost::asio::ip::tcp> > >::open_coro<urdl::read_stream::open_coro<urdl::detail::istreambuf_open_handler> >::operator()(boost::system::error_code, unsigned long) (in /bmark/node_modules/appoptics-bindings/oboe/liboboe-1.0-x86_64.so.0.0.0)
==12927==    by 0xA3CA82B: urdl::read_stream::open_coro<urdl::detail::istreambuf_open_handler>::operator()(boost::system::error_code) (in /bmark/node_modules/appoptics-bindings/oboe/liboboe-1.0-x86_64.so.0.0.0)
==12927==    by 0xA3B7EBC: urdl::istreambuf::open(urdl::url const&) (in /bmark/node_modules/appoptics-bindings/oboe/liboboe-1.0-x86_64.so.0.0.0)
==12927==    by 0xA3D6E70: oboe_ssl_reporter::getAWSInstanceId() (in /bmark/node_modules/appoptics-bindings/oboe/liboboe-1.0-x86_64.so.0.0.0)
==12927==    by 0xA3D72D9: oboe_ssl_reporter::refreshHostId() (in /bmark/node_modules/appoptics-bindings/oboe/liboboe-1.0-x86_64.so.0.0.0)
==12927==    by 0xA3D8A49: oboe_ssl_reporter::eventSender() (in /bmark/node_modules/appoptics-bindings/oboe/liboboe-1.0-x86_64.so.0.0.0)
==12927==
==12927== 50 bytes in 1 blocks are possibly lost in loss record 1,689 of 2,853
==12927==    at 0x4C2C4CC: operator new(unsigned long) (vg_replace_malloc.c:344)
==12927==    by 0xAAFA26: v8_inspector::String16::String16(unsigned short const*, unsigned long) (in /bmark/.node-get-run/bin/node)
==12927==    by 0xAB3B62: v8_inspector::toString16(v8_inspector::StringView const&) (in /bmark/.node-get-run/bin/node)
==12927==    by 0xAAB954: v8_inspector::InspectedContext::InspectedContext(v8_inspector::V8InspectorImpl*, v8_inspector::V8ContextInfo const&, int) (in /bmark/.node-get-run/bin/node)
==12927==    by 0xAE7660: v8_inspector::V8InspectorImpl::contextCreated(v8_inspector::V8ContextInfo const&) (in /bmark/.node-get-run/bin/node)
==12927==    by 0x9DEBD1: node::inspector::Agent::ContextCreated(v8::Local<v8::Context>, node::ContextInfo const&) (in /bmark/.node-get-run/bin/node)
==12927==    by 0x915541: node::contextify::ContextifyContext::CreateV8Context(node::Environment*, v8::Local<v8::Object>, node::contextify::ContextOptions const&) (in /bmark/.node-get-run/bin/node)
==12927==    by 0x9159E5: node::contextify::ContextifyContext::MakeContext(v8::FunctionCallbackInfo<v8::Value> const&) (in /bmark/.node-get-run/bin/node)
==12927==    by 0xB9AE5E: v8::internal::MaybeHandle<v8::internal::Object> v8::internal::(anonymous namespace)::HandleApiCallHelper<false>(v8::internal::Isolate*, v8::internal::Handle<v8::internal::HeapObject>, v8::internal::Handle<v8::internal::HeapObject>, v8::internal::Handle<v8::internal::FunctionTemplateInfo>, v8::internal::Handle<v8::internal::Object>, v8::internal::BuiltinArguments) (in /bmark/.node-get-run/bin/node)
==12927==    by 0xB9B968: v8::internal::Builtin_HandleApiCall(int, v8::internal::Object**, v8::internal::Isolate*) (in /bmark/.node-get-run/bin/node)
==12927==    by 0x3D74BBB4FC3C: ???
==12927==    by 0x3D74BBB0EA7A: ???
==12927==
==12927== 62 bytes in 1 blocks are possibly lost in loss record 1,773 of 2,853
==12927==    at 0x4C2C4CC: operator new(unsigned long) (vg_replace_malloc.c:344)
==12927==    by 0xAAFA26: v8_inspector::String16::String16(unsigned short const*, unsigned long) (in /bmark/.node-get-run/bin/node)
==12927==    by 0xAB3B62: v8_inspector::toString16(v8_inspector::StringView const&) (in /bmark/.node-get-run/bin/node)
==12927==    by 0xAAB962: v8_inspector::InspectedContext::InspectedContext(v8_inspector::V8InspectorImpl*, v8_inspector::V8ContextInfo const&, int) (in /bmark/.node-get-run/bin/node)
==12927==    by 0xAE7660: v8_inspector::V8InspectorImpl::contextCreated(v8_inspector::V8ContextInfo const&) (in /bmark/.node-get-run/bin/node)
==12927==    by 0x9DD5C0: node::inspector::Agent::Start(std::string const&, std::shared_ptr<node::DebugOptions>) (in /bmark/.node-get-run/bin/node)
==12927==    by 0x8EDE8E: node::Start(v8::Isolate*, node::IsolateData*, std::vector<std::string, std::allocator<std::string> > const&, std::vector<std::string, std::allocator<std::string> > const&) (in /bmark/.node-get-run/bin/node)
==12927==    by 0x8EC1FB: node::Start(int, char**) (in /bmark/.node-get-run/bin/node)
==12927==    by 0x5D1F2E0: (below main) (libc-start.c:291)
==12927==
==12927== 64 bytes in 1 blocks are possibly lost in loss record 1,869 of 2,853
==12927==    at 0x4C2C4CC: operator new(unsigned long) (vg_replace_malloc.c:344)
==12927==    by 0xAAFA26: v8_inspector::String16::String16(unsigned short const*, unsigned long) (in /bmark/.node-get-run/bin/node)
==12927==    by 0xAB3B62: v8_inspector::toString16(v8_inspector::StringView const&) (in /bmark/.node-get-run/bin/node)
==12927==    by 0xAAB962: v8_inspector::InspectedContext::InspectedContext(v8_inspector::V8InspectorImpl*, v8_inspector::V8ContextInfo const&, int) (in /bmark/.node-get-run/bin/node)
==12927==    by 0xAE7660: v8_inspector::V8InspectorImpl::contextCreated(v8_inspector::V8ContextInfo const&) (in /bmark/.node-get-run/bin/node)
==12927==    by 0x9DEBD1: node::inspector::Agent::ContextCreated(v8::Local<v8::Context>, node::ContextInfo const&) (in /bmark/.node-get-run/bin/node)
==12927==    by 0x915541: node::contextify::ContextifyContext::CreateV8Context(node::Environment*, v8::Local<v8::Object>, node::contextify::ContextOptions const&) (in /bmark/.node-get-run/bin/node)
==12927==    by 0x9159E5: node::contextify::ContextifyContext::MakeContext(v8::FunctionCallbackInfo<v8::Value> const&) (in /bmark/.node-get-run/bin/node)
==12927==    by 0xB9AE5E: v8::internal::MaybeHandle<v8::internal::Object> v8::internal::(anonymous namespace)::HandleApiCallHelper<false>(v8::internal::Isolate*, v8::internal::Handle<v8::internal::HeapObject>, v8::internal::Handle<v8::internal::HeapObject>, v8::internal::Handle<v8::internal::FunctionTemplateInfo>, v8::internal::Handle<v8::internal::Object>, v8::internal::BuiltinArguments) (in /bmark/.node-get-run/bin/node)
==12927==    by 0xB9B968: v8::internal::Builtin_HandleApiCall(int, v8::internal::Object**, v8::internal::Isolate*) (in /bmark/.node-get-run/bin/node)
==12927==    by 0x3D74BBB4FC3C: ???
==12927==    by 0x3D74BBB0EA7A: ???
==12927==
==12927== 88 bytes in 1 blocks are possibly lost in loss record 1,955 of 2,853
==12927==    at 0x4C2C4CC: operator new(unsigned long) (vg_replace_malloc.c:344)
==12927==    by 0xAAFA26: v8_inspector::String16::String16(unsigned short const*, unsigned long) (in /bmark/.node-get-run/bin/node)
==12927==    by 0xAB3B62: v8_inspector::toString16(v8_inspector::StringView const&) (in /bmark/.node-get-run/bin/node)
==12927==    by 0xAAB954: v8_inspector::InspectedContext::InspectedContext(v8_inspector::V8InspectorImpl*, v8_inspector::V8ContextInfo const&, int) (in /bmark/.node-get-run/bin/node)
==12927==    by 0xAE7660: v8_inspector::V8InspectorImpl::contextCreated(v8_inspector::V8ContextInfo const&) (in /bmark/.node-get-run/bin/node)
==12927==    by 0x9DD5C0: node::inspector::Agent::Start(std::string const&, std::shared_ptr<node::DebugOptions>) (in /bmark/.node-get-run/bin/node)
==12927==    by 0x8EDE8E: node::Start(v8::Isolate*, node::IsolateData*, std::vector<std::string, std::allocator<std::string> > const&, std::vector<std::string, std::allocator<std::string> > const&) (in /bmark/.node-get-run/bin/node)
==12927==    by 0x8EC1FB: node::Start(int, char**) (in /bmark/.node-get-run/bin/node)
==12927==    by 0x5D1F2E0: (below main) (libc-start.c:291)
==12927==
==12927== 117 bytes in 1 blocks are definitely lost in loss record 2,018 of 2,853
==12927==    at 0x4C2E2B3: realloc (vg_replace_malloc.c:836)
==12927==    by 0x141E9BC: ERR_add_error_vdata (in /bmark/.node-get-run/bin/node)
==12927==    by 0x141EB6A: ERR_add_error_data (in /bmark/.node-get-run/bin/node)
==12927==    by 0x13F8FF7: dlfcn_load (in /bmark/.node-get-run/bin/node)
==12927==    by 0x13F9898: DSO_load (in /bmark/.node-get-run/bin/node)
==12927==    by 0x13F9ECE: DSO_dsobyaddr (in /bmark/.node-get-run/bin/node)
==12927==    by 0x1445AB3: ossl_init_load_crypto_nodelete_ossl_ (in /bmark/.node-get-run/bin/node)
==12927==    by 0x5AF0758: __pthread_once_slow (pthread_once.c:116)
==12927==    by 0x1488F78: CRYPTO_THREAD_run_once (in /bmark/.node-get-run/bin/node)
==12927==    by 0x1446036: OPENSSL_init_crypto (in /bmark/.node-get-run/bin/node)
==12927==    by 0x146E7FC: do_rand_lock_init_ossl_ (in /bmark/.node-get-run/bin/node)
==12927==    by 0x5AF0758: __pthread_once_slow (pthread_once.c:116)
==12927==
==12927== 304 bytes in 1 blocks are possibly lost in loss record 2,248 of 2,853
==12927==    at 0x4C2E0BC: calloc (vg_replace_malloc.c:762)
==12927==    by 0x4011E31: allocate_dtv (dl-tls.c:322)
==12927==    by 0x40127BD: _dl_allocate_tls (dl-tls.c:539)
==12927==    by 0x5AEA189: allocate_stack (allocatestack.c:584)
==12927==    by 0x5AEA189: pthread_create@@GLIBC_2.2.5 (pthread_create.c:663)
==12927==    by 0xA4B453: uv_thread_create (thread.c:202)
==12927==    by 0x96DBD9: node::WorkerThreadsTaskRunner::WorkerThreadsTaskRunner(int) (in /bmark/.node-get-run/bin/node)
==12927==    by 0x96DDC2: node::NodePlatform::NodePlatform(int, v8::TracingController*) (in /bmark/.node-get-run/bin/node)
==12927==    by 0x8EC0C1: node::Start(int, char**) (in /bmark/.node-get-run/bin/node)
==12927==    by 0x5D1F2E0: (below main) (libc-start.c:291)
==12927==
==12927== 304 bytes in 1 blocks are possibly lost in loss record 2,249 of 2,853
==12927==    at 0x4C2E0BC: calloc (vg_replace_malloc.c:762)
==12927==    by 0x4011E31: allocate_dtv (dl-tls.c:322)
==12927==    by 0x40127BD: _dl_allocate_tls (dl-tls.c:539)
==12927==    by 0x5AEA189: allocate_stack (allocatestack.c:584)
==12927==    by 0x5AEA189: pthread_create@@GLIBC_2.2.5 (pthread_create.c:663)
==12927==    by 0x9DD872: node::inspector::Agent::Start(std::string const&, std::shared_ptr<node::DebugOptions>) (in /bmark/.node-get-run/bin/node)
==12927==    by 0x8EDE8E: node::Start(v8::Isolate*, node::IsolateData*, std::vector<std::string, std::allocator<std::string> > const&, std::vector<std::string, std::allocator<std::string> > const&) (in /bmark/.node-get-run/bin/node)
==12927==    by 0x8EC1FB: node::Start(int, char**) (in /bmark/.node-get-run/bin/node)
==12927==    by 0x5D1F2E0: (below main) (libc-start.c:291)
==12927==
==12927== 320 bytes in 1 blocks are possibly lost in loss record 2,259 of 2,853
==12927==    at 0x4C2E0BC: calloc (vg_replace_malloc.c:762)
==12927==    by 0x4011E31: allocate_dtv (dl-tls.c:322)
==12927==    by 0x40127BD: _dl_allocate_tls (dl-tls.c:539)
==12927==    by 0x5AEA189: allocate_stack (allocatestack.c:584)
==12927==    by 0x5AEA189: pthread_create@@GLIBC_2.2.5 (pthread_create.c:663)
==12927==    by 0xA4135B0: boost::thread::start_thread_noexcept() (in /bmark/node_modules/appoptics-bindings/oboe/liboboe-1.0-x86_64.so.0.0.0)
==12927==    by 0xA3DD3A1: oboe_ssl_reporter::oboe_ssl_reporter(boost::shared_ptr<apache::thrift::transport::TSSLSocketFactory>, char const*, char const*, int, int, int, int, unsigned long) (in /bmark/node_modules/appoptics-bindings/oboe/liboboe-1.0-x86_64.so.0.0.0)
==12927==    by 0xA3DEB32: oboe_reporter_init_ssl (in /bmark/node_modules/appoptics-bindings/oboe/liboboe-1.0-x86_64.so.0.0.0)
==12927==    by 0xA3B1CE1: oboe_init_reporter (in /bmark/node_modules/appoptics-bindings/oboe/liboboe-1.0-x86_64.so.0.0.0)
==12927==    by 0xA0B0CED: oboeInit(Napi::CallbackInfo const&) (in /bmark/node_modules/appoptics-bindings/build/Release/appoptics-bindings.node)
==12927==    by 0xA0B408D: Napi::details::CallbackData<Napi::Value (*)(Napi::CallbackInfo const&), Napi::Value>::Wrapper(napi_env__*, napi_callback_info__*) (in /bmark/node_modules/appoptics-bindings/build/Release/appoptics-bindings.node)
==12927==    by 0x8EF8E4: (anonymous namespace)::v8impl::FunctionCallbackWrapper::Invoke(v8::FunctionCallbackInfo<v8::Value> const&) (in /bmark/.node-get-run/bin/node)
==12927==    by 0xB9AE5E: v8::internal::MaybeHandle<v8::internal::Object> v8::internal::(anonymous namespace)::HandleApiCallHelper<false>(v8::internal::Isolate*, v8::internal::Handle<v8::internal::HeapObject>, v8::internal::Handle<v8::internal::HeapObject>, v8::internal::Handle<v8::internal::FunctionTemplateInfo>, v8::internal::Handle<v8::internal::Object>, v8::internal::BuiltinArguments) (in /bmark/.node-get-run/bin/node)
==12927==
==12927== 320 bytes in 1 blocks are possibly lost in loss record 2,260 of 2,853
==12927==    at 0x4C2E0BC: calloc (vg_replace_malloc.c:762)
==12927==    by 0x4011E31: allocate_dtv (dl-tls.c:322)
==12927==    by 0x40127BD: _dl_allocate_tls (dl-tls.c:539)
==12927==    by 0x5AEA189: allocate_stack (allocatestack.c:584)
==12927==    by 0x5AEA189: pthread_create@@GLIBC_2.2.5 (pthread_create.c:663)
==12927==    by 0xA4135B0: boost::thread::start_thread_noexcept() (in /bmark/node_modules/appoptics-bindings/oboe/liboboe-1.0-x86_64.so.0.0.0)
==12927==    by 0xA3DD4B8: oboe_ssl_reporter::oboe_ssl_reporter(boost::shared_ptr<apache::thrift::transport::TSSLSocketFactory>, char const*, char const*, int, int, int, int, unsigned long) (in /bmark/node_modules/appoptics-bindings/oboe/liboboe-1.0-x86_64.so.0.0.0)
==12927==    by 0xA3DEB32: oboe_reporter_init_ssl (in /bmark/node_modules/appoptics-bindings/oboe/liboboe-1.0-x86_64.so.0.0.0)
==12927==    by 0xA3B1CE1: oboe_init_reporter (in /bmark/node_modules/appoptics-bindings/oboe/liboboe-1.0-x86_64.so.0.0.0)
==12927==    by 0xA0B0CED: oboeInit(Napi::CallbackInfo const&) (in /bmark/node_modules/appoptics-bindings/build/Release/appoptics-bindings.node)
==12927==    by 0xA0B408D: Napi::details::CallbackData<Napi::Value (*)(Napi::CallbackInfo const&), Napi::Value>::Wrapper(napi_env__*, napi_callback_info__*) (in /bmark/node_modules/appoptics-bindings/build/Release/appoptics-bindings.node)
==12927==    by 0x8EF8E4: (anonymous namespace)::v8impl::FunctionCallbackWrapper::Invoke(v8::FunctionCallbackInfo<v8::Value> const&) (in /bmark/.node-get-run/bin/node)
==12927==    by 0xB9AE5E: v8::internal::MaybeHandle<v8::internal::Object> v8::internal::(anonymous namespace)::HandleApiCallHelper<false>(v8::internal::Isolate*, v8::internal::Handle<v8::internal::HeapObject>, v8::internal::Handle<v8::internal::HeapObject>, v8::internal::Handle<v8::internal::FunctionTemplateInfo>, v8::internal::Handle<v8::internal::Object>, v8::internal::BuiltinArguments) (in /bmark/.node-get-run/bin/node)
==12927==
==12927== 320 bytes in 1 blocks are possibly lost in loss record 2,261 of 2,853
==12927==    at 0x4C2E0BC: calloc (vg_replace_malloc.c:762)
==12927==    by 0x4011E31: allocate_dtv (dl-tls.c:322)
==12927==    by 0x40127BD: _dl_allocate_tls (dl-tls.c:539)
==12927==    by 0x5AEA189: allocate_stack (allocatestack.c:584)
==12927==    by 0x5AEA189: pthread_create@@GLIBC_2.2.5 (pthread_create.c:663)
==12927==    by 0xA3C3AF1: boost::asio::detail::posix_thread::posix_thread<boost::asio::detail::resolver_service_base::work_io_service_runner>(boost::asio::detail::resolver_service_base::work_io_service_runner, unsigned int) (in /bmark/node_modules/appoptics-bindings/oboe/liboboe-1.0-x86_64.so.0.0.0)
==12927==    by 0xA3C3EEE: boost::asio::async_result<boost::asio::handler_type<urdl::detail::connect_coro<urdl::detail::http_read_stream<boost::asio::basic_stream_socket<boost::asio::ip::tcp, boost::asio::stream_socket_service<boost::asio::ip::tcp> > >::open_coro<urdl::read_stream::open_coro<urdl::detail::istreambuf_open_handler> > >, void (boost::system::error_code, boost::asio::ip::basic_resolver_iterator<boost::asio::ip::tcp>)>::type>::type boost::asio::ip::resolver_service<boost::asio::ip::tcp>::async_resolve<urdl::detail::connect_coro<urdl::detail::http_read_stream<boost::asio::basic_stream_socket<boost::asio::ip::tcp, boost::asio::stream_socket_service<boost::asio::ip::tcp> > >::open_coro<urdl::read_stream::open_coro<urdl::detail::istreambuf_open_handler> > > >(boost::shared_ptr<void>&, boost::asio::ip::basic_resolver_query<boost::asio::ip::tcp> const&, urdl::detail::connect_coro<urdl::detail::http_read_stream<boost::asio::basic_stream_socket<boost::asio::ip::tcp, boost::asio::stream_socket_service<boost::asio::ip::tcp> > >::open_coro<urdl::read_stream::open_coro<urdl::detail::istreambuf_open_handler> > > const&) (in /bmark/node_modules/appoptics-bindings/oboe/liboboe-1.0-x86_64.so.0.0.0)
==12927==    by 0xA3CB37E: urdl::detail::connect_coro<urdl::detail::http_read_stream<boost::asio::basic_stream_socket<boost::asio::ip::tcp, boost::asio::stream_socket_service<boost::asio::ip::tcp> > >::open_coro<urdl::read_stream::open_coro<urdl::detail::istreambuf_open_handler> > >::operator()(boost::system::error_code, boost::asio::ip::basic_resolver_query<boost::asio::ip::tcp> const*) (in /bmark/node_modules/appoptics-bindings/oboe/liboboe-1.0-x86_64.so.0.0.0)
==12927==    by 0xA3CB792: void urdl::detail::async_connect<urdl::detail::http_read_stream<boost::asio::basic_stream_socket<boost::asio::ip::tcp, boost::asio::stream_socket_service<boost::asio::ip::tcp> > >::open_coro<urdl::read_stream::open_coro<urdl::detail::istreambuf_open_handler> > >(boost::asio::basic_socket<boost::asio::ip::tcp, boost::asio::stream_socket_service<boost::asio::ip::tcp> >&, boost::asio::ip::basic_resolver<boost::asio::ip::tcp, boost::asio::ip::resolver_service<boost::asio::ip::tcp> >&, urdl::url const&, urdl::detail::http_read_stream<boost::asio::basic_stream_socket<boost::asio::ip::tcp, boost::asio::stream_socket_service<boost::asio::ip::tcp> > >::open_coro<urdl::read_stream::open_coro<urdl::detail::istreambuf_open_handler> >) (in /bmark/node_modules/appoptics-bindings/oboe/liboboe-1.0-x86_64.so.0.0.0)
==12927==    by 0xA3CA00F: urdl::detail::http_read_stream<boost::asio::basic_stream_socket<boost::asio::ip::tcp, boost::asio::stream_socket_service<boost::asio::ip::tcp> > >::open_coro<urdl::read_stream::open_coro<urdl::detail::istreambuf_open_handler> >::operator()(boost::system::error_code, unsigned long) (in /bmark/node_modules/appoptics-bindings/oboe/liboboe-1.0-x86_64.so.0.0.0)
==12927==    by 0xA3CA82B: urdl::read_stream::open_coro<urdl::detail::istreambuf_open_handler>::operator()(boost::system::error_code) (in /bmark/node_modules/appoptics-bindings/oboe/liboboe-1.0-x86_64.so.0.0.0)
==12927==    by 0xA3B7EBC: urdl::istreambuf::open(urdl::url const&) (in /bmark/node_modules/appoptics-bindings/oboe/liboboe-1.0-x86_64.so.0.0.0)
==12927==    by 0xA3D6E70: oboe_ssl_reporter::getAWSInstanceId() (in /bmark/node_modules/appoptics-bindings/oboe/liboboe-1.0-x86_64.so.0.0.0)
==12927==
==12927== 960 bytes in 3 blocks are possibly lost in loss record 2,492 of 2,853
==12927==    at 0x4C2E0BC: calloc (vg_replace_malloc.c:762)
==12927==    by 0x4011E31: allocate_dtv (dl-tls.c:322)
==12927==    by 0x40127BD: _dl_allocate_tls (dl-tls.c:539)
==12927==    by 0x5AEA189: allocate_stack (allocatestack.c:584)
==12927==    by 0x5AEA189: pthread_create@@GLIBC_2.2.5 (pthread_create.c:663)
==12927==    by 0xA4B453: uv_thread_create (thread.c:202)
==12927==    by 0xA394CA: init_threads (threadpool.c:164)
==12927==    by 0xA394CA: init_once (threadpool.c:191)
==12927==    by 0x5AF0758: __pthread_once_slow (pthread_once.c:116)
==12927==    by 0xA4B6E8: uv_once (thread.c:363)
==12927==    by 0xA395F5: uv__work_submit (threadpool.c:199)
==12927==    by 0xA43E7D: uv_getaddrinfo (getaddrinfo.c:187)
==12927==    by 0x8B7CDB: node::cares_wrap::(anonymous namespace)::GetAddrInfo(v8::FunctionCallbackInfo<v8::Value> const&) (in /bmark/.node-get-run/bin/node)
==12927==    by 0xB9AE5E: v8::internal::MaybeHandle<v8::internal::Object> v8::internal::(anonymous namespace)::HandleApiCallHelper<false>(v8::internal::Isolate*, v8::internal::Handle<v8::internal::HeapObject>, v8::internal::Handle<v8::internal::HeapObject>, v8::internal::Handle<v8::internal::FunctionTemplateInfo>, v8::internal::Handle<v8::internal::Object>, v8::internal::BuiltinArguments) (in /bmark/.node-get-run/bin/node)
==12927==
==12927== 1,216 bytes in 4 blocks are possibly lost in loss record 2,543 of 2,853
==12927==    at 0x4C2E0BC: calloc (vg_replace_malloc.c:762)
==12927==    by 0x4011E31: allocate_dtv (dl-tls.c:322)
==12927==    by 0x40127BD: _dl_allocate_tls (dl-tls.c:539)
==12927==    by 0x5AEA189: allocate_stack (allocatestack.c:584)
==12927==    by 0x5AEA189: pthread_create@@GLIBC_2.2.5 (pthread_create.c:663)
==12927==    by 0xA4B453: uv_thread_create (thread.c:202)
==12927==    by 0x96DCA7: node::WorkerThreadsTaskRunner::WorkerThreadsTaskRunner(int) (in /bmark/.node-get-run/bin/node)
==12927==    by 0x96DDC2: node::NodePlatform::NodePlatform(int, v8::TracingController*) (in /bmark/.node-get-run/bin/node)
==12927==    by 0x8EC0C1: node::Start(int, char**) (in /bmark/.node-get-run/bin/node)
==12927==    by 0x5D1F2E0: (below main) (libc-start.c:291)
==12927==
==12927== LEAK SUMMARY:
==12927==    definitely lost: 117 bytes in 1 blocks
==12927==    indirectly lost: 0 bytes in 0 blocks
==12927==      possibly lost: 4,016 bytes in 17 blocks
==12927==    still reachable: 31,445,812 bytes in 40,411 blocks
==12927==                       of which reachable via heuristic:
==12927==                         stdstring          : 209,704 bytes in 429 blocks
==12927==                         newarray           : 102,040 bytes in 152 blocks
==12927==         suppressed: 0 bytes in 0 blocks
==12927== Reachable blocks (those to which a pointer was found) are not shown.
==12927== To see them, rerun with: --leak-check=full --show-leak-kinds=all
==12927==
==12927== For lists of detected and suppressed errors, rerun with: -s
==12927== ERROR SUMMARY: 13 errors from 13 contexts (suppressed: 0 from 0)
What can I do next to help isolate this?
 bmacnaughton
All 71 comments
Thanks for the report!
nothing stood out to me other than the v8 changes.
I agree, looking at e917a23d2e...922a1b03b6 that seems like the only reasonable source of issues – and V8 updates are big changes, so this is likely the culprit.
Here is output from valgrind for an 11 hour run. This is the first time I've used valgrind so I don't have much to compare it with, but nothing stands out to me - there's nothing that looks like it could account for the memory growth shown in the second graph.
I agree :+1: That valgrind shows nothing of interest makes it less likely that this is a memory leak in C++, so that’s already helpful.
What can I do next to help isolate this?
The fact that this is unlikely to be a C++ memory leak makes it more likely that this is one in JS; valgrind doesn’t track memory allocated using mmap() & co. by default, which is what V8 uses for the JS heap.
First, if possible, it would be good to verify that this is the case. process.memoryUsage(), require('v8').getHeapStatistics() and require('v8').getHeapSpaceStatistics() all provide potentially useful information about the memory region in which the leak occurs.
Secondly, if possible, taking heap dumps at different points in time and comparing then in Chrome DevTools should help a lot with figuring out what objects are being retained and why, if this is a JS memory leak. For taking heap dumps you can use e.g. https://www.npmjs.com/package/heapdump, or, if that’s more convenient, directly attach DevTools to the process.
Given that this is likely a V8 bug, you may want to run the process with --expose-gc and manually perform global.gc() calls from time to time – you obviously shouldn’t do this in production, and it’s unlikely to be helpful, but if it is, then we know it’s likely an issue with V8 detecting when to run GC, and not a real memory leak, which would also be helpful.
Finally, it would also be good to know if a more recent version of Node.js (e.g. current nightlies) has the same issue. V8 issues are often caught and later addressed, and it may be the case that the solution is to figure out which V8 commit fixed this issue and then backport that to the relevant Node.js versions.
The APM product comprises JavaScript, a C/C++ library, and C++ code that uses the node-addon-api.
If this does turn out to be an issue with one of the C++ parts (e.g. by seeing an increase in RSS but not the heap as reported by process.memoryUsage()), it can still be useful to take heap dumps and compare them; I would expect that most resources allocated by addons are either tied to JS objects or would be reported by valgrind.
I hope this helps!
 addaleax
on 25 Jun 2019
addaleax
on 25 Jun 2019
it would also be good to know if a more recent version of Node.js (e.g. current nightlies) has the same issue.
v13.0.0-nightly20190625e2d445be8f still exhibits the problem. I am in the process of adding the additional metrics you suggested (v8 heap statistics and process.memoryUsage beyond RSS) and will run again with that information available.
Here are the graphs using v13.0.0-nightly20190625e2d445be8f (the righthand chart is process.memoryUsage().rss but that's the only property the current app reports).

I am proceeding with the additional memory metrics and the heapdump approach as well as checking whether deliberately invoking gc helps.
bmacnaughton
on 25 Jun 2019
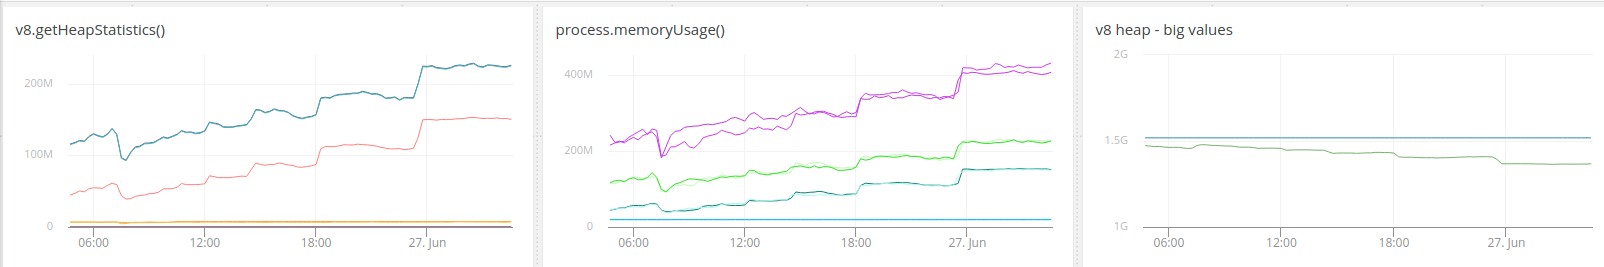
graphs for process.memoryUsage() and v8.getHeapStatistic() - I haven't included v8.getHeapSpaceStatistics() due to the array not being compatible with the metrics reporting API I'm using. If that additional information is important I can dump them to a CSV file and graph.
These runs were executed with garbage collection being called once every minute.

__left chart top-to-bottom__ (leaves out heap_size_limit and total_available_size):
total_heap_size/total_physical_size (appear as one line on top)
used_heap_size (orange)
peak_malloced_memory
total_heap_size_executable
malloced_memory
number_of_native_contexts
__right chart top-to-bottom:__
rss
heap
heapUsed
external
bmacnaughton
on 26 Jun 2019
@bmacnaughton It’s not fully obvious from the graphs, but I’d said that this does look like a JS memory leak because the heap size and the RSS curves in the right graph do about the same thing?
addaleax
on 26 Jun 2019
@addaleax - when you say a JS memory leak you mean v8, right? If yes, it seems that way to me. I'm adding heapdump code to the todo server now; I'll probably dump every 10 minutes or so.
I'm going to let this run a while longer before starting the version that will call heapdump every 10 minutes. I'd like to get a little longer view. I will also turn off the forced garbage collection for the next run to have a comparison to this run.
btw, the v8 heap total_available_size is slowly going down. see attached chart. I put these two values in a separate chart because their scale was very different. the top line (which is flat but is a bit of an optical illusion) is the heap_size_limit. the bottom line is the total_available_size.

bmacnaughton
on 26 Jun 2019
OK, here's charts at the end of the previous run. It's looking pretty similar to the previous runs. The gc doesn't prevent the memory loss; it would take more work to determine whether it slows down the rate of loss. I'm going to pass on that now.
The v8.total_available_size is now down to 1.4 GB; it started at 1.5 GB. The heap_size_limit is 1.518 GB (constant)
Charts:


I'm starting a run with heap dumps every 10 minutes.
bmacnaughton
on 26 Jun 2019
Hi, may I ask what did you use to generate the memory usage graph?
 mayinghan
on 27 Jun 2019
mayinghan
on 27 Jun 2019
The data is coming from the JavaScript calls process.memoryUsage() and v8.getHeapStatistics(). I'm sending those to the appoptics metrics api at api.appoptics.com/v1/measurements. and they're available at my.appoptics.com in dashboards/metrics. The todo server app (my interactive test harness, not really meant for general application) is at github.com/bmacnaughton/todo. the metrics generation code is in server.js (search for argv.metrics) and lib/metrics.js.
@addaleax - I have almost 20 hours of heapdump snapshots at this time - one every 15 minutes. I haven't looked at them before but am just starting to look now; I'll see what I learn. If they would be helpful to you I can post all or specific time periods.
bmacnaughton
on 27 Jun 2019
comparison a little over 13 hours apart. any thoughts about what specifically to look for would be appreciated.


maybe this is helpful?

bmacnaughton
on 27 Jun 2019
Oh, the charts that can help place the snapshots in time (heap snapshots are UTC while charts are U.S. Pacific).

bmacnaughton
on 27 Jun 2019
@bmacnaughton You’re on the right track – you typically want to look at the retainers of objects created later in time, because those are more likely part of the memory leak. (The map for Array objects, which iiuc is what you are looking at in your screenshot, is something that is expected to live forever – unless maybe you are creating a lot of vm.Contexts?).
addaleax
on 27 Jun 2019
@addaleax I am not creating any vm.Contexts (that I am aware of). I am trying to investigate:

and within that, system@2499219 - that is the array you see (I think). Is there a good doc on understanding what is being shown here? e.g., what @55515 means after an array entry, etc.?
bmacnaughton
on 27 Jun 2019
@addaleax - OK, here's a wag based on a guess. I'm guessing the @number is sequencing of some sort so that larger numbers imply later creation. If that's workable then this object is later in time and it's retainer is related to our use of async_hooks. That seems like a likely candidate to be impacted by a v8 change. (Sorry for the miserable formatting - there's too much for a screen shot and the copy didn't format well.)
mapinObject@2941061
4100in(internal array)[]@2889197 | 6 | 229 4160 % | 1 689 2641 % |
tableinMap@226307 | 5 | 320 % | 1 689 2961 % |
_contextsinNamespace@236189 | 4 | 1360 % | 1360 % |
ao-cls-contextinObject@168663 | 3 | 560 % | 560 % |
namespacesinprocess@1239 | 2 | 240 % | 21 1520 % |
process_objectinNode / Environment@108006912🗖 | 1 | 2 3840 % | 49 2690 % |
processinsystem / Context@168883 | 3 | 3280 % | 6640 % |
processinsystem / Context@168881 | 3 | 2800 % | 2 3040 % |
processinsystem / Context@168879 | 3 | 2080 % | 6320 % |
processinsystem / Context@168839 | 3 | 3920 % | 1 0640 % |
_processinsystem / Context@212835 | 3 | 640 % | 640 % |
processinsystem / Context@136221 | 3 | 1840 % | 1 8240 % |
processinsystem / Context@70437 | 3 | 2480 % | 3 4000 % |
9in@175189 | 4 | 2 4320 % | 5 9360 % |
processinsystem / Context@296149 | 4 | 1360 % | 1 0880 % |
processinsystem / Context@179163 | 4 | 1840 % | 5120 % |
objectinsystem / Context@170107 | 4 | 720 % | 720 % |
processinsystem / Context@168529 | 4 | 2560 % | 2 0640 % |
processinsystem / Context@149249 | 4 | 1120 % | 1120 % |
processinsystem / Context@148233 | 4 | 5440 % | 10 0800 % |
processinsystem / Context@169109 | 4 | 3840 % | 4160 % |
processinsystem / Context@170047 | 4 | 4640 % | 1 8720 % |
processinsystem / Context@28599 | 4 | 2720 % | 2 8000 % |
processinsystem / Context@169087 | 5 | 960 % | 960 % |
processinsystem / Context@169079 | 5 | 1360 % | 3920 % |
processinsystem / Context@116733 | 5 | 6000 % | 4 4880 % |
processinsystem / Context@146687 | 5 | 2320 % | 9920 % |
processinsystem / Context@64745 | 5 | 960 % | 2 1920 % |
processinsystem / Context@68209 | 5 | 5440 % | 3 9040 % |
9in@179989 | 6 | 1 5040 % | 2 8640 % |
4in@171337 | 6 | 3 9040 % | 7 5600 % |
processinsystem / Context@171335 | 6 | 1920 % | 5280 % |
processinsystem / Context@214235 | 6 | 1840 % | 9440 % |
processinsystem / Context@213851 | 6 | 800 % | 1 1360 % |
processinsystem / Context@106515 | 6 | 2400 % | 1 0080 % |
processinsystem / Context@188547 | 6 | 5600 % | 227 4320 % |
exportsinModule@102009 | 7 | 880 % | 5760 % |
processinsystem / Context@60579 | 7 | 6320 % | 4 3040 % |
processinsystem / Context@107777 | 7 | 4320 % | 4 0880 % |
processinsystem / Context@106047 | 7 | 7120 % | 4 1840 % |
processinsystem / Context@10703 | 7 | 1120 % | 1120 % |
6in(internal array)[]@322865 | 8 | 960 % | 960 % |
processinsystem / Context@213369 | 8 | 960 % | 4320 % |
processinsystem / Context@221567 | 8 | 2160 % | 6400 % |
processinsystem / Context@236123 | 8 | 1600 % | 2 6560 % |
processinsystem / Context@119065 | 8 | 5040 % | 11 8880 % |
processinsystem / Context@116925 | 8 | 2320 % | 2 1200 % |
processinsystem / Context@191171 | 8 | 3680 % | 10 8800 % |
44in@2888137 | 9 | 7 6480 % | 19 7360 % |
processinsystem / Context@213883 | 9 | 2720 % | 1 6960 % |
processinsystem / Context@96405 | 9 | 1280 % | 6560 % |
pnainsystem / Context@53365 | 9 | 3040 % | 4 0960 % |
processinsystem / Context@118915 | 9 | 3600 % | 26 4160 % |
processinsystem / Context@191517 | 9 | 3200 % | 4880 % |
processinsystem / Context@188041 | 9 | 6720 % | 3 9840 % |
processinsystem / Context@187989 | 9 | 4800 % | 2 6560 % |
pnainsystem / Context@164473 | 9 | 960 % | 4320 % |
pnainsystem / Context@164523 | 9 | 3760 % | 5 3600 % |
25in@407329 | 10 | 4 4480 % | 10 7440 % |
processinsystem / Context@212821 | 10 | 960 % | 3200 % |
processinsystem / Context@237613 | 10 | 1520 % | 3 5920 % |
processinsystem / Context@313911 | 10 | 3200 % | 1 4560 % |
pnainsystem / Context@96225 | 10 | 640 % | 2320 % |
processinsystem / Context@168193 | 10 | 3280 % | 2 8080 % |
processinsystem / Context@43051 | 10 | 2400 % | 66 2240 % |
processinsystem / Context@119653 | 10 | 2160 % | 3440 % |
processinsystem / Context@119513 | 10 | 4240 % | 13 3920 % |
processinsystem / Context@117197 | 10 | 1440 % | 8160 % |
processinsystem / Context@17725 | 10 | 2880 % | 1 7600 % |
processinsystem / Context@17659 | 10 | 1760 % | 6800 % |
processinsystem / Context@68641 | 10 | 5760 % | 6 5680 % |
freeProcessinsystem / Context@10795 | 10 | 1 0480 % | 20 3760 % |
40in(internal array)[]@377579 | 11 | 4160 % | 4160 % |
5in@2277855 | 11 | 2 2400 % | 3 8960 % |
19in@527441 | 11 | 3 8400 % | 10 2320 % |
24in@988155 | 11 | 3 9680 % | 10 6160 % |
6in(internal array)[]@323153 | 12 | 720 % | 720 % |
47in(Isolate)@17 | − | 00 % | 2080 % |
26in(Global handles)@31 | − | 00 % | 4 3600 % |
60insystem@168665 | 3 | 5200 % | 5200 % |
3in@240155 | 5 | 2 0480 % | 3 5680 % |
namespaceinsystem / Context@225603 | 5 | 640 % | 640 % |
16in@225607 | 7 | 2 0160 % | 3 8960 % |
6in@225607 | 7 | 2 0160 % | 3 8960 % |
16in@225605 | 7 | 2 0800 % | 3 5120 % |
8in@225605 | 7 | 2 0800 % | 3 5120 % |
namespaceinsystem / Context@2949321 | 8 | 640 % | 1200 % |
13in(internal array)[]@324253 | 9 | 1440 % | 1440 % |
13in(internal array)[]@324267 | 9 | 2000 % | 2000 % |
9in@240155 | 5 | 2 0480 % | 3 5680 % |
5in@240155 | 5 | 2 0480 % | 3 5680 % |
7in(internal array)[]@324295 | 7 | 800 % | 800 % |
4in@225609 | 7 | 9920 % | 1 7360 % |
3in@225607 | 7 | 2 0160 % | 3 8960 % |
3in@225605 | 7 | 2 0800 % | 3 5120 %
I appreciate the time you've provided so far and any pointers you can provide me at this time.
bmacnaughton
on 27 Jun 2019
for anyone following along that has as much to learn here as me: https://developers.google.com/web/tools/chrome-devtools/memory-problems/memory-101
https://developers.google.com/web/tools/chrome-devtools/memory-problems/heap-snapshots
https://www.youtube.com/watch?v=L3ugr9BJqIs
https://www.youtube.com/watch?v=hliOMEQRqf8
bmacnaughton
on 27 Jun 2019
@addaleax - one video I watched said that I have no control over the parenthesized items in the memory display. If that's correct then the (system) category is in the control of (I suspect) v8 only.
bmacnaughton
on 28 Jun 2019
@bmacnaughton So … that’s partially true – these objects are still kept alive by other objects, and if those other objects are controlled by your code, then you do have some control over that.
Also, the fact that these objects are being controlled by V8 would align with this pointing to a bug in V8… which is a good reason to figure out where the leak comes from ;)
addaleax
on 28 Jun 2019
This is last commit to src/async_wrap.cc prior to the nightly build where the memory leak started (2018-09-08). I'm not sure how to tell what went into a given nightly, but there's definitely some activity in the async_wrap area here.
commit da8641f3b46f41be11ba932f4228a36bfee9fd1c
Author: Daniel Bevenius <[email protected]>
Date:   Tue Aug 21 08:54:02 2018 +0200

    src: move process.binding('async_wrap') internal

    This commit makes the async_wrap builtin an internal builtin, and
    changes usage of the builtin from using process.binding('async_wrap')
    to use internalBinding instead.

    Refs: https://github.com/nodejs/node/issues/22160

    PR-URL: https://github.com/nodejs/node/pull/22469
    Refs: https://github.com/nodejs/node/issues/22160
    Reviewed-By: Luigi Pinca <[email protected]>
    Reviewed-By: Anna Henningsen <[email protected]>
    Reviewed-By: Ruben Bridgewater <[email protected]>
    Reviewed-By: Colin Ihrig <[email protected]>
    Reviewed-By: James M Snell <[email protected]>
    Reviewed-By: Trivikram Kamat <[email protected]>
At this point tbh, I'm not sure I would recognize a smoking gun if I saw one. I do see that a number of the array elements are my code's async_hooks/cls-hooked context.
bmacnaughton
on 28 Jun 2019
@addaleax - I'm sorry that I can't make faster progress on this. I am a bit like a dog watching TV. The things I'm looking at sound like things I've heard but the form is abstracted in a way that makes it hard for me to grasp.
bmacnaughton
on 28 Jun 2019
@bmacnaughton Would you be able to share a reproduction, or maybe even “just” a heap dump for inspection?
da8641f3b46f41be11ba932f4228a36bfee9fd1c seems like an unlikely candidate for causing a memory leak, and also isn’t part of the commit range that we would primarily look into (according to the different nightlies).
It might still be good to know which objects in your application keep the newly added (system) objects (are they all Maps?) alive, if that’s something you can figure out, and how they relate to each other.
I'm sorry that I can't make faster progress on this.
Well, I’ll be without access to a computer for the next 48 hours, so as far as I am concerned, take your time. I’m pretty interested in finding out where this is coming from, though :)
addaleax
on 28 Jun 2019
And in the worst case, there’s always the brute-force option of bisecting against the V8 commit range corresponding to the update; it’s going to require building Node.js 11 times from scratch and seeing whether the leak also occurs there, but it would likely lead to the commit that caused this change.
addaleax
on 28 Jun 2019
I'm happy to share all the heap dumps you would be willing to look at. This is from an internal benchmark and has no customer data in it. I would prefer to send a dump, or put it somewhere for you specifically. I've sent a google docs share to you. Please advise if you have any issues (I used an organization account - not sure how that handles shares).
I've done the node bisecting twice now (once to find where the default heap limits changed and once to find where the leak started - I thought those were the same problem initially) but they didn't involve building node from scratch. I did that a couple times at Vancouver Node+JS Interactive but haven't since.
It's a little harder to share a repro - I have not been able to reproduce this outside of a docker-compose environment. Setting up access to the EC2 environment and going through the process for that is probably best left as a last resort. If I could repro on my dev machine then I would be able to share it.
It might still be good to know which objects in your application keep the newly added (system) objects (are they all Maps?) alive, if that’s something you can figure out, and how they relate to each other.
I'll be looking at this while you're away. I appreciate your hints.
bmacnaughton
on 28 Jun 2019
t might still be good to know which objects in your application keep the newly added (system) objects (are they all Maps?) alive, if that’s something you can figure out, and how they relate to each other.
Yes, they are all maps.
One thing that makes no sense to me is this:

There are 784 elements in 1 :: system @2499219 each of which is no larger than 80 bytes. How can the shallow size be 110 761 200?
The majority of the 784 elements appear to be cls-hooked context which is created/destroyed based on async_hooks callbacks.
bmacnaughton
on 29 Jun 2019
I'm not sure how to make sense of this either. The bulk of memory is not labeled at all - it can't just be C/C++ code as the area is bigger than the initial memory footprint of the whole program.

@addaleax - If you are able to take a look at the snapshots and they are clear to you I would very much like to understand the process you went through to find the error (I wish I could just watch the process). If they don't help then I will give bisecting the commits in v11.0.0-nightly20180908922a1b03b6 and using each to do a build. That will require some fiddling around with the test suite as well as re-familiarizing myself with building node, so I'll wait until I hear news from you.
bmacnaughton
on 1 Jul 2019
@addaleax - many of the objects being retained in system / Map elements are created by cls-hooked, a wrapper around async_hooks. But looking at retainers serializer (and serializeInto, which I don't see in the node source) are holding on to it; serializer is part of v8 so maybe it's related to the issue in some way?

In the meantime, I've built node again and can start trying to bisect v8 releases if you can provide a little guidance as to how to go about that.
bmacnaughton
on 2 Jul 2019
@addaleax - clarifying: your suggestion of building each specific v8 commit is to use each of the commits in https://github.com/nodejs/node/compare/e917a23d2e8269eec48e95bcebcb9f7c6c5e4e3d...922a1b03b638e19d8d29efdaab93d5c9455c02ce to build node and then test that particular binary in our test harness, right?
bmacnaughton
on 2 Jul 2019
Hi again @bmacnaughton!
There are 784 elements in
1 :: system @2499219each of which is no larger than 80 bytes. How can the shallow size be110 761 200?
Yes. This doesn’t make sense to me either, and, sadly, points to some relevant information simply not ending up in the heap snapshot. I feel like at this point it would make sense for somebody from @nodejs/v8 to take a closer look.
and
serializeInto, which I don't see in the node source
It’s in the V8 source code, for the versions of V8 that come into question here.
clarifying: your suggestion of building each specific v8 commit is to use each of the commits in e917a23...922a1b0 to build node and then test that particular binary in our test harness, right?
It’s unfortunately not that easy, because we bump V8 versions as a bulk commit, not by picking individual commits.
Bisecting against V8 versions is a painful process that’s best performed on a machine with a lot of CPU power, but what I typically do if I have to do this is:
- Use a checkout of the
noderepository just before or after the V8 update commits in question - Move
deps/v8todeps/v8~ - Get a clone of the V8 repository, and bisect the version range in question (in this case, v8/v8@131866fb708c1a623aa7cf685ee44438411d106d... v8/v8@d7b61abe7b48928aed739f02bf7695732d359e7e)
- Create a symlink from the v8 checkout to
deps/v8in the Node.js tree (not sure if this works with current versions of Node.js, but for the older ones it should work) - For each bisecting step, compile Node.js and test whether the issue occurs with it
It’s not a lot of manual work, but it takes time because it usually means recompiling all of Node.js from scratch a dozen times. It might be easier to wait for an opinion from somebody more familiar with V8 internals first…
addaleax
on 2 Jul 2019
There is a way to narrow the range of commits before bisecting V8: go to https://nodejs.org/download/v8-canary/ and try with canary versions. you can look at this table to know which V8 version is in which canary version.
 targos
on 2 Jul 2019
targos
on 2 Jul 2019
@targos - thanks. I'll definitely use that if bisecting is required.
bmacnaughton
on 2 Jul 2019
@addaleax - thanks for your help. were you able to access the heap snapshots i put into google docs? (shared with your commit email).
bmacnaughton
on 2 Jul 2019
@nodejs/v8 - i have heap snapshots every 15 minutes for the following run. Let me know if you would like me to post them (a subset of them hopefully) somewhere.
bmacnaughton
on 2 Jul 2019
@targos - is my next step to work on bisecting v8 releases or is someone going to take a look at this? i don't know how the nodejs/v8 team works with errors like this. i just don't know what to expect here so wanted to check in.
bmacnaughton
on 5 Jul 2019
- Having a repro would definitely help. Maybe you are willing to share on confidentially?
- Having a repro that does not use Node APIs would be a lot better. E.g. one that runs in V8 standalone.
- Can you run your repro with
--expose-gcand explicitly callgc()periodically to force a garbage collection?
- Can you run your repro with
 hashseed
on 6 Jul 2019
hashseed
on 6 Jul 2019
@hashseed
- I need to check with my manager but there is no confidential information involved. There are a few keys that can be invalidated and replaced.
- Unfortunately, no. I am unable to recreate outside of a docker container much less with v8 standalone (of which I have no experience).
- I have used --expose-gc and explicitly called gc() on one minute intervals with no changes.
I will get back to you when I have an OK to provide you access; I'm happy to walk you through setting up and running the environment. Please advise if this is something that you can work with. And thanks for taking a look.
bmacnaughton
on 6 Jul 2019
@hashseed - i do have heapdumps from every 15 minutes of the last run available. If they help I will share them with an email of your choice - maybe your commit email?
bmacnaughton
on 6 Jul 2019
@hashseed - i can work on packaging the docker-compose environment and access if you can work with that. if you need a more minimal repro then it will have to wait - i'm on vacation starting wednesday. if you can work with that i'll get things packaged and set up so you can run it - my manager will work with you while i am away.
bmacnaughton
on 8 Jul 2019
I'd love to find out what's going on, but my bandwidth is a bit limited at this point. Having a reduced repro would definitely help me.
hashseed
on 8 Jul 2019
@hashseed - ok, thanks. i'm on vacation for the next couple weeks; i will work on putting together a self-contained repro when i get back. i appreciate your responses.
bmacnaughton
on 9 Jul 2019
FWIW it looks like we're having the same issue. Upgrading from Node 10.10 to 12.6 led to a ~0.5% heap/hour leak.
We have prototype_info: :: system / PrototypeInfo being very large as well, ~73mb.
We don't use cls-hooked; we do use ddtrace-js, which can use async hooks, however we've disabled its context propagation (caused too much overhead in node 10.10), so it should not be using the async-hook-jl library it uses to setup async hooks.
Here's a screenshot:
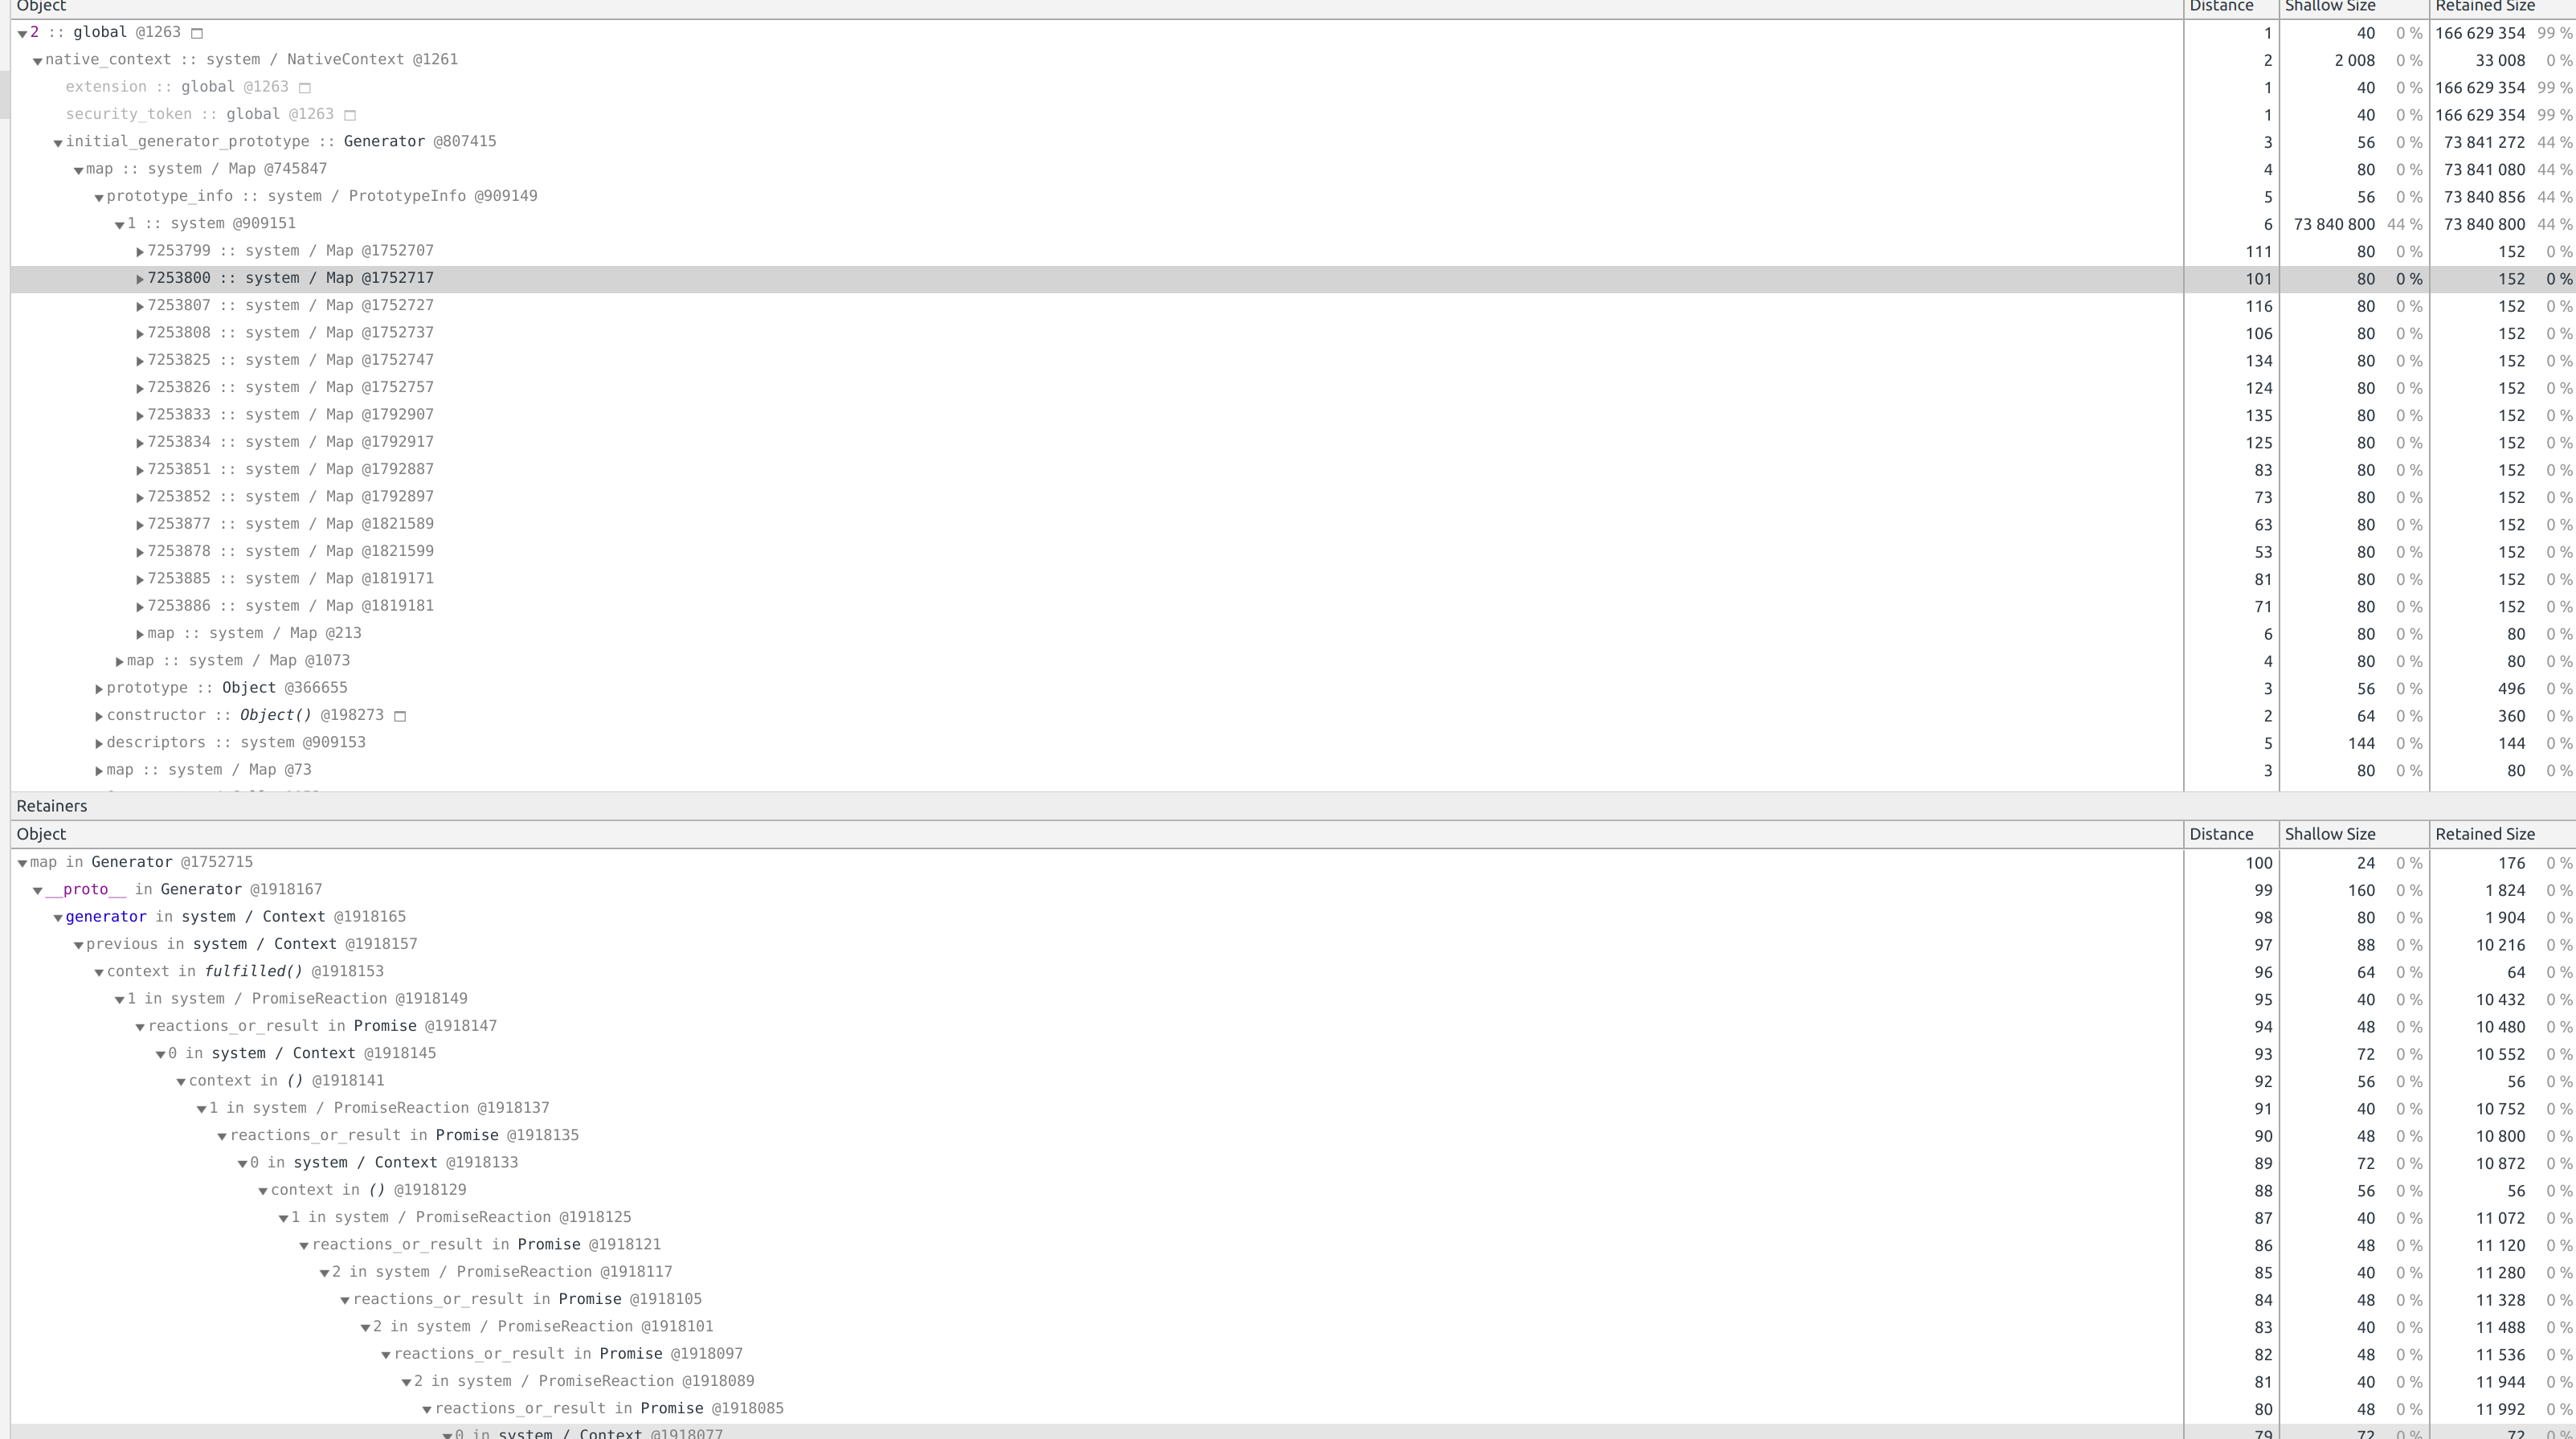
Lots of PromiseReaction / reactions_or_result in Promise nested deeply.
We have no package.json/yarn.lock changes between the node 10.10 (no leak) and node 12.6 (leak) deployments, so it shouldn't be due to any user code/libraries changing.
 stephenh
on 16 Jul 2019
stephenh
on 16 Jul 2019
This is what I see on v11.15.0 after roughly 3 minutes of running a benchmark that has some async/await code.
Curiously I only seem to be getting this memory leak when the inspector is running (but it might be hard to tell without it).
 laino
on 20 Jul 2019
laino
on 20 Jul 2019
The inspector uses (I believe) async_hooks. In any case, I'm back from vacation as of next week and will try to create an isolated test case.
@laino, @stephenh - if you have any particulars you can share they might be helpful. My particular benchmark involves quite a few moving pieces (a todo-server, a load generator, a reporter). We're instrumenting the todo-server (an simple express app).
@laino, can you verify that the memory leak was introduced in 11.15.1 (or specifically in this nightly build - v11.0.0-nightly20180908922a1b03b6)?
bmacnaughton
on 26 Jul 2019
@bmacnaughton no particulars that seem useful; but if anything rings a bell, it's a GraphQL server using apollo-server (not latest release) doing fairly mundane (but high volume) JSON HTTP calls to backends. It uses dataloader quite a bit, which does ~fancy event loop ticking/etc., but nothing with async hooks (pretty sure, b/c we saw a large perf regression when ddtrace initially enabled async hooks for its context propagation, but then we configured it not to do that, so I think we'd notice if it accidentally slipped back on)...
stephenh
on 26 Jul 2019
@bmacnaughton
My issue contains a minimal example: https://github.com/nodejs/node/issues/28787
We should probably figure out whether we're even looking at the same memory leak.
I also had this issue already on node version "11.15.0-1" (specifically from here).
laino
on 27 Jul 2019
Node 12.8.1: MemLeak reported by valgrind in node
==27557== 64 bytes in 1 blocks are still reachable in loss record 31 of 87
==27557==    at 0x4C29BC3: malloc (vg_replace_malloc.c:299)
==27557==    by 0x1825718: u_getTimeZoneFilesDirectory_64 (in /home/bjha/nodework/nodejs/bin/node)
==27557==    by 0x1877DDE: doOpenChoice(char const*, char const*, char const*, signed char (*)(void*, char const*, char const*, UDataInfo const*), void*, UErrorCode*) (in /home/bjha/nodework/nodejs/bin/node)
==27557==    by 0x18A8075: res_load_64 (in /home/bjha/nodework/nodejs/bin/node)
==27557==    by 0x186C5C2: init_entry(char const*, char const*, UErrorCode*) (in /home/bjha/nodework/nodejs/bin/node)
==27557==    by 0x186D13B: entryOpenDirect(char const*, char const*, UErrorCode*) (in /home/bjha/nodework/nodejs/bin/node)
==27557==    by 0x1872CFA: ures_openDirectFillIn_64 (in /home/bjha/nodework/nodejs/bin/node)
==27557==    by 0x16D56B2: icu_64::TimeZone::getTZDataVersion(UErrorCode&) (in /home/bjha/nodework/nodejs/bin/node)
==27557==    by 0x9FDDDD: node::Metadata::Versions::InitializeIntlVersions() (in /home/bjha/nodework/nodejs/bin/node)
==27557==    by 0x986B5B: node::InitializeNodeWithArgs(std::vector<std::string, std::allocator<std::string> >*, std::vector<std::string, std::allocator<std::string> >*, std::vector<std::string, std::allocator<std::string> >*) (in /home/bjha/nodework/nodejs/bin/node)
==27557==    by 0x9873D3: node::InitializeOncePerProcess(int, char**) (in /home/bjha/nodework/nodejs/bin/node)
==27557==    by 0x9876B2: node::Start(int, char**) (in /home/bjha/nodework/nodejs/bin/node)
==27557==    by 0x5C9F3D4: (below main) (in /usr/lib64/libc-2.17.so)
 bimalkjha
on 30 Aug 2019
bimalkjha
on 30 Aug 2019
@bimalkjha Not the same issue. Also, since it's from the per-process initialization phase, it's probably not a real memory leak - the memory is allocated once and reclaimed on exit.
 bnoordhuis
on 30 Aug 2019
bnoordhuis
on 30 Aug 2019
Ok. Thanks @bnoordhuis for the info.
bimalkjha
on 30 Aug 2019
We see the same memory leak with repetitive jumps in heap usage on multiple instances with Node.js v12.
Is there anything I can do to help with investigation?
Heap usage chart over about a week worth of work on 4 instances that constantly hit memory limit and are restarted by k8s after about the same time interval:
Heap statistics shortly before latest crash:
I have a heap snapshot saved and it looks similarly to attached above.
 nazar-pc
on 4 Sep 2019
nazar-pc
on 4 Sep 2019
@nazar-pc et al, i have been occupied with other issues but will be getting back to this next week. my first step will be to see if i reproduce the very simple test case that @laino reported. if i can then i'll try his very simple example with async_hooks added to it and hope that simple test case works. i won't get to it before next week so if you're able to that is one way to help.
either way, i appreciate your reporting the error - it seems that there is something going on here. but it looks like it's v8 related and that adds a level of complexity that i'm not conversant in.
bmacnaughton
on 6 Sep 2019
I've been trying to reproduce the leak using the simple application @laino created (https://github.com/nodejs/node/issues/28787) but have had no luck. i don't know how the debugger is using async_hooks so it's possible that i'm just doing something differently.
here's the simple program that i've run to try to reproduce the leak using #28787's basic logic - but it does not reproduce the memory leak shown in the graphs above. it's clearly too simple (or i've made a bad assumption somewhere) to reproduce either my app's or the debugger's use of async_hooks. i know that the debugger isn't using cls-hooked so that's one big difference but my application is using it so my thought was that the program could check two things at once.
i'm running the app in a docker container on node. my next step is to create a more complex application that adds more logic within the main() function to see if i can generate a memory leak. if anyone has ideas please let me know. this program is really simple because it was my hope that reproducing @laino's memory leak would be the fastest way to get there.
'use strict';

let message;
let hooks;
let runner;
let context;
if (process.argv.length > 2) {
  hooks = require('cls-hooked');
  message = 'with cls-hooked';
  context = hooks.createNamespace('leak-investigation');
  runner = context.runAndReturn.bind(context);
} else {
  message = 'without cls-hooked';
  runner = function (fn) {return fn()};
}
console.log('node', process.version, message);


let counter = 0;
async function noop() {
  return new Promise(resolve => setTimeout(resolve, 1));
};

const initial = process.memoryUsage();
let lastRss = initial.rss;

let lastWasDot = false;
const id = setInterval(function () {
  const current = process.memoryUsage();
  if (current.rss <= lastRss) {
    process.stdout.write('.');
    lastWasDot = true;
  } else {
    if (lastWasDot) {
      process.stdout.write('\n');
    }
    console.log(`[${counter}] rss ${current.rss}`);
    lastWasDot = false;
    lastRss = current.rss;
  }
}, 10000);

async function main () {
  while (true) {
    if (context) {
      if (context.get('something') !== 'anything') {
        console.log('oops, something is missing');
      }
    }
    counter += 1;
    await noop();
  }
}

async function mainWrapper () {
  if (context) {
    context.set('something', 'anything');
  }
  return main();
}

runner(mainWrapper).then(console.log('started'));
Maybe a long shot but would this be related at all https://github.com/nodejs/node/issues/28988, seems like @gabrielschulhof has found that there is a fix for that issue in a later v8 version.
 mhdawson
on 1 Oct 2019
mhdawson
on 1 Oct 2019
thanks for connecting the possibly related dots!
any idea when that version of v8 will make it into node? i'm happy to test against my big, ugly, messy, hard-to-package benchmark where i see the issue come up. i've been working on reproducing it in something simple but haven't had any luck. in the meantime i'll keep trying to repro in something packageable.
bmacnaughton
on 1 Oct 2019
I'm not sure yet but I'm hoping @gabrielf will comment in https://github.com/nodejs/node/issues/28988#issuecomment-536771453
mhdawson
on 3 Oct 2019
i have isolated the memory leak to using our agent on an application running mongodb-core v2. if i update mongodb-core to v3 there is no memory leak.
i know that's not exactly a reproducible case but i wanted to provide an update. maybe someone familiar with mongodb 2 => 3 changes will have a lightbulb go on.
i am able to work around this now, albeit by removing functionality for the problematic combination. disabling our instrumentation for the mongodb-core package removes the interplay of async_hooks, mongodb-core, and versions of node since v11.0.0-nightly20180908922a1b03b6 so it's clear that it's not mongodb-core by itself.
apparently there is some activity in mongodb-core regarding async_hooks: https://jira.mongodb.org/browse/NODE-1603
bmacnaughton
on 25 Oct 2019
@bmacnaughton are you using the mongodb-core driver directly or through abstraction layer such as Mongoose?
 amit777
on 7 Nov 2019
amit777
on 7 Nov 2019
there are two levels here - we instrument mongodb-core. so mongoose looks like
mongoose (patch) => mongodb (prior to v3.3.0) => mongodb-core (instrument)
mongoose (patch) => mongodb (v3.3.0+ instrument)
while we instrument mongodb-core we do patch some mongoose function in order to maintain context across queues and the like, e.g., addQueue, _wrapCallback, etc. by binding those functions to a async_hooks context. we don't instrument mongoose-level transactions or functions.
bmacnaughton
on 7 Nov 2019
I have written a simple code to reproduce the problem and submit an issue to google https://bugs.chromium.org/p/chromium/issues/detail?id=1030569
 likev
on 5 Dec 2019
likev
on 5 Dec 2019
@likev thanks for reproduction code! I've created v8 issue: https://bugs.chromium.org/p/v8/issues/detail?id=10057
It seems we observe this memory leak issue in TypeGraphQL(?) code in our backend.
Slightly modified repro code (node 12, 13 will OOM after a few minutes):
const leakMemory = () => {
  class Leak{
    constructor(){this.unused();}
    unused(){}
  }
  new Leak();
};

setInterval(function(){
  for(let i = 0; i < 1000000; i++) {
    leakMemory();
  }
  console.log(Object.entries(process.memoryUsage()).map(([k,v])=>`${k}: ${(v/1024/1024).toFixed()}`).join(' '));
}, 1);
 alex3d
on 13 Dec 2019
alex3d
on 13 Dec 2019
V8 8.1.39 with the commit https://github.com/v8/v8/commit/d3a1a5b6c4916f22e076e3349ed3619bfb014f29 have fixed it.
likev
on 18 Dec 2019
@alex3d this memory leak is still present in the latest LTS branch!! (12-alpine docker image)
omg... we had so much trouble in the past...
changed back to node 10, fixed problems.
 ericrange
on 23 Jan 2020
ericrange
on 23 Jan 2020
also in version 13, the problem seems to be fixed
ericrange
on 23 Jan 2020
Looks like the fix in v8 was cherry-picked in #31005.
 ggoodman
on 23 Jan 2020
ggoodman
on 23 Jan 2020
v12.15.0 to be released soon will include the fix.
 ruiaraujo
on 23 Jan 2020
ruiaraujo
on 23 Jan 2020
Is there an ETA on publishing 12.15.0? We're running into this now, and it would be awesome if this was published soon!
 bencripps
on 28 Jan 2020
bencripps
on 28 Jan 2020
@bencripps Any time now, it is scheduled for 2020-01-28 https://github.com/nodejs/node/blob/v12.15.0-proposal/doc/changelogs/CHANGELOG_V12.md#2020-01-28-version-12150-erbium-lts-targos
alex3d
on 28 Jan 2020
We're going to delay 12.15.0 until a week after the upcoming security releases: https://github.com/nodejs/Release/issues/494#issuecomment-578779532
 richardlau
on 28 Jan 2020
richardlau
on 28 Jan 2020
Has this issue been resolved in Node >=12.15.0? Can we close this issue?
 woodb
on 12 Feb 2020
woodb
on 12 Feb 2020
Node 12.16.0 includes the fix. This issue can be closed.
ruiaraujo
on 12 Feb 2020
the leak that i was seeing appears to be closed as well, so it appears to be the same thing.
bmacnaughton
on 14 Feb 2020
@likev - how is it that you isolated the leak to the precise test case? i ask because i only saw it in a large system and wasn't able to isolate it.
bmacnaughton
on 14 Feb 2020
@likev - how is it that you isolated the leak to the precise test case? i ask because i only saw it in a large system and wasn't able to isolate it.
ohh, I observed the leak in my own small project and isolated the leak is surely rather hard with lucky.
likev
on 18 Feb 2020
Looks like the leak has been resolved in our application as well. Upon deploying 12.16.0 memory growth has remained steady for the past 2 weeks.
bencripps
on 26 Feb 2020
Hello, I believe this issue may still exist in one form or another in Node 12.16.1. We've observed an increasing memory usage after upgrading a production system to Node 12. The reason I believe it may be related to this issue is we're seeing the exact same 110761200 bytes of memory used in system objects.

We also attempted an upgrade to Node 13, but we are still seeing a similar leaky behavior:

We don't have a minimal repro unfortunately because we are only able to exhibit this behavior on a fairly large application. It also seems to be related to the volume of work/concurrency in the program as we are unable to reproduce in staging environments.
Also likely causing https://github.com/googleapis/cloud-debug-nodejs/issues/811.
 achille-roussel
on 14 Apr 2020
achille-roussel
on 14 Apr 2020
Related issues
 mcollina
·
3Comments
mcollina
·
3Comments
 danialkhansari
·
3Comments
danialkhansari
·
3Comments
 danielstaleiny
·
3Comments
danielstaleiny
·
3Comments
 cong88
·
3Comments
cong88
·
3Comments
 stevenvachon
·
3Comments
stevenvachon
·
3Comments
Most helpful comment
Thanks for the report!
I agree, looking at e917a23d2e...922a1b03b6 that seems like the only reasonable source of issues – and V8 updates are big changes, so this is likely the culprit.
I agree :+1: That valgrind shows nothing of interest makes it less likely that this is a memory leak in C++, so that’s already helpful.
The fact that this is unlikely to be a C++ memory leak makes it more likely that this is one in JS; valgrind doesn’t track memory allocated using
mmap()& co. by default, which is what V8 uses for the JS heap.First, if possible, it would be good to verify that this is the case.
process.memoryUsage(),require('v8').getHeapStatistics()andrequire('v8').getHeapSpaceStatistics()all provide potentially useful information about the memory region in which the leak occurs.Secondly, if possible, taking heap dumps at different points in time and comparing then in Chrome DevTools should help a lot with figuring out what objects are being retained and why, if this is a JS memory leak. For taking heap dumps you can use e.g. https://www.npmjs.com/package/heapdump, or, if that’s more convenient, directly attach DevTools to the process.
Given that this is likely a V8 bug, you may want to run the process with
--expose-gcand manually performglobal.gc()calls from time to time – you obviously shouldn’t do this in production, and it’s unlikely to be helpful, but if it is, then we know it’s likely an issue with V8 detecting when to run GC, and not a real memory leak, which would also be helpful.Finally, it would also be good to know if a more recent version of Node.js (e.g. current nightlies) has the same issue. V8 issues are often caught and later addressed, and it may be the case that the solution is to figure out which V8 commit fixed this issue and then backport that to the relevant Node.js versions.
If this does turn out to be an issue with one of the C++ parts (e.g. by seeing an increase in RSS but not the heap as reported by
process.memoryUsage()), it can still be useful to take heap dumps and compare them; I would expect that most resources allocated by addons are either tied to JS objects or would be reported by valgrind.I hope this helps!