Instead of the label appearing over a bar on a bar chart, is there a way to adjust the label position so that it is above the bar?
 joergd
All 24 comments
This would also help when the bar columns are so short that they no longer get labelled. If the labels could be placed above the bar columns - then at least they can still be labelled and the label ends up in the chart areas as opposed to either not at all or on the x-axis.
joergd
on 9 Feb 2018

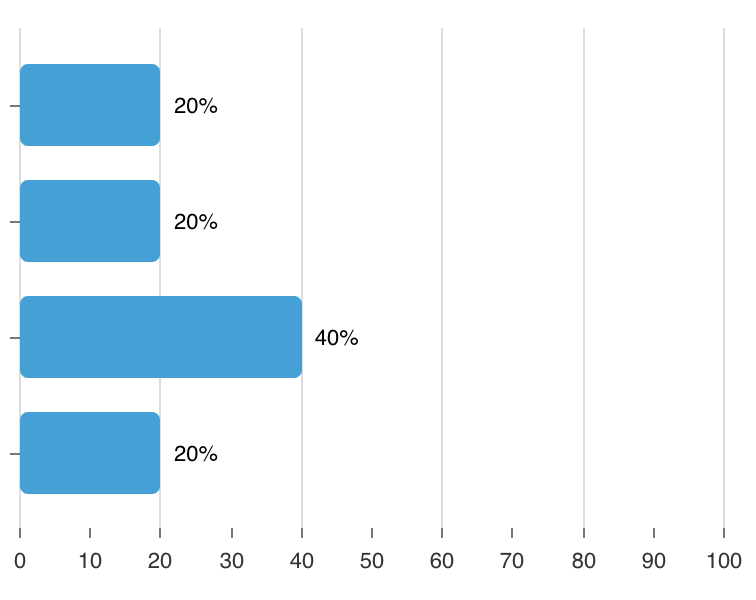
The "missing" values are < 4 in the case - But I do need them on the graph ...
joergd
on 9 Feb 2018
I also would like to do this.
 pvjones
on 11 Feb 2018
pvjones
on 11 Feb 2018
Here's how this can be done:
labelFormat: d => <tspan y={ 0 }>{ d }</tspan>

 stahlmanDesign
on 13 Feb 2018
stahlmanDesign
on 13 Feb 2018
Ah great - thank you - that worked for me!
Although I now get a warning in my browser:
Warning: Failed prop type: Invalid prop `label` supplied to `BarItem`.
@stahlmanDesign Thanks this looks promising. From what I can tell, labelFormat just gets passed the numeric value of the current datum. Is there a way to get the entire datum (including both id and value) so that I can perform a lookup and modify the return based on other context?
For example, colorBy gets an entire datum as its argument. (Personally I think it would be nice if all of the callback functions uniformly received the entire datum so that the user could do whatever they want with the information.)
I tried looking into the component, and it looks like there might be a getLabel prop, but it doesn't seem to be doing anything when I pass it a callback.
Thanks for your time!
pvjones
on 13 Feb 2018
Is there a way to get the entire datum (including both id and value)... For example, colorBy gets an entire datum as its argument... so that the user could do whatever they want with the information
+1 Yes this would solve a lot of problems if for example your could do this
labelFormat: (value, id, data)=> value + data[`${id}MyDescription`] // 4 stars
I also talked about this here
stahlmanDesign
on 13 Feb 2018
The prop type warning has been fixed by https://github.com/plouc/nivo/commit/4152c0906849aa53ef4fa311aa2a66a16402e9d8
 plouc
on 25 Aug 2018
plouc
on 25 Aug 2018
I close this issue and will consider https://github.com/plouc/nivo/issues/154 as it could be quite useful.
plouc
on 26 Aug 2018
How can I instead put labels to bottom of every bar?
 arturtakoev
on 23 Oct 2018
arturtakoev
on 23 Oct 2018
Ah great - thank you - that worked for me!
Although I now get a warning in my browser:
Warning: Failed prop type: Invalid prop `label` supplied to `BarItem`.
HI, I have the same problem, because label expect a string and not a function.
 germanfleitas
on 26 Nov 2018
germanfleitas
on 26 Nov 2018
How do you place the label on the right on a horizontal bar chart? how can I get the x value based on the bar width?
 monishagunalan
on 3 Oct 2019
monishagunalan
on 3 Oct 2019
Also trying to get the labels to format to the right of a horizontal bar chart. Using x and y values but want them to be dynamic.
 qasim-glidewell
on 4 Dec 2019
qasim-glidewell
on 4 Dec 2019
Also trying to get a value to feed to x to get the horizontal bar chart values at the end of the bar. It worked brilliantly on the vertical bar chart.
 ldmcdaniel
on 11 Dec 2019
ldmcdaniel
on 11 Dec 2019
Did you try to add a new layer as explained here https://github.com/plouc/nivo/issues/582#issuecomment-499530645 ?
 Eld0ud
on 16 Jan 2020
Eld0ud
on 16 Jan 2020
Here's how this can be done:
labelFormat: d => <tspan y={ 0 }>{ d }</tspan>
Did the output of labelFormat not used to be string | number? Did this ever work for anyone? With this prop setup ...
<BarChart data={chartData} labelFormat={d => <tspan y={0}>{d}</tspan>} />
... typescript complains about the output of the labelFormat function not being a string or number, which makes sense since the output of that function is a JSX Element. What method are people using to place labels on top of a chart today?
 trymbill
on 21 Jan 2020
trymbill
on 21 Jan 2020
Just in case someone else ends up on this issue, this is how I placed the labels on top of each bar:
const BarComponent = ({ x, y, width, height, color, label }: BarItemProps) => {
  return (
    <g transform={`translate(${x}, ${y})`}>
      <rect
        width={width}
        height={height}
        fill={color}
        strokeWidth="0"
        stroke="white"
      />

      <text
        x={width / 2}
        y={-15} // the important bit!!
        textAnchor="middle"
        dominantBaseline="central"
        style={{
          fontSize: 12,
          pointerEvents: 'none',
          fill: 'white',
          opacity: 0.75,
        }}
      >
        {label}
      </text>
    </g>
  );
};

<BarChart
  data={chartData}
  barComponent={BarComponent}
  margin={{ top: 20, right: 0, bottom: 60, left: 0 }}
/>
Just in case someone else ends up on this issue, this is how I placed the labels on top of each bar:
Very good idea. I don't think custom bar items were supported when I originally answered this question with a tspan in labelFormat. Even if they were, I didn't think of using them this way.
stahlmanDesign
on 22 Jan 2020
FYI, @trymbill's solution doesn't support tooltips.
 pietmichal
on 23 Mar 2020
pietmichal
on 23 Mar 2020
Did anybody ever manage to get it to work, placing labels at the right of horizontal bars?
 bencohen2
on 15 Apr 2020
bencohen2
on 15 Apr 2020
Here's how this can be done:
labelFormat: d =>
^^ This worked for me but I had to fool the Typescript compiler with this :/
labelFormat={
    labelValue => (
        (<tspan y={-8}>{labelValue}</tspan>) as unknown
    ) as string
}
 eggei
on 19 Aug 2020
eggei
on 19 Aug 2020
Here's how this can be done:
labelFormat: d => <tspan y={ 0 }>{ d }</tspan>
This worked perfectly for me. Thanks!
 nibble-4bits
on 25 Aug 2020
nibble-4bits
on 25 Aug 2020
for horizontal bars:
labelFormat={d =>
where 160 is marginLeft + marginRight,
5 is by how much label should be shifted from the bar
 noisysky
on 9 Sep 2020
noisysky
on 9 Sep 2020
@noisysky thanks for your example. How did you get width?
 vgotsuliak
on 25 Sep 2020
vgotsuliak
on 25 Sep 2020
Related issues
 luisrudge
·
3Comments
luisrudge
·
3Comments
 vagnervst
·
4Comments
vagnervst
·
4Comments
 zhe1ka
·
3Comments
zhe1ka
·
3Comments
 knackjax
·
3Comments
stahlmanDesign
·
3Comments
knackjax
·
3Comments
stahlmanDesign
·
3Comments
Most helpful comment
Here's how this can be done:

labelFormat: d => <tspan y={ 0 }>{ d }</tspan>