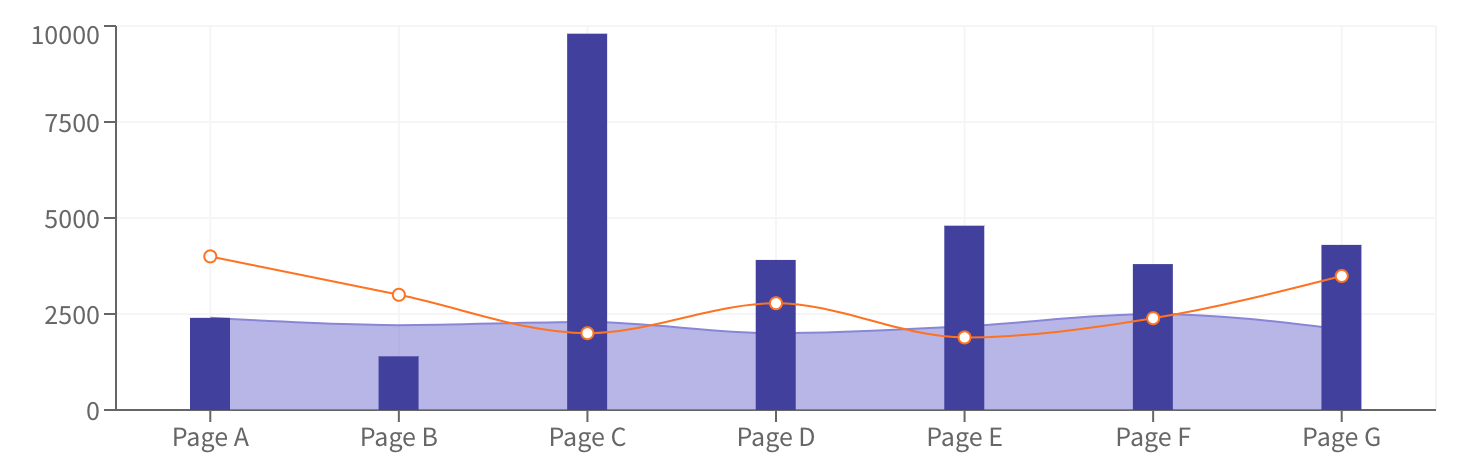
Can I compose two different charts into one?
Like for example drawing a line in a bar chart.
 ellipticaldoor
All 25 comments
I recently asked the same thing and then answer is 'not right now' https://twitter.com/jstahlman/status/939260265618706435
 stahlmanDesign
on 31 Jan 2018
stahlmanDesign
on 31 Jan 2018
I've started something on https://github.com/plouc/nivo/pull/116, but it involves far more work than I expected :/, I'm planning to re-introduce this in a more progressive way.
 plouc
on 1 Feb 2018
plouc
on 1 Feb 2018
@plouc what is the progress now?
 wulucxy
on 12 Sep 2018
wulucxy
on 12 Sep 2018
@stahlmanDesign @ellipticaldoor do you guys solve this problem?
wulucxy
on 13 Sep 2018
Unfortunately, there is no proper guides on how to do it, but if you have a look at the code for each component, you could be able to build composed charts.
Main chart components are build on smaller components, axes, containers, nodes…
I'm also adding layout components, which will also help.
plouc
on 13 Sep 2018
@plouc so where I can find the layout Component?
wulucxy
on 13 Sep 2018
I'm adding some, for example https://github.com/plouc/nivo/blob/master/packages/parallel-coordinates/src/ParallelCoordinatesLayout.js.
plouc
on 13 Sep 2018
For now, the best you can do is having a look at the components and extract the relevant pieces, not really handy I admit :/
plouc
on 13 Sep 2018
I've started to introduce a layers property which allows to pass extra layers and also to change the order of elements.
For now, it's supported on Bar and ScatterPlot components. You can find a working example of it here using the ScatterPlot component.
If you're willing to contribute on other components, please do not hesitate :)
plouc
on 27 Nov 2018
Oh, great! I'll try to take a look at adding layers to Line today, following this commit that added it to Bar (https://github.com/plouc/nivo/commit/8a817ec9b632740457546aca65fb3f09c8f9ffa3#diff-5799e61b0b5bfcb7468aee7a5406e61a). If there's a better thing for me to look at, let me know!
 ncknuna
on 27 Nov 2018
ncknuna
on 27 Nov 2018
And now, thanks to @ncknuna, we have layers support for Line component too!
plouc
on 28 Nov 2018
For now, it's supported on Bar and ScatterPlot components. You can find a working example of it here using the ScatterPlot component.
Has anyone got a link similar to the ScatterPlot one to some code showing a custom layer in use on the Bar component?
 pfreedmanJG
on 6 Dec 2018
pfreedmanJG
on 6 Dec 2018
Ok, here is an example I've written that is vaguely similar to what OP wanted.
pfreedmanJG
on 6 Dec 2018
Thank you @pfreedmanJG! I've used your example as a base to reproduce what @ellipticaldoor wanted to achieve => https://codesandbox.io/s/m4ro13jjn8
plouc
on 6 Dec 2018
@plouc That's great, I was wondering how to get circles rendering on top of the points!
pfreedmanJG
on 6 Dec 2018
@plouc sorry for the slight off-topic, but why your codepen example only works if x value contains series of integers "0", "1", etc. If I change it to anything but integers it breaks inside xScale(index).
 yojeek
on 12 Feb 2019
yojeek
on 12 Feb 2019
@yojeek, because the bar chart only supports ordinal values for now, other charts (line, scatterplot) support other types like linear/time/log scales.
plouc
on 12 Feb 2019
@yojeek, sorry I don't respond to emails, please use GitHub instead. I had a look at the example, and fixed it => https://codesandbox.io/s/zrk1o3j29p, the problem was the use of bar.data.index instead of bar.data.indexValue.
plouc
on 12 Feb 2019
@plouc are you giving supporting other @nivo components as Layers instead of D3?
 EduardoAC
on 12 Feb 2019
EduardoAC
on 12 Feb 2019
@plouc Would it be best to support an entirely new Composite chart container instead of making Bar chart as the primary container? So it controls the layers and knows what layers to strip off from the inner charts. There might be other benefits.
 simoami
on 28 May 2019
simoami
on 28 May 2019
@simoami, some charts supports the same layer ids, but contains different things, but not every chart share the same layers as others. Also nivo provides specific packages for each chart type, and this approach assumes that all chart types are installed.
plouc
on 29 May 2019
Thanks @plouc. I was just throwing an idea in case it offers a predictable composition. To not be aware of charts, you could have an explicit declaration. <CompositeChart><Chart1 /><Chart2 /></CompositeChart>. Then the composite chart can share a layer service that the inner charts can choose to support. Something react contexts can help with.
simoami
on 2 Jun 2019
@plouc is it possible to add tooltip to Line chart in such approach?
 VolodymyrKornetskyi
on 15 Sep 2020
VolodymyrKornetskyi
on 15 Sep 2020
@plouc same question as above, is there a way to make the tooltips show up for both the bar and line chart?
In my case preferably in a single tooltip box, with all graphed Y values for the current X value.
@VolodymyrKornetskyi did you have any luck solving that?
 andreas-ateles
on 2 Dec 2020
andreas-ateles
on 2 Dec 2020
@andreas-ateles you could probably achieve this in your custom layer, you could for example use the useTooltip() hook from @nivo/tooltip to display some extra tooltips.
plouc
on 2 Dec 2020
Related issues
 cedmax
·
4Comments
cedmax
·
4Comments
 Haaziq-Uvais
·
3Comments
ellipticaldoor
·
4Comments
Haaziq-Uvais
·
3Comments
ellipticaldoor
·
4Comments
 barnapisti1994
·
3Comments
barnapisti1994
·
3Comments
 Buvaneshkumar7
·
3Comments
Buvaneshkumar7
·
3Comments
Most helpful comment
Thanks @plouc. I was just throwing an idea in case it offers a predictable composition. To not be aware of charts, you could have an explicit declaration.
<CompositeChart><Chart1 /><Chart2 /></CompositeChart>. Then the composite chart can share a layer service that the inner charts can choose to support. Something react contexts can help with.