We use the Line component to render timeseries data (~1000 samples on the x-axes) and would like to have a limited (~10) number of labels and gridlines on the x-axes.
Is this possibe and what would be the best we to do this?
 ericvrp
All 11 comments
@ericvrp, unfortunately it's not possible as the pointScale used for x axis does not support ticks override.
 plouc
on 17 Oct 2017
plouc
on 17 Oct 2017
That is rather disappointing and makes this whole beautiful package seem unusable for high resolution data.
Can we maybe hack around this limitation by using css (or set style or special value per x-value) to hide all lines and labels that we do not want to see?
Or have x-values set to undefined (and generate an x-value based on the array index automatically) when no gridline or label is required.
ericvrp
on 17 Oct 2017
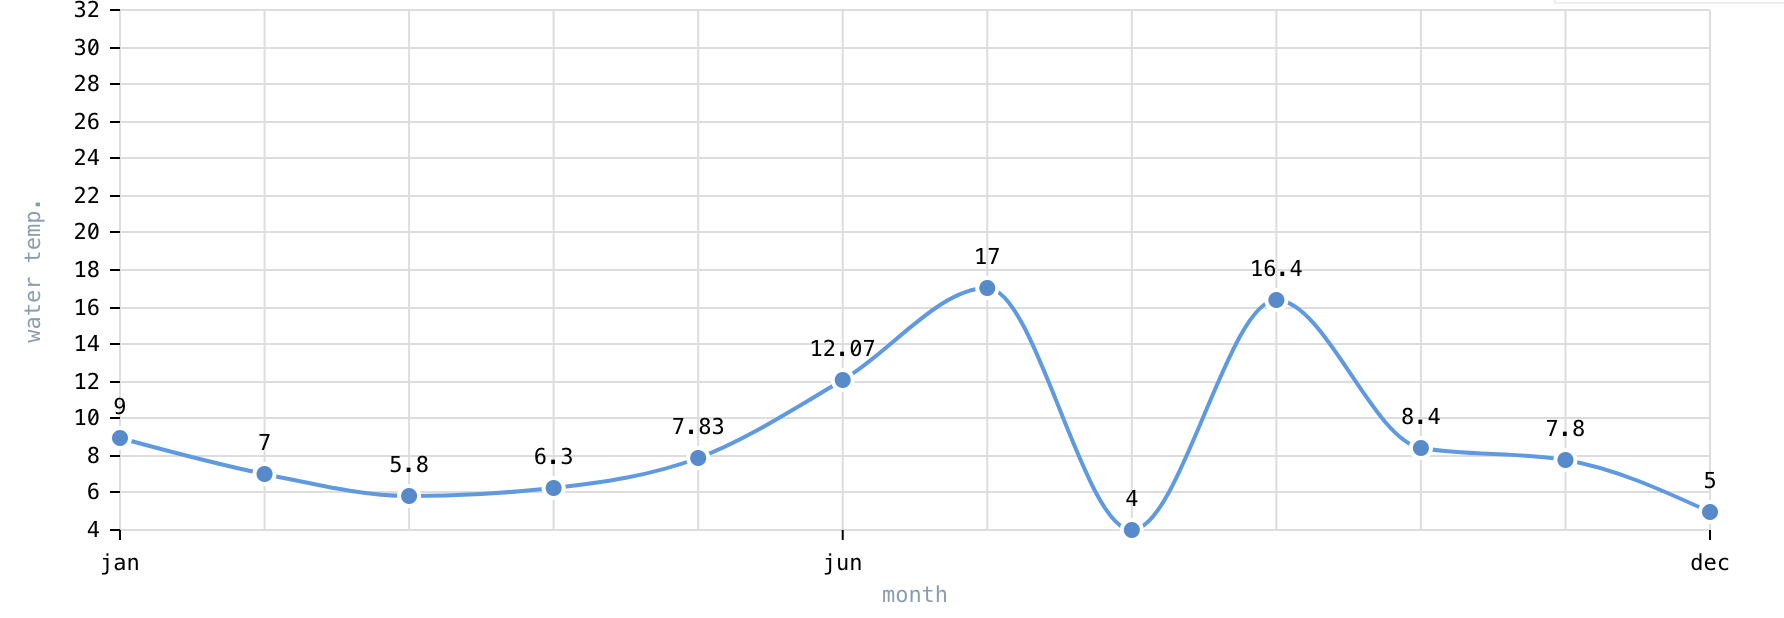
I made a quick test, you can use tickValues property on the xAxis (axisTop or axisBotttom)
plouc
on 18 Oct 2017
axisBottom={{
    tickValues: ['jan', 'jun', 'dec']
}}
But the grid does not support this
plouc
on 18 Oct 2017
I've created an issue for the grid to add same functionality https://github.com/plouc/nivo/issues/73, but I have no time for side projects for now. If you're willing to contribute, the logic from Axis must be applied to Grid related components.
plouc
on 18 Oct 2017
Thank you! I think I currently lack the knowledge to add this to the grid components.
I have tried the tickValues solution but this does not work for me at the moment. The names of the months are on the left and I get this trackback...
Warning: Failed prop type: The prop `x` is marked as required in `AxisTick`, but its value is `undefined`.
    in AxisTick (created by TransitionMotion)
    in TransitionMotion (created by Axis)
    in g (created by Axis)
    in Axis (created by pure(Axis))
    in pure(Axis) (created by withPropsOnChange(pure(Axis)))
    in withPropsOnChange(pure(Axis)) (created by withPropsOnChange(withPropsOnChange(pure(Axis))))
    in withPropsOnChange(withPropsOnChange(pure(Axis))) (created by defaultProps(withPropsOnChange(withPropsOnChange(pure(Axis)))))
    in defaultProps(withPropsOnChange(withPropsOnChange(pure(Axis)))) (created by Axes)
    in g (created by Axes)
    in Axes (created by shouldUpdate(Axes))
    in shouldUpdate(Axes) (created by Container)
    in g (created by SvgWrapper)
    in svg (created by SvgWrapper)
    in SvgWrapper (created by Container)
    in div (created by Container)
    in Container (created by Line)
    in Line (created by pure(Line))
    in pure(Line) (created by withPropsOnChange(pure(Line)))
    in withPropsOnChange(pure(Line)) (created by withPropsOnChange(withPropsOnChange(pure(Line))))
    in withPropsOnChange(withPropsOnChange(pure(Line))) (created by withPropsOnChange(withPropsOnChange(withPropsOnChange(pure(Line)))))
    in withPropsOnChange(withPropsOnChange(withPropsOnChange(pure(Line)))) (created by withPropsOnChange(withPropsOnChange(withPropsOnChange(withPropsOnChange(pure(Line))))))
    in withPropsOnChange(withPropsOnChange(withPropsOnChange(withPropsOnChange(pure(Line))))) (created by defaultProps(withPropsOnChange(withPropsOnChange(withPropsOnChange(withPropsOnChange(pure(Line)))))))
    in defaultProps(withPropsOnChange(withPropsOnChange(withPropsOnChange(withPropsOnChange(pure(Line)))))) (created by withPropsOnChange(defaultProps(withPropsOnChange(withPropsOnChange(withPropsOnChange(withPropsOnChange(pure(Line))))))))
    in withPropsOnChange(defaultProps(withPropsOnChange(withPropsOnChange(withPropsOnChange(withPropsOnChange(pure(Line))))))) (created by defaultProps(withPropsOnChange(defaultProps(withPropsOnChange(withPropsOnChange(withPropsOnChange(withPropsOnChange(pure(Line)))))))))
    in defaultProps(withPropsOnChange(defaultProps(withPropsOnChange(withPropsOnChange(withPropsOnChange(withPropsOnChange(pure(Line)))))))) (created by withPropsOnChange(defaultProps(withPropsOnChange(defaultProps(withPropsOnChange(withPropsOnChange(withPropsOnChange(withPropsOnChange(pure(Line))))))))))
    in withPropsOnChange(defaultProps(withPropsOnChange(defaultProps(withPropsOnChange(withPropsOnChange(withPropsOnChange(withPropsOnChange(pure(Line))))))))) (created by defaultProps(withPropsOnChange(defaultProps(withPropsOnChange(defaultProps(withPropsOnChange(withPropsOnChange(withPropsOnChange(withPropsOnChange(pure(Line)))))))))))
    in defaultProps(withPropsOnChange(defaultProps(withPropsOnChange(defaultProps(withPropsOnChange(withPropsOnChange(withPropsOnChange(withPropsOnChange(pure(Line)))))))))) (created by withPropsOnChange(defaultProps(withPropsOnChange(defaultProps(withPropsOnChange(defaultProps(withPropsOnChange(withPropsOnChange(withPropsOnChange(withPropsOnChange(pure(Line))))))))))))
    in withPropsOnChange(defaultProps(withPropsOnChange(defaultProps(withPropsOnChange(defaultProps(withPropsOnChange(withPropsOnChange(withPropsOnChange(withPropsOnChange(pure(Line))))))))))) (created by enhance(Line))
    in enhance(Line) (created by _class2)
    in _class2 (created by ExploreTimelines)
    in ExploreTimelines (created by Connect(ExploreTimelines))
    in Connect(ExploreTimelines) (created by MuiComponent)
    in MuiComponent (created by RouterContext)
    in div (created by App)
    in section (created by App)
    in MuiThemeProvider (created by App)
    in App (created by Connect(App))
    in Connect(App) (created by RouterContext)
    in RouterContext (created by Router)
    in Router
    in Provider
@ericvrp, you must pass values which exist in your current dataset, otherwise their position cannot be computed.
plouc
on 18 Oct 2017
For my example I used this:
{
    id:   'waterTemp',
    data: [
        {
            x: 'jan',
            y: 9,
        },
        {
            x: 'feb',
            y: 7,
        },
        {
            x: 'mar',
            y: 5.8,
        },
        {
            x: 'apr',
            y: 6.3,
        },
        {
            x: 'may',
            y: 7.83,
        },
        {
            x: 'jun',
            y: 12.07
        },
        {
            x: 'jul',
            y: 17,
        },
        {
            x: 'aug',
            y: 4,
        },
        {
            x: 'sep',
            y: 16.4
        },
        {
            x: 'oct',
            y: 8.4
        },
        {
            x: 'nov',
            y: 7.8
        },
        {
            x: 'dec',
            y: 5,
        }
    ]
}
Ah yes, that was a bit silly of me. Yet another point for not coding at 3am.
ericvrp
on 18 Oct 2017
Does the tickValues override work on the Stream component? When I use equivalent code to your example it still just renders the default ticks (i.e. 0,1,2,...)
 shtam
on 27 Oct 2017
shtam
on 27 Oct 2017
Related issues
 dubzzz
·
3Comments
dubzzz
·
3Comments
 danpettay
·
3Comments
danpettay
·
3Comments
 gcloeval
·
3Comments
gcloeval
·
3Comments
 ellipticaldoor
·
4Comments
ellipticaldoor
·
4Comments
 Buvaneshkumar7
·
3Comments
Buvaneshkumar7
·
3Comments
Most helpful comment