Ngx-charts: Area Chart regression, the y axis is in the middle instead of being aligned to the bottom
Describe the bug
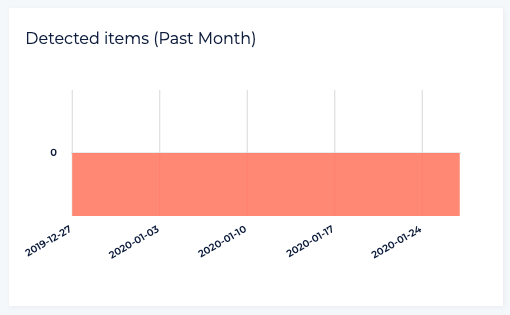
When using area-chart with the y axis = 0 (or any other const value), the line of the y axis is in the middle instead of being aligned to the bottom
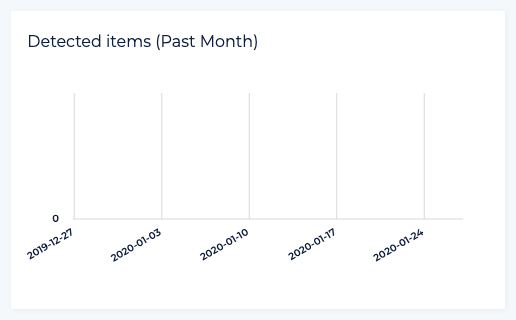
It worked well in version 12.1.0:
Issue started with upgrading to version 13.0.1 (as well 13.0.2, but I didn't tried 13.0.0):
To Reproduce
Steps to reproduce the behavior:
- Create area-chart
- Use the same number for the y axis for all the points
Expected behavior
The Y axis should be aligned to the bottom
 Akuka
Akuka
All 5 comments
Reproduced with other chart-components has y axis (13.0.1).
e.g. ngx-charts-bar-vertical

 Minejima
on 1 Apr 2020
Minejima
on 1 Apr 2020
Reverting commit d196e94deb54d910ee59567c5b96bab7fc607a36 , it works fine.
Issue with the version of d3js?
Minejima
on 1 Apr 2020
It seems to be due to upgrading d3-scale version.
d3-scale v2.0.0 later:
When the domain value becomes [0, 0], the offset of axis-tick calculated by scaleLinear.range() is halved.
Can I downgrade the d3-scale version for fix ?
Please give me a review :D
Minejima
on 2 Apr 2020
Is there any workaround for this in the meantime? Ran into this issue as well.
Thanks for the awesome library!
 btroncone
on 14 Apr 2020
btroncone
on 14 Apr 2020
Any updates on this? Facing the same issue. Thanks!
 athakur89
on 10 Nov 2020
athakur89
on 10 Nov 2020
Related issues
 zpydee
·
20Comments
zpydee
·
20Comments
 molot1989
·
25Comments
molot1989
·
25Comments
 sjdemoor
·
20Comments
sjdemoor
·
20Comments
 kkakroo
·
21Comments
kkakroo
·
21Comments
 WoMayr
·
21Comments
WoMayr
·
21Comments
Most helpful comment
It seems to be due to upgrading d3-scale version.
d3-scale v2.0.0 later:
When the domain value becomes [0, 0], the offset of axis-tick calculated by scaleLinear.range() is halved.
Can I downgrade the d3-scale version for fix ?
Please give me a review :D