Ngx-charts: Line chart timeline doesn't seem to work / doesn't tell me if I'm doing something wrong
I'm submitting a ... (check one with "x")
- [X] bug report - search github for a similar issue or PR before submitting
- [ ] feature request
- [ ] support request - use StackOverflow (add the
ngx-chartstag) or the gitter chat for support questions
Current behavior
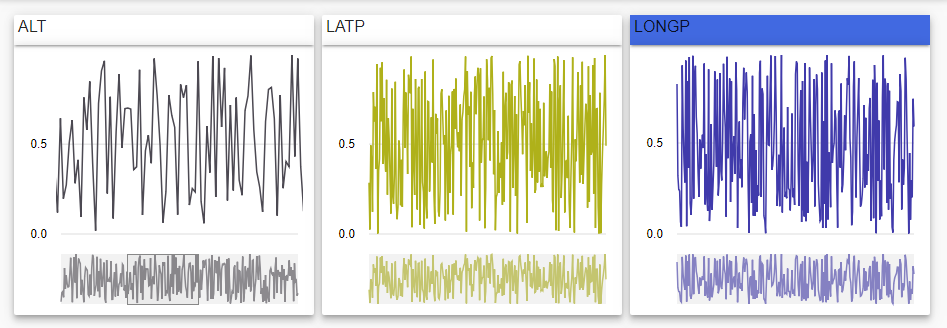
Timeline doesn't show up for seemingly no reason at all. Even if the timeline isn't showing up because I've done something wrong, something still needs to be fixed here since there are no errors in the console at all.

Note: The large white space below each chart is where the timeline should be in case that wasn't obvious.
Expected behavior
The timeline shows up when I want it to show up.
Reproduction of the problem
I have no idea how to reproduce this. It was working when there was no data on the chart, but the moment I put data in it, nothing.
What is the motivation / use case for changing the behavior?
The timeline should work how it is "advertised" to work.
Please tell us about your environment:
Windows 10 & Custom Linux
ngx-charts version: 8.1.0
Angular version: 6.0.3
Browser: [all | Chrome XX | Firefox XX | IE XX | Safari XX | Mobile Chrome XX | Android X.X Web Browser | iOS XX Safari | iOS XX UIWebView | iOS XX WKWebView ]
Language: [all | TypeScript X.X | ES6/7 | ES5]
 cole21771
All 19 comments
So it seems as though the issue was that the name attributes of each data point cannot be strings, and even though that issue is fixed after converting them to numbers (date in ms), I have found another issue. The chart should still put a warning in the console if you've enabled timeline and the data you're feeding it is not valid for timeline.
New bug / issue:
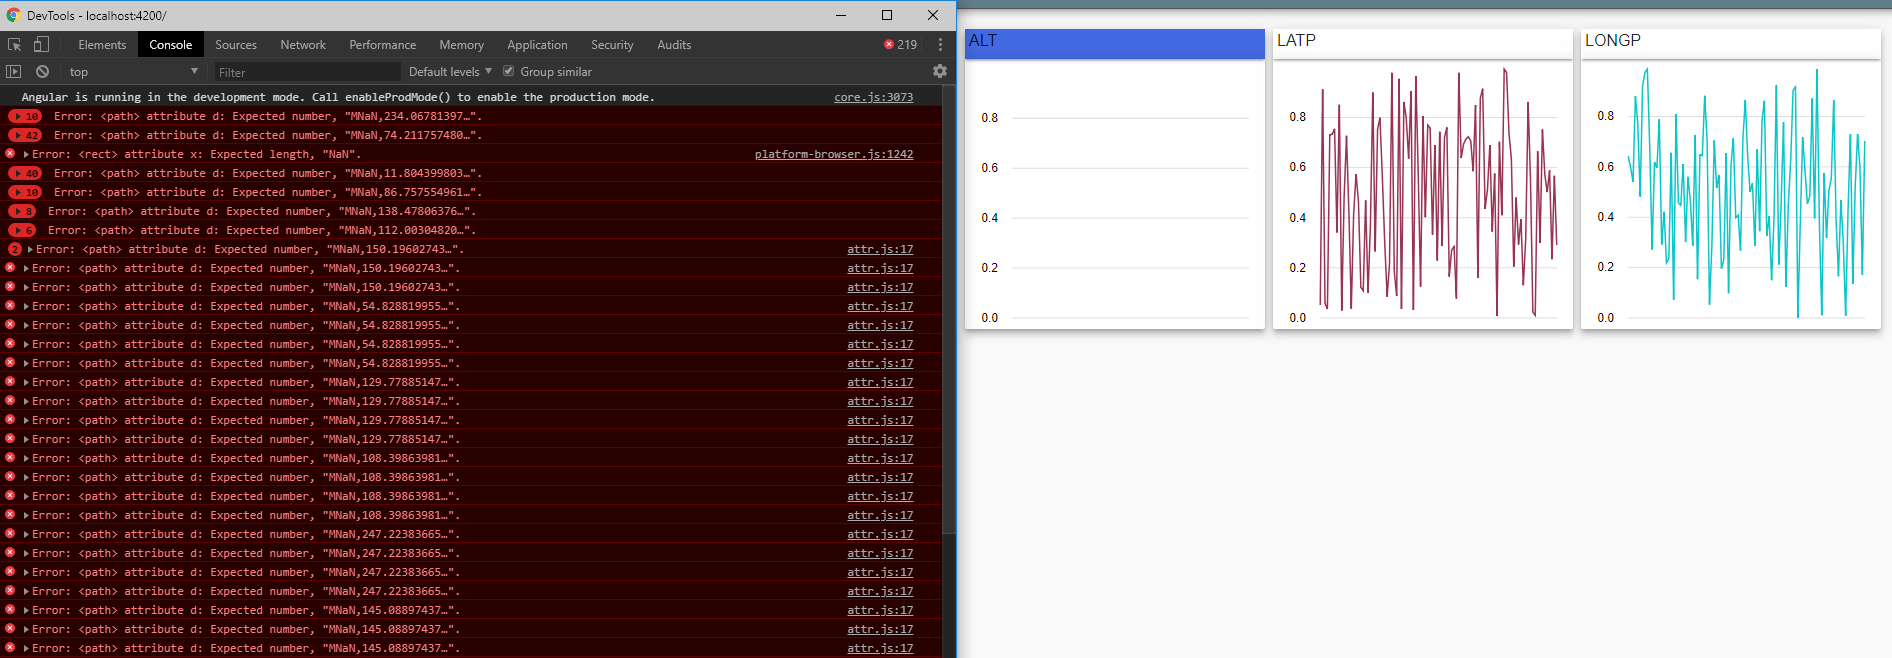
If you mess with the timeline and then change the graph data to something completely different, it messes with the xscale of the graph.
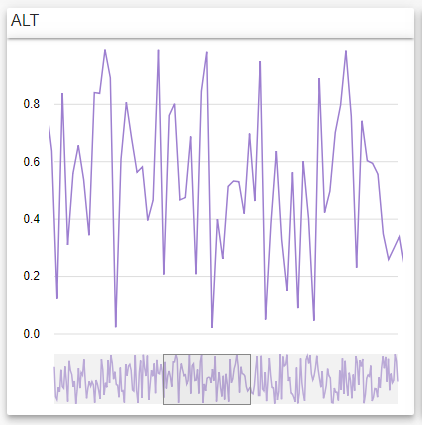
Messing with the timeline

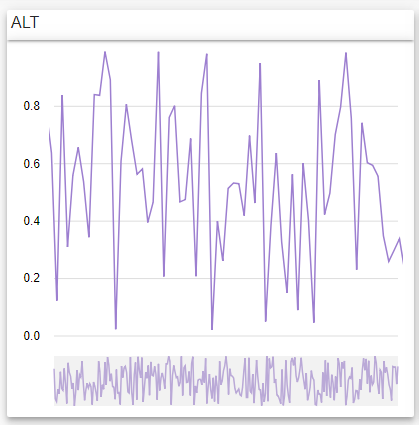
After switching the data to something completely different, that graph is now messed up with seemingly no way to fix it.
cole21771
on 21 Jul 2018
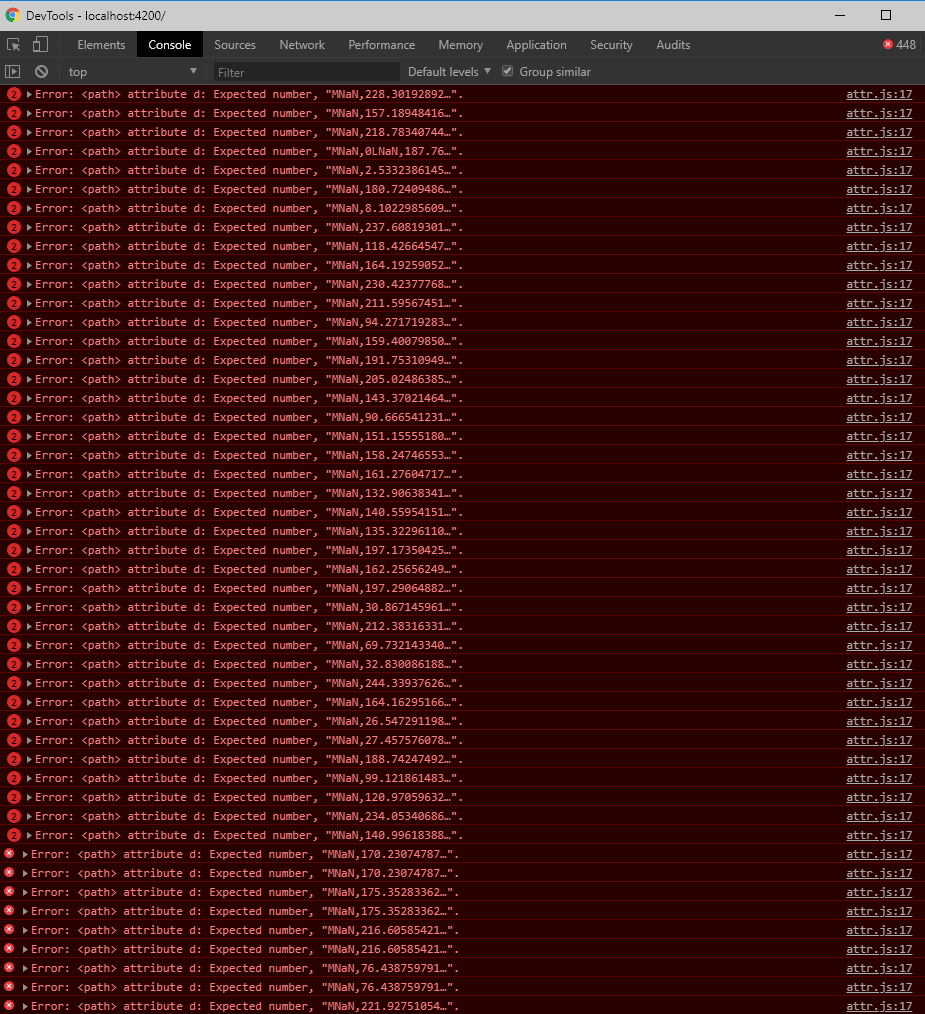
Update, lots of errors in the console when this happens confirming to me that this is not my fault (from what I can see).
cole21771
on 21 Jul 2018
Ooof, please help
cole21771
on 21 Jul 2018
@marjan-georgiev help?
cole21771
on 22 Jul 2018
Can you create a stackblitz where this can be reproduced? I'd like to look at the data you're passing.
 marjan-georgiev
on 22 Jul 2018
marjan-georgiev
on 22 Jul 2018
@marjan-georgiev Sure, working on it now. I'll get back to you soon with a stackblitz
cole21771
on 23 Jul 2018
@marjan-georgiev So for some reason I can't get this stackblitz to work. The moment I import BrowserAnimationsModule to get rid of the errors in the console it throws two new errors that I can't find any information on. https://stackblitz.com/edit/angular-hgeq9j New bug? This stackblitz is no longer active, no idea why I was having that issue (but I think it is stackblitz related, not ngx-charts related. Updated comment below).
cole21771
on 23 Jul 2018
@marjan-georgiev Not sure what was wrong with that first stackblitz, but I found one that was working, copied everything over to the new one and everything works fine and I can show you the bug. So I figured out why this occurs. It happens if you are going from datapoints (elements of the series attribute) that uses 'number' as their name type to datapoints that use 'string' as their name type.
You can see it happen here.
All you need to do to see it happen is open up the console, mess with the timeline, and then click the "Switch data" button.
So I'm not sure what you guys want to do about this as it still has problems even if you disable the timeline before switching the data.
cole21771
on 23 Jul 2018
@marjan-georgiev Another update, apparently switching the data to numbers can still cause problems with the scaling of the second data set shown by this stackblitz here. I think there needs to be an input that we can use to trigger a re-render of a particular graph in case these issues happen. Or I suppose if the bugs were to be fixed that would be cool too, or even if reported better errors in the console that would be amazing.
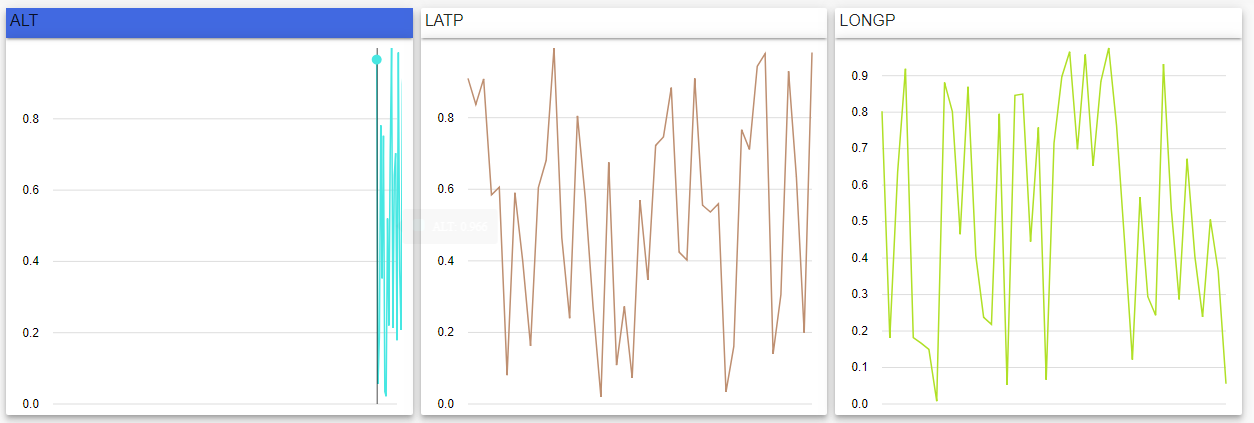
After switching it to a number instead of a string, there are no more errors in the console, but there are still problems rendering the new data.
Another issue:
After you mess with a timeline, if you don't put the timeline back to displaying all of the data, then if you change the data and go back to the original data where you messed with the timeline, the timeline itself resets while the data displayed does not.
Messing with timeline before switching data.
After switching data and then switching to the original data you can see that the graph still renders the original messed with timeline, but the timeline has reset itself.
cole21771
on 23 Jul 2018
@cole21771 upgraded the packages in the stackblitz to latest and it works:
https://stackblitz.com/edit/angular-xxgve8?file=src%2Fapp%2Fapp.component.ts
The error you were seeing was an angular/animations bug which was fixed in one of the newer versions.
marjan-georgiev
on 23 Jul 2018
I can reproduce the error where the chart doesn't show newly added data because its domain is restricted to the timeline's selection, even after the timeline has been cleared.
marjan-georgiev
on 23 Jul 2018
@marjan-georgiev Alright, so I'm guessing you're looking into it then?
cole21771
on 23 Jul 2018
I am not getting the console errors you are seeing above. I would suspect it's something in your data that is causing it, but until I have that data I can't guess.
Also, if you'd like a time scale on the x axis, I would suggest making the name property be javascript Date, rather than numbers.
marjan-georgiev
on 23 Jul 2018
I'm not working on a fix right now. A PR is welcome if you're willing to take a stab at it.
Here's what's going on. The timeline element emits an onDomainChange event whenever you make a selection in it: https://github.com/swimlane/ngx-charts/blob/master/src/common/timeline/timeline.component.ts#L157
This event is caught by the line chart component, which restricts its domain to the one passed in the event.
When the timeline selection is cleared, the component emits the whole domain it currently has. Instead, it should either emit a different event which lets the chart know that the selection has been cleared, or emit null, and change the chart the handle that case. In either case, the chart needs to clear its domain filter, so that new data properly displays.
marjan-georgiev
on 23 Jul 2018
@marjan-georgiev As for the console errors, click this link, touch the timeline, then click switch data and you'll get some errors in the console. It is amplified for me in my application since it is live data so errors continue to come in.
As for the timeline domain bug, I might take a stab at it.
cole21771
on 23 Jul 2018
Hi,
We're using your ngx chart in our project, and we have a question.
Exist and Event we can use to add functionality when you filter Timeline?
In our case, we need to scale Line Chart in all cases, including when you filter in Timeline. But not do it.
It's possible?
Thanks,
 ikermonk
on 16 Jan 2020
ikermonk
on 16 Jan 2020
Any news here?
this doesn't work for me as well.
Trying to change name property to JavaScript Date type, timeline appears, but the chart labels are showing invalid Date value for some reason

 lukaskane
on 26 Oct 2020
lukaskane
on 26 Oct 2020
This issue is stale because it has been open 60 days with no activity. Remove stale label or comment or this will be closed in 7 days.
![github-actions[bot] picture](https://avatars.githubusercontent.com/in/15368?v=4&s=40) github-actions[bot]
on 9 Jun 2021
github-actions[bot]
on 9 Jun 2021
This issue was closed because it has been stalled for 7 days with no activity.
github-actions[bot]
on 17 Jun 2021
Related issues
 LazeBear
·
19Comments
LazeBear
·
19Comments
 72gm
·
22Comments
72gm
·
22Comments
 metodribic
·
26Comments
metodribic
·
26Comments
 TolotraRam
·
24Comments
TolotraRam
·
24Comments
 molot1989
·
25Comments
molot1989
·
25Comments
Most helpful comment
I am not getting the console errors you are seeing above. I would suspect it's something in your data that is causing it, but until I have that data I can't guess.
Also, if you'd like a time scale on the x axis, I would suggest making the
nameproperty be javascriptDate, rather than numbers.