Ngx-charts: Show percentage on Pie Chart
I'm submitting a ... (check one with "x")
- [ ] bug report - search github for a similar issue or PR before submitting
- [x] feature request
- [ ] support request - use StackOverflow (add the
ngx-chartstag) or the gitter chat for support questions
Current behavior
The pie chart only shows colour for each segment, would be great to present a percentage label within the segment. (like in #687)
What is the motivation / use case for changing the behavior?
Better illustration
 LazeBear
All 19 comments
I've made a hack, it will draw the percentage based on each slice's position.
I've never played with svg before, not sure if it's correct way to do it. At least it works:)
Here is the code:
private drawOnPieChart() {
// get the ngx chart element
let node = this.basicPieChart.chartElement.nativeElement;
let svg;
for (let i = 0; i < 5; i++) {
if (i === 3) {
// this is the pie chart svg
svg = node.childNodes[0];
}
// at the end of this loop, the node should contain all slices in its children node
node = node.childNodes[0];
}
// clear the previous text if any
this.textArray.forEach(i => {
if (svg.childNodes[1]) {
svg.removeChild(svg.childNodes[1]);
}
});
// get all the slices
const slices: HTMLCollection = node.children;
for (let i = 0; i < slices.length; i++) {
// calculate the percentage
const value = this.data[i].value;
const percent = Math.floor((value / this.pieDataTotal) * 100);
if (percent > 10) {
const text = this.generateText(slices.item(i), percent);
this.textArray.push(text);
svg.append(text);
}
}
// this is a timeout, less redraw on div resize
this.textRedraw = null;
}
private generateText(g, value) {
// get boundaries
const bbox = g.getBBox();
let x = bbox.x + bbox.width / 2;
let y = bbox.y + bbox.height / 2;
// create text element
const text = document.createElementNS('http://www.w3.org/2000/svg', 'text');
// sometimes the text draw on the center of the pie, like when 60%
// adjust it slightly
if (x <= 10 && x >= 0) {
x = 50;
}
if (y <= 10 && y >= 0) {
y = 50;
}
text.setAttribute('x', '' + x);
text.setAttribute('y', '' + y);
text.setAttribute('fill', 'white');
text.textContent = value + '%';
text.setAttribute('text-anchor', 'middle');
return text;
}
I used a timeout to redraw the percentage when resize the div.
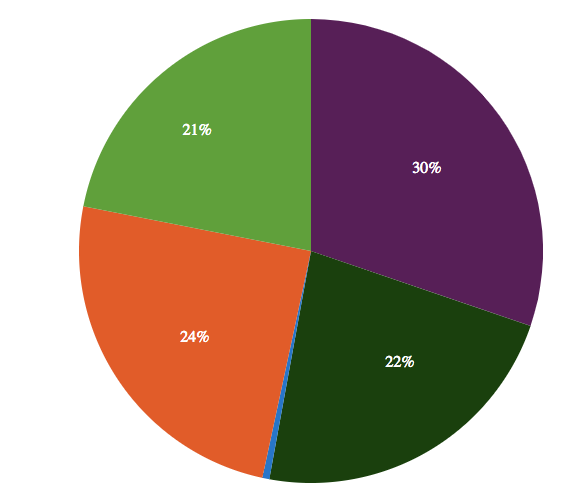
Here is how it looks:
LazeBear
on 15 Oct 2018
Updates on this? Is there a better way for this?
 MRisto-zz
on 15 Nov 2018
MRisto-zz
on 15 Nov 2018
Are there any updates on this?
 JessyRiordan
on 28 Jan 2019
JessyRiordan
on 28 Jan 2019
Any updates on the issue?
 patelnaman6
on 31 Jan 2019
patelnaman6
on 31 Jan 2019
I am also interested in this feature!
 Abdullah0991
on 4 Apr 2019
Abdullah0991
on 4 Apr 2019
Me too!
 galvakojis
on 16 Apr 2019
galvakojis
on 16 Apr 2019
I've made a hack, it will draw the percentage based on each slice's position.
I've never played with svg before, not sure if it's correct way to do it. At least it works:)
Here is the code:private drawOnPieChart() { // get the ngx chart element let node = this.basicPieChart.chartElement.nativeElement; let svg; for (let i = 0; i < 5; i++) { if (i === 3) { // this is the pie chart svg svg = node.childNodes[0]; } // at the end of this loop, the node should contain all slices in its children node node = node.childNodes[0]; } // clear the previous text if any this.textArray.forEach(i => { if (svg.childNodes[1]) { svg.removeChild(svg.childNodes[1]); } }); // get all the slices const slices: HTMLCollection = node.children; for (let i = 0; i < slices.length; i++) { // calculate the percentage const value = this.data[i].value; const percent = Math.floor((value / this.pieDataTotal) * 100); if (percent > 10) { const text = this.generateText(slices.item(i), percent); this.textArray.push(text); svg.append(text); } } // this is a timeout, less redraw on div resize this.textRedraw = null; } private generateText(g, value) { // get boundaries const bbox = g.getBBox(); let x = bbox.x + bbox.width / 2; let y = bbox.y + bbox.height / 2; // create text element const text = document.createElementNS('http://www.w3.org/2000/svg', 'text'); // sometimes the text draw on the center of the pie, like when 60% // adjust it slightly if (x <= 10 && x >= 0) { x = 50; } if (y <= 10 && y >= 0) { y = 50; } text.setAttribute('x', '' + x); text.setAttribute('y', '' + y); text.setAttribute('fill', 'white'); text.textContent = value + '%'; text.setAttribute('text-anchor', 'middle'); return text; }I used a timeout to redraw the percentage when resize the div.
Here is how it looks:
How exactly can I use this?
 hesyar
on 27 May 2019
hesyar
on 27 May 2019
Any update on this?
 Infinical
on 24 Sep 2019
Infinical
on 24 Sep 2019
Any updates?
 ali9itani
on 11 Oct 2019
ali9itani
on 11 Oct 2019
Any Updates?
 AnuroopSuresh
on 11 Nov 2019
AnuroopSuresh
on 11 Nov 2019
Just bumping this, as I am interested in some updates too.
 JoelAzevedo
on 4 Dec 2019
JoelAzevedo
on 4 Dec 2019
Any updates?
 Zhongzhen-Li
on 17 Dec 2019
Zhongzhen-Li
on 17 Dec 2019
I've made a hack, it will draw the percentage based on each slice's position.
I've never played with svg before, not sure if it's correct way to do it. At least it works:)
Here is the code:```
private drawOnPieChart() {
// get the ngx chart element
let node = this.basicPieChart.chartElement.nativeElement;
let svg;
for (let i = 0; i < 5; i++) {
if (i === 3) {
// this is the pie chart svg
svg = node.childNodes[0];
}
// at the end of this loop, the node should contain all slices in its children node
node = node.childNodes[0];
}
// clear the previous text if any
this.textArray.forEach(i => {
if (svg.childNodes[1]) {
svg.removeChild(svg.childNodes[1]);
}
});
// get all the slices
const slices: HTMLCollection = node.children;
for (let i = 0; i < slices.length; i++) {
// calculate the percentage
const value = this.data[i].value;
const percent = Math.floor((value / this.pieDataTotal) * 100);
if (percent > 10) {
const text = this.generateText(slices.item(i), percent);
this.textArray.push(text);
svg.append(text);
}
}
// this is a timeout, less redraw on div resize
this.textRedraw = null;
}private generateText(g, value) {
// get boundaries
const bbox = g.getBBox();
let x = bbox.x + bbox.width / 2;
let y = bbox.y + bbox.height / 2;
// create text element
const text = document.createElementNS('http://www.w3.org/2000/svg', 'text');
// sometimes the text draw on the center of the pie, like when 60%
// adjust it slightly
if (x <= 10 && x >= 0) {
x = 50;
}
if (y <= 10 && y >= 0) {
y = 50;
}text.setAttribute('x', '' + x); text.setAttribute('y', '' + y); text.setAttribute('fill', 'white'); text.textContent = value + '%'; text.setAttribute('text-anchor', 'middle'); return text;}
I improved position of the labels, using parametric form of equation of a circle. Someone may be interested in it until there is no such feature in ngx-charts.
(values for my pie chart are already in percents so I don't have calculations of "percent" variable)
private drawOnPieChart() {
let node = this.pieChart.chartElement.nativeElement;
let svg: any;
for (let i = 0; i < 5; i++) {
if (i === 3) {
svg = node.childNodes[0]; // pie chart svg
}
// at the end of this loop, the node should contain all slices in its children node
node = node.childNodes[0];
}
// clear the previous text if any
this.pieChartLabels.forEach(i => {
if (svg.childNodes[1]) {
svg.removeChild(svg.childNodes[1]);
}
});
const slices: HTMLCollection = node.children;
let minX = 0;
let maxX = 0;
for (let i = 0; i < slices.length; i++) {
const bbox = (<any>slices.item(i)).getBBox();
minX = Math.round((bbox.x < minX ? bbox.x : minX) * 10) / 10;
maxX =
Math.round(
(bbox.x + bbox.width > maxX ? bbox.x + bbox.width : maxX) * 10
) / 10;
}
for (let i = 0; i < slices.length; i++) {
const percent = this.data[i].value;
let startingValue = 0;
for (let j = 0; j < i; j++) {
startingValue += this.data[j].value;
}
if (percent >= 2) {
const text = this.generateText(percent, maxX - minX, startingValue);
this.pieChartLabels.push(text);
svg.append(text);
}
}
}
private generateText(percent: number, diagonal: number, startingValue: number) {
// create text element
const text = document.createElementNS('http://www.w3.org/2000/svg', 'text');
const r = Math.round(diagonal / 2.5);
// angle = summed angle of previous slices + half of current slice - 90 degrees (starting at the top of the circle)
const angle = ((startingValue * 2 + percent) / 100 - 0.5) * Math.PI;
const x = r * Math.cos(angle);
const y = r * Math.sin(angle) + 5;
text.setAttribute('x', '' + x);
text.setAttribute('y', '' + y);
text.setAttribute('fill', 'white');
text.textContent = percent + '%';
text.setAttribute('text-anchor', 'middle');
return text;
}
 realny10
on 10 Jan 2020
realny10
on 10 Jan 2020
Any updates yet?
 ExSpecter
on 28 Apr 2020
ExSpecter
on 28 Apr 2020
any plan to support this feature ?
 HDaghash
on 18 Jun 2020
HDaghash
on 18 Jun 2020
waiting for this feature.
 TheMuyu
on 4 Aug 2020
TheMuyu
on 4 Aug 2020
Any news to this?
 viertel97
on 5 Nov 2020
viertel97
on 5 Nov 2020
Any news to this?
This issue has been opening for 2 years and no update for this requested feature.
TheMuyu
on 5 Nov 2020
My children, please add this to your angular code to add percentages to the labelling:
setTimeout(function(){
    let labels = $('.pie-label');
    for (let label of labels){
      label.innerHTML += "%";
    }
}, 100)
It's not ideal, but it works.
You are welcome.
 samguergen
on 24 Nov 2020
samguergen
on 24 Nov 2020
Related issues
 faisalnet5
·
3Comments
faisalnet5
·
3Comments
 sjdemoor
·
3Comments
sjdemoor
·
3Comments
 jvbianchi
·
4Comments
jvbianchi
·
4Comments
 Hypercubed
·
3Comments
Hypercubed
·
3Comments
 merinshaji
·
3Comments
merinshaji
·
3Comments
Most helpful comment
My children, please add this to your angular code to add percentages to the labelling:
It's not ideal, but it works.
You are welcome.