Ngx-charts: Support for zoom and pan in line charts
Hi.
Is there a reason this library does not support zoom in/out with the mouse into x/y axes (and maybe also pan)?
For example, flot.js supports this (example: http://www.flotcharts.org/flot/examples/navigate/index.html).
This is a very basic feature for working with graphs. It will be very nice if you'll support it.
Thanks.
 yagilofir
All 7 comments
We do have zoon and pan, but not directly in the chart. You can set the timeline input to true, and you will get this:
https://plnkr.co/edit/hTPaexbMyYbX8xJC38Ja?p=preview
The reason this is not inside the chart is because the mouse events inside the chart are used for things like tooltips and select.
 marjan-georgiev
on 5 Jul 2017
marjan-georgiev
on 5 Jul 2017
Thanks for the short reply.
I saw the timeline feature before opening this issue. It's a very good feature but it doesn't have a y-axis zoom. Sometimes the user just want to see all values between y1 and y2 (zoom in/out within the y-axis), just like the flot example I showed.
Are the mouse wheel events taken for tooltip/select ? Cause I really think the mouse wheel events should be used for zoom in/out.
Thanks.
yagilofir
on 5 Jul 2017
The mouse wheel events are not used, but the mouse over and click events are.
This kind of feature can be built as a custom chart, because I don't think we have plans to add it to the line/area charts at this point. You could copy the line chart and implement it on top of it.
marjan-georgiev
on 5 Jul 2017
According to documentation timeline is
Only available if x scale is date
Why is it limited to only x scale date?
I would like to use timeline with my data, but since the name values are not dates but numbers (milliseconds in this case), it doesn't work.
Edit. I think this is an issue of it's own so I open new issue.
 thetravis
on 6 Nov 2017
thetravis
on 6 Nov 2017
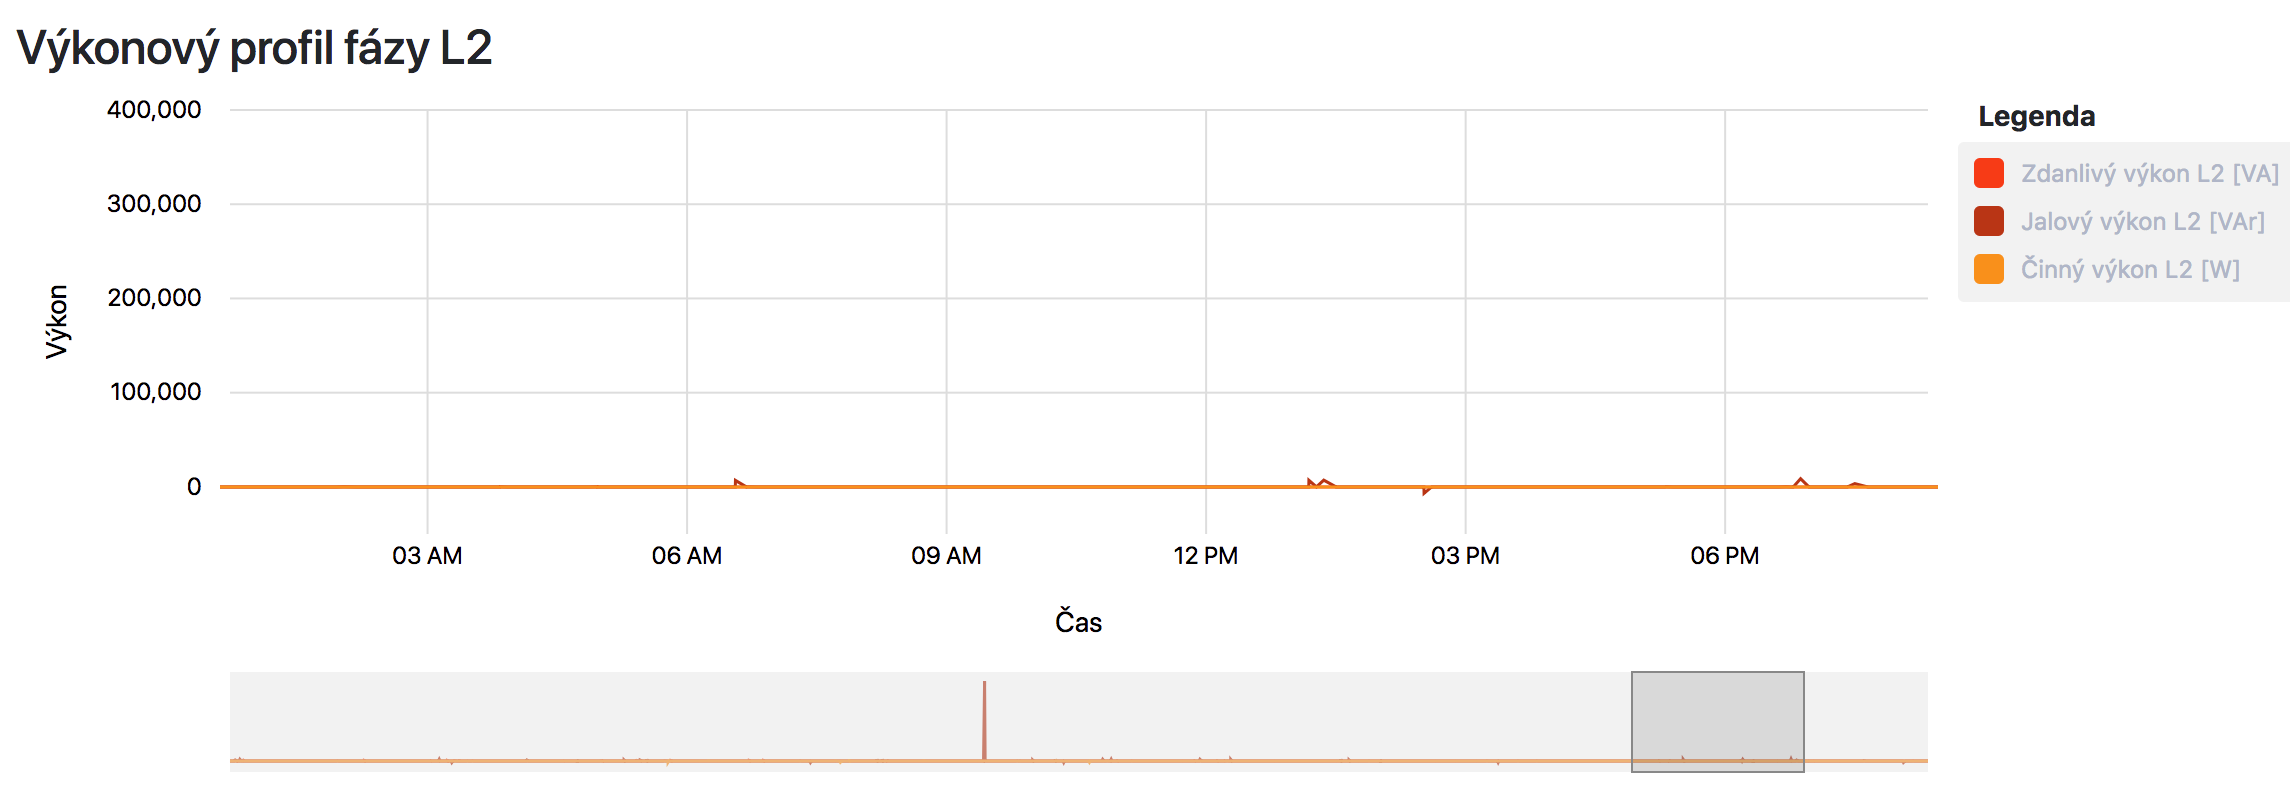
This feature would be useful; at least autoscaling (zooming) y-axis when selecting certain time range on the timeline.
Motivation:
I have a line chart where usual y-axis domain is in range <-100;100>. However, sometimes a value can jump up to 100,000 and all them "low values" disappear even if I select time range with only them in scope.
_Figure A.: Full range of time and values selected_
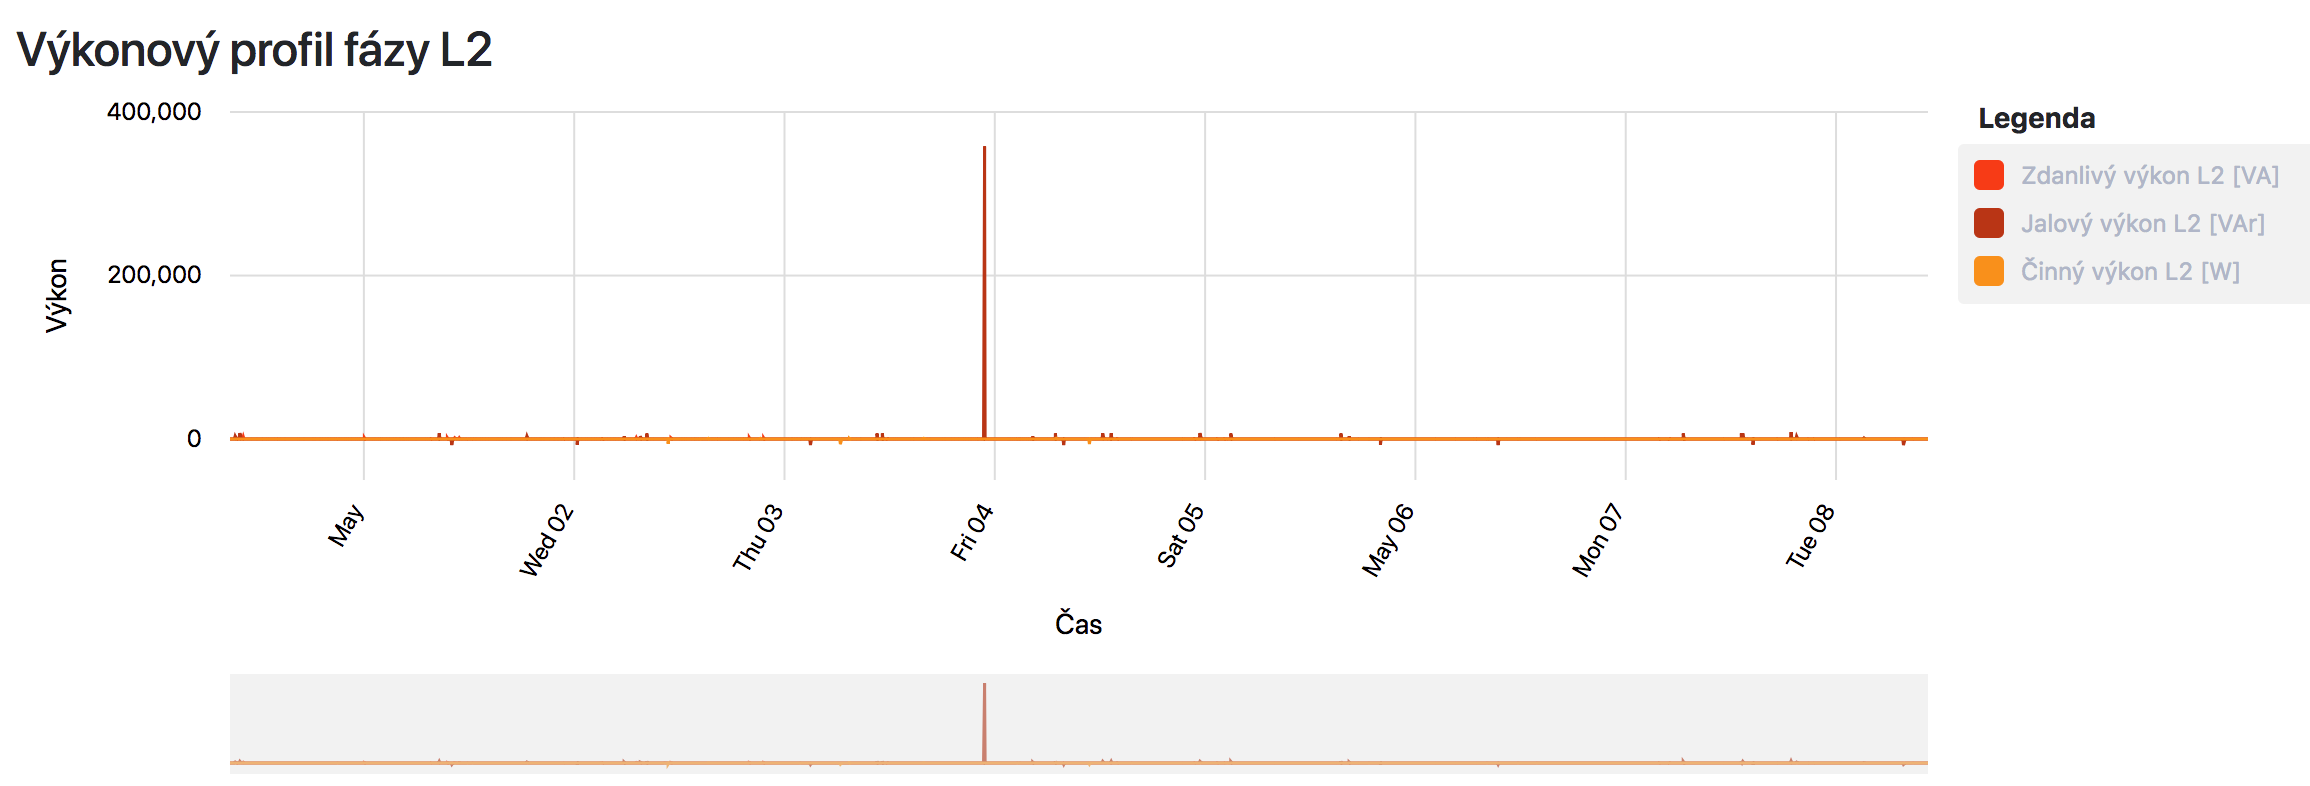
_Figure B.: Only small range of time and values selected (should adjust y-axis domain to e.g. <-100;100>)_
 xdom
on 8 May 2018
xdom
on 8 May 2018
Yeah, Autoscaling would be very usefull, HighCharts has it
But i'm not planning to use HighCharts ever again 😜
 blogcraft
on 7 Aug 2018
blogcraft
on 7 Aug 2018
It looks like the timeline feature technically works with numbers too, even though it was probably designed for dates, this makes it much more useful, but it still won't help those of us wanting to use it for the purpose of zooming when the values are strings :( I also would like to be able to zoom any chart type, so this doesn't help for charts like bubble charts
 chriszrc
on 11 Sep 2019
chriszrc
on 11 Sep 2019
Related issues
 ChitrajanDhiman
·
23Comments
ChitrajanDhiman
·
23Comments
 sjdemoor
·
20Comments
sjdemoor
·
20Comments
 Enngage
·
22Comments
Enngage
·
22Comments
 allensutton
·
24Comments
allensutton
·
24Comments
 TolotraRam
·
24Comments
TolotraRam
·
24Comments
Most helpful comment
This feature would be useful; at least autoscaling (zooming) y-axis when selecting certain time range on the timeline.
Motivation:
I have a line chart where usual y-axis domain is in range <-100;100>. However, sometimes a value can jump up to 100,000 and all them "low values" disappear even if I select time range with only them in scope.
_Figure A.: Full range of time and values selected_

_Figure B.: Only small range of time and values selected (should adjust y-axis domain to e.g. <-100;100>)_
