Ng2-charts: Bar chart columns fail to render above a certain width
I have a bar chart where I want to render hundreds of columns. It works well at the beginning, however columns fail to show up above a certain index.
My chart isn't complex, I only used a few necessary configurations, however the dataset is fairly large.
Stackblitz example: https://stackblitz.com/edit/angular-wrvgme
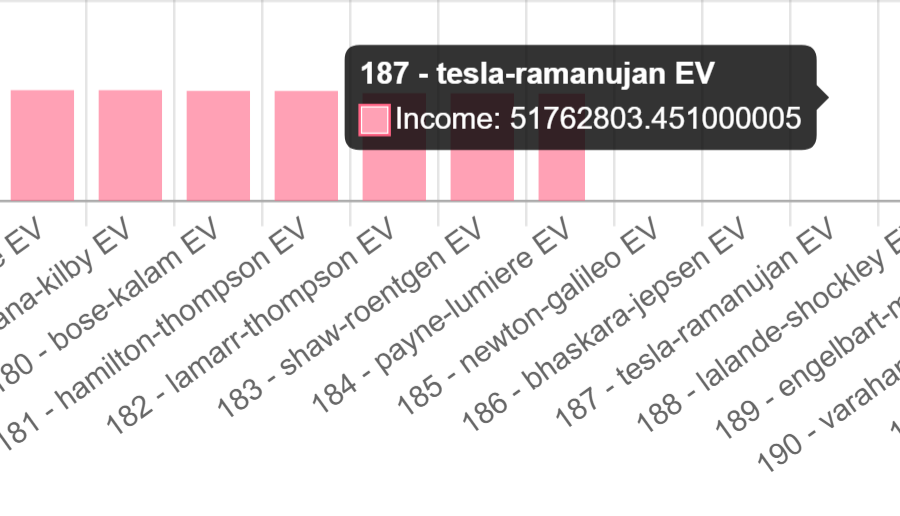
In the example the first 183 column are correctly rendered, the 184th is only partly and above that the columns are not visible, but they are "there" since the tooltip on mouseover actually works.
Full disclosure, I posted this issue before on StackOverflow, but no solution was posted as of yet: https://stackoverflow.com/questions/63299071/ng2-charts-chart-js-bar-chart-columns-fail-to-render-above-a-certain-width
 bbarn3y
All 16 comments
It works well for me, both on Firefox 80 and Chrome 84.
 EugeneLeclerc
on 26 Aug 2020
EugeneLeclerc
on 26 Aug 2020
Very weird, Chrome 85.0.4183.83:
On Firefox 79.0 it's even weirder for me:
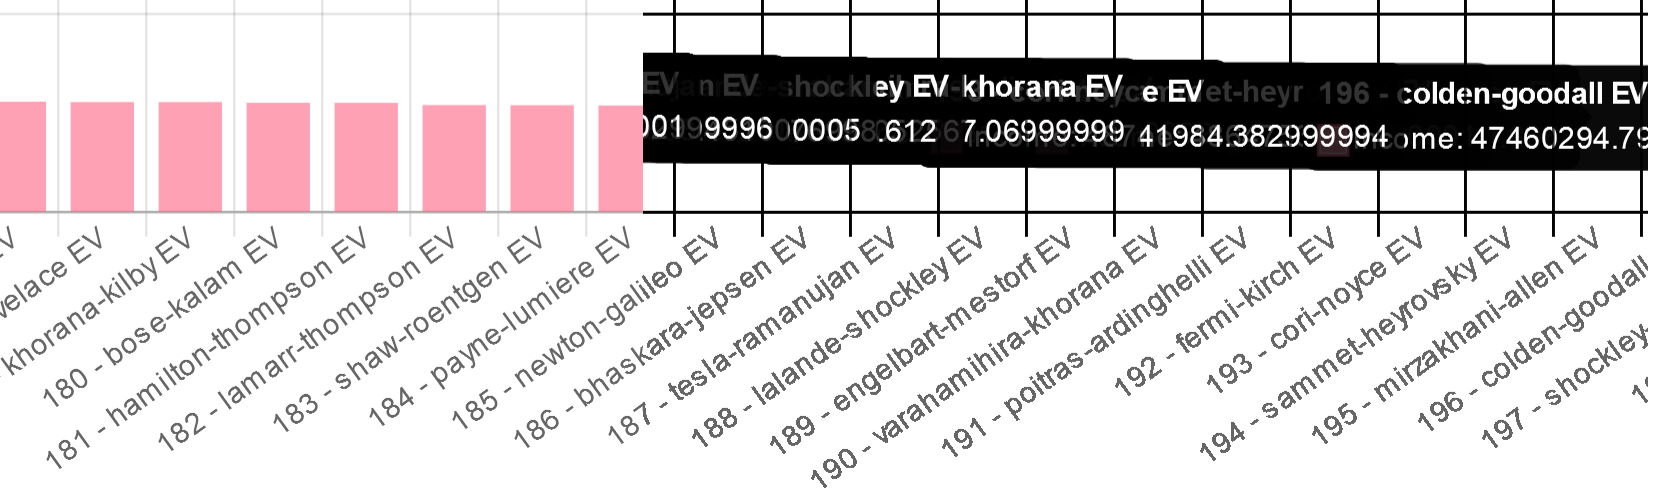
After that invisible line the grid lines are darker and the tooltips get stuck, just like winning Solitaire :)
bbarn3y
on 27 Aug 2020
Tested on mobile as well:

bbarn3y
on 27 Aug 2020
Well I have absolutly no idea how can this happen. Good luck !
EugeneLeclerc
on 27 Aug 2020
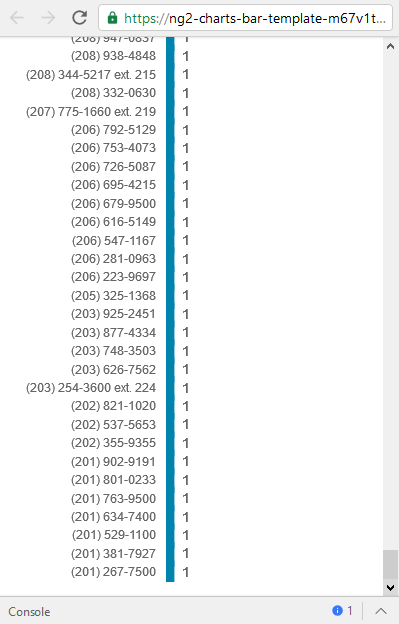
I'm having same issue in horizontalBar version
https://stackblitz.com/edit/ng2-charts-bar-template-m67v1t
Any ideas?
 martinpagesaal
on 28 Aug 2020
martinpagesaal
on 28 Aug 2020
HorizontalBar works well for me too... There must be some kind of common denominator between both of you.
EugeneLeclerc
on 28 Aug 2020
@EugeneLeclerc it works ok for small amount of bars it's starts failing with 100 or 200+. Do you have a working example of horizontalBar with that amount of bars?
martinpagesaal
on 1 Sep 2020
Yes, your exemple (https://stackblitz.com/edit/ng2-charts-bar-template-m67v1t) works ok for me, even beyond 200 bars :
Same thing for vertical bars (https://stackblitz.com/edit/angular-wrvgme) :

The question is : why is it working for me and not for you ? And I have no idea of the answer.
EugeneLeclerc
on 1 Sep 2020
🤔 @EugeneLeclerc oh... fun
Chrome? what version?
BTW I just tested it in Safari and it worked.
It fails for me with Chrome Version 84.0.4147.125 (Official Build) (64-bit)
martinpagesaal
on 1 Sep 2020
I tested with both Chrome Version 84.0.4147.135 (Official Build) (64 bits) and Firefox 80.0 (64-bit). I seriously know nothing about JS and front-end in general so I dont know if it can change anything, but I have 16 Go of RAM and I'm using the latest Windows 10 Enterprise Edition.
EugeneLeclerc
on 1 Sep 2020
Huh, both @martinpagesaal's and my example work fine for me now.
Firefox version 80.0, Chrome version 85.0.4183.83.
I'm testing on the exact same machine. The issue occured previously with Firefox version 79 and Chrome version 85.0.4183.83, so my Firefox version changed since then, but my Chrome version did not. I can't think of anything else that changed since then.
bbarn3y
on 1 Sep 2020
Could it be an issue with https://stackblitz.com/ itself ?
EugeneLeclerc
on 1 Sep 2020
Nope, I have a production website that I can't link here, but I'm experiencing the exact same things there.
bbarn3y
on 1 Sep 2020
Yeah, same here. Stackblitz is just a small example, I have a issue in prod as well
martinpagesaal
on 1 Sep 2020
It could be a memory issue due to the large canvas size.
The HTML canvas has some memory constraints that are not immediately obvious, and that can cause all sorts of problems, from weird clipping to blurry rendering and crashes.
The canvas in the stackblitz demo has 10650 x 937 pixels when viewed fullscreen (on my PC it works correctly).
While this is well within limits for Chrome (16,384 x 16,384), it might be too large on devices with low memory.
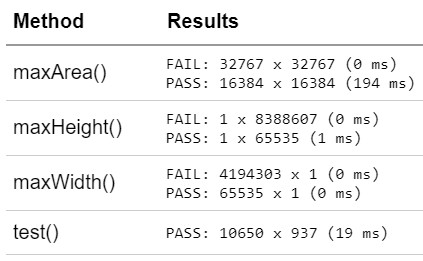
There is a library to test the max supported area: https://github.com/jhildenbiddle/canvas-size
Can you run it on your device and see what it says?
 danmana
on 22 Sep 2020
danmana
on 22 Sep 2020
Thanks for the assessment, tested with the provided size (10650 x 937), got the following results:
However, since one of the latest Chrome updates, my original stackblitz example started working for me perfectly. Tested on Firefox too and the issues disappeared for me there as well.
Asked my client directly, he said that for him the issue was fixed on Chrome, but still pops up on Firefox (the codebase did not change at all).
I'm not sure what caused the issue (or what's causing it still on certain machines), but the issue is likely not with ng2-charts, but somewhere deeper, so I'll close this issue.
bbarn3y
on 24 Sep 2020
Related issues
 dj-techs
·
3Comments
dj-techs
·
3Comments
 shenriksen4
·
3Comments
shenriksen4
·
3Comments
 sarn3792
·
4Comments
sarn3792
·
4Comments
 grahammutter
·
4Comments
grahammutter
·
4Comments
 hggeorgiev
·
4Comments
hggeorgiev
·
4Comments